
 ?Mathematical formulae have been encoded as MathML and are displayed in this HTML version using MathJax in order to improve their display. Uncheck the box to turn MathJax off. This feature requires Javascript. Click on a formula to zoom.
Abstract
This research investigates the impact of corporate social responsibility (CSR), industrial integration, and economic growth in realising financial constraints using firm’s level attributes of sustainable performance. In doing so, this study utilised annual data of 555 Chinese real estate firms from 2015 to 2019 and applied a spatial effect model (SEM) to integrate spatial effects. This study also used two-step Generalized Method of Moments (GMM) and two-stage least square (2SLS) methods to deal with possible endogeneity. Manifestly, we have constructed a mathematical derivation framework based on linear algebra and offer easy computing Moran's index. The preliminary results revealed that CSR, industrial integration, and economic growth reduce financial constraints of listed real estate companies in China. However, these effects are not persistent at different stages of development. The findings of Moran index describe that the early and growth stages of CSR instigate financial constraints while the mature stage of CSR produces inhibitory effects that reduce financial constraints. Notably, these effects also varied across different regions. This outcome offers valuable policy recommendations.
1. Introduction
In the twenty-first century marketplace, real estate companies are increasingly showing signs of becoming conscious of ethics and human rights and being economically, environmentally, financially and socially responsible. Researchers have found a strong correlation between corporate social responsibility, economic growth, industrial integration, and financial constraints of businesses (Khan et al., Citation2021; Kwak & Choi, Citation2015; Zhao & Xiao, Citation2019). However, less is known regarding real state industries of China, which follows distinct features based on high industrialised society. Therefore, the fundamental motivation of this study is to explore the possible financial constraints (FC) such as corporate social responsibility (CSR), economic growth (GDP), and industrial integration of Chinese real estate companies. Initially, this study examines the impact of these factors on FC, and subsequently the mutual association between them.
Against the above backdrop, industry statistics showed that over 30% of worldwide CEOs recorded CSR as the most crucial problem for their companies, while another 40% considered it critical to sustainable firm performance (The Economist, Citation2008). CSR theories are primarily based on the concept of fostering a healthy and sustainable society and business environment (Hazlett et al., Citation2007). The CSR stakeholder theory offers the most compelling theoretical insights into how to conceive the word CSR, and the current study embraces Freeman's (Citation1984) framework. This study aims to analyze data from Chinese real estate businesses to discover the impacts of CSR, GDP, and industrial integration life cycle on FC using the theory of spatial autocorrelation. One of the most critical concerns that all businesses must address is FC, as Zhao and Xiao (2019) find that CSR has an impact on FC. The influence of CSR on FC distributes throughout the companies. Love (Citation2003) investigates the relationship between investment efficiency and economic growth that increased economic growth increases investment efficiency by lowering the FC in businesses. Prior studies on the link between CSR and FC (Chan et al., Citation2017) disclosure of social responsibility might put a company at a competitive disadvantage in the marketplace. Rajan and Zingales (Citation1998) experimentally discovers that a rise in economic growth would influence industrial development if the industry mainly relies on external financing.
We attempt to assess the limited empirical evidence for the potential role of Chinese real estate companies in facilitating collective action responses by export-oriented real estate companies. FC must be a greater concern for economic growth when the financial sector is underdeveloped. Windsor (Citation2006) indicates that financial success and CSR increase simultaneously, regardless of whether the government or ethical considerations influence the operations. The Moran's index model was used to determine if a real estate company was early, mature, growing, or decreasing stages. Regression analysis and the OLS model are used to determine the effects of CSR, GDP, and industrial integration on FC. For the robustness check, we additionally utilise the Two-Stage Least Squares (2SLS) estimate technique and the two-stage Generalized Method of Moments (2step-GMM) to adjust for endogeneity.
Furthermore, we re-estimate the empirical model using other definitions of FC and CSR to observe if the results are affected by these measurement difficulties or not. In this scope, this study investigates the link between CSR, GDP, and industrial integration to determine the relevance of these elements in the investment growth of Chinese real estate firms using spatial correlation approach. The findings of the spatial correlation approaches produce superior outcomes. Bivand et al. (Citation2009) offers various spatial correlation metrics to examine the spatial process of geographical change from multiple perspectives. Moran's index is almost equal to Geary's coefficient Moran PAP (Moran, Citation1948). Notably, the spatial correlation function is a particular instance of spatial autocorrelation. The Moran index effect model was used to explain the link between variables. Manifestly, the impact of industrial integration on FC is significant since it directly influences the effect of CSR on the FC of Chinese real estate businesses.
The residual of our article organises as follows: the critical literature reviews in Section 2. The methodology, hypothesis, some other vital variables use present in Section 3. The empirical analysis results and robustness test findings are reported in Section 4. In Section 5, we list the conclusions and references.
2. Literature review
2.1. Financial constraints (FC)
Capital markets convert these liquid financial assets into long-term capital investments in illiquid manufacturing processes at the same time, the industrial revolution necessitated enormous capital investments over extended periods (Bencivenga et al., Citation1995). GDP decreases the number of businesses that rely on external financing in this way. Wurgler (Citation2000) also showed that greater levels of economic growth enhance and those nations with higher levels of economic growth invest more in rising industries. According to Campello and Graham (Citation2007), the positive effects of FC on greater capital investment and business earnings have already been demonstrated. According to Demirguc-Kunt and Maksimovic (Citation1998), business growth supported by external financing is favourably related to a country's economic growth. This monetary motivation for CSR has a lot of clout among practitioners and policymakers, and it's backed up by evidence. The impact of Chinese commercial banks' industrial integration effects on financial constraints of enterprises, finding that the financial integration's information and decision-making effects can help companies deepen their relationship with banks and obtain financing convenience to alleviate financing constraints (Wan et al., Citation2015). The study discovered that industrial-financial reduced FC through knowledge and associated effects and that this impact is more substantial in samples when the industrial policy is not supported. In the industrial policy framework, Zhou and Tan (Citation2018) investigated the influence of financial initiatives on corporate FC. Furthermore, several studies have found that the capital market and administration of a nation influence the efficiency of industrial-financial integration.
2.2. Corporate Social responsibility (CSR)
In the field of business ethics, CSR is an important research domain. Existing CSR theories imply that a company's survival, continuity, and growth are all dependent on society. Societies are more likely to have a good image of businesses if firms treat them fairly (Husillos et al., Citation2011). ‘CSR’ refers to an emerging movement that aims to incorporate social and ecological factors into corporate business decisions and economic growth (McKinley, Citation2008). The firm's life cycles and consider it while making investment decisions to reduce risk. The link between CSR, agency constraints and financial investment sensitivity was investigated by Moradi et al. (Citation2018). We believe that companies with a high value on CSR have superior CSR and influence FC through two methods. First, greater CSR performance necessitates a high level of stakeholder participation and cooperation based on trust (Andriof & Waddock, Citation2002). The companies with higher CSR performance are more likely to provide CSR reports and strategies (Hubbard, Citation1998). Due to information asymmetry and agency issues in developing markets, the cost of external funding is typically greater than that of internal sources, putting companies under financial constraints. Most previous research has found that CSR disclosure can reduce financial constraints. In growing markets like China, the relevance and necessity of non-financial information disclosure are more evident. Furthermore, a slew of similar research articles show that FC as a result of expensive foreign funding is more prominent in undeveloped financial markets.
2.3. The relationship between CSR and FC
The lower the degree of financial constraints, the more commercial credit downstream companies get, and the lower the degree of financing constraints, the more commercial credit given by upstream enterprises (Jiang et al., Citation2013). Due to diverse findings, we wonder which variables contributed to the diverse research outcomes, whether CSR involvement improves a company's financial success or other factors (Inoue & Lee, Citation2011). Intuitively, firms have financial constraints, and the more severe the constraints are, the greater the demand of external access for everyday operations and future expenditures. Cash flow sensitivity is the best indicator of a company's financing constraints (Almeida et al., Citation2004). The issues such as ownership structure and local CSR participation might mitigate the link between CSR and finance constraints (Husted et al., Citation2016). We suggest that firm-level heterogeneity can impact the CSR-FC relationship in addition to the external institutional context. Transaction constraints, agency difficulties, and information asymmetry, according to traditional ideas, cause FC (Gertler, Citation1992). On the other hand, good CSR performance may assist businesses in establishing a strong corporate image and gaining a positive reputation. According to Wood and Logsdon (Citation2002), intangible assets are valuable intangible assets that simplify borrowing money from banks and other financial institutions, making it easier for businesses to see a good link between CSR and financial success (Saeidi et al., Citation2015). In recent studies, CSR has gained popularity as a concept and a practice. Backman (Citation1983) defines CSR as the polar opposite of corporate social responsibility. McGuire (Citation1963) classified a company's obligations into three categories: economic, social and legal. In terms of potential linkages between CSR and financial reward, most research has shown that CSR can considerably reduce corporate FC. Platonova et al. (Citation2018) discovered a significant positive relationship between CSR and financial performance. Many studies have looked into the link between corporate social responsibility and financial performance (Mehralian et al., Citation2016).
2.4. The relationship of CSR, GDP, industrial industry and FC
The higher the efficiency of resource allocation and the lower the degree of FC, increased economic growth should enhance investment efficiency by lowering FC in a company (Castro et al., Citation2015). Accountability and agency concerns have been reported to be more prevalent in nations with less developed capital markets, fewer financial institutions, laxer rules and regulations, inadequate monitoring and transparency systems (Levine, Citation2005). The connection between the financial and real economies has long piqued people's attention and sparked heated discussion. The financial sector's potential role in fostering development was recognised as early as Schumpeter (Citation1912); however, this viewpoint was challenged by many economists in the decades that followed (Lucas, Citation1988). On the other hand, Joan Robinson (1952) asserts that ‘where entrepreneurship leads, finance follows’. It implies that economic growth generates demand for specific sorts of financial arrangements, which the financial system naturally reacts to. Furthermore, some economists do not believe that the link between finance and growth is significant. Economists ‘badly over-stress’ the significance of financial variables in economic growth, according to Robert Lucas (1988), whereas development economists regularly express doubt about the impact of the financial sector (Chandavarkar, Citation1992). In reality, empirical studies are being conducted in numerous developing nations to evaluate the effect of financial liberalisation and growth in lowering businesses' costs. Other research looks at how foreign investment and capital account liberalization affect financial constraints. Harrison et al. (Citation2004) investigate whether increased foreign direct investment (FDI) inflows are linked to a reduction in firm-level financing constraints, finding that FDI does indeed reduce constraints. Meanwhile, after looking at the instance of Ivory Coast, Harrison and McMillan (Citation2003) concludes that this effect is not substantial. Beck (Citation2008) argued that economic growth is the most significant macroeconomic indicator amongst others. Similarly, Shahbaz et al. (Citation2017) discovered that economic expansion had a beneficial impact on economic activity in India and China. By neglecting the importance of the financial system in the economic growth process (Chandavarkar, 1992), Mian and Sufi (Citation2014) have claimed that a poorly regulated financial system might invite crises, which can negatively affect the economy and societal welfare. According to Garriga and Melé (Citation2004), there are four types of CSR theories, which consider CSR a strategic instrument for accomplishing economic goals. CSR and financial hardship are popular study subjects and distinctly evaluated (Degan, 2002). Corporate CSR participation can be motivated by various factors, ranging from cultural and social constraints to economic growth and financial constraints. Moser's presents a broader view of CSR activities and reporting, which encompasses any business actions that impact stakeholders. According to Attig et al. (Citation2013), enhanced financial performance for strongly CSR-oriented firms’ from the development of stronger exchange relationships with key stakeholders, customers, creditors, and employees or mitigation of government intervention and the enhancement of future revenue growth. Cheng et al. (Citation2014) discovered that businesses with a higher CSR orientation have more stakeholder involvement and openness around CSR performance, which helps to reduce capital constraints. In contrast to frictionless financial markets, FC might be anticipated to diminish businesses' creative activity and its influence on their economic success by reducing R&D spending (Brown et al., Citation2009). Despite some methodological flaws, which we will discuss later, this work established a very influential stream of research in which cash flows are placed at the centre of the identification strategy and financing distress and traditional investment regressions (Kaplan & Zingales, Citation2000). This analytical approach has offered validation of FC to physical investments in several settings in both its standard formulations and later revisions (Almeida & Campello, Citation2007). Patents are common intermediate innovation output demonstrated in the literature to be influenced by FC in various ways, including the size bias of patenting activity, the result of patent races, and the economic exploitation of patented innovations (Luzzi, Citation2014).
2.5. The life cycle of real estate companies
Furthermore, Dutta and Nezlobin (Citation2017) concludes that a firm's growth trajectory is essential in defining the balance between information disclosure and risk. The financial impact of a company's CSR is a fluid process. In different stages of the life cycle, the companies demonstrate varying levels of awareness and capacity in terms of social responsibility. According to the life cycle theory (Adizes, Citation2004), the challenges that businesses encounter are mostly impacted by the stages of the life cycle. Recent accounting and finance empirical research has looked at the influence of the business life cycle on corporate investment, financing and dividend decisions (Berger & Udell, Citation1998). Firms are more likely to make comparatively bigger, growth-oriented investments in the early stages. In contrast, their investments in the later stages are more likely to be directed towards maintaining existing assets (Richardson, Citation2006). At each stage of the life cycle, CSR practices must be tailored to the company's overall strategy. The financial effect of CSR is dynamic, and we suggest that the real estate industry's life cycle is an underappreciated factor that impacts the CSR-FC link. Because the samples chosen are publicly traded firms, the initial phase is removed from the enterprise life cycle and separated into the growth, maturity and recession periods.
3. Research methodology
3.1. Data Selection procedure
We obtain CSR data from the Hexun website (www.hexun.com), China's first vertical financial portal website. We have obtained data of 765 real estate companies listed on HUB China Real Estate Companies database ‘https://www.crunchbase.com/hub’ China Index Academy (CIA) database ‘https://academy.cih-index.com/en’ and Data index analysis database ‘http://chinaindexholdings.com/en’ for 2015–2019. Then we have selected 555 firms out of these 765 financial firms as samples. The following is the major sample selection process: (1) eliminating non-financial firms. (2) Excluding businesses that did not operate consistently from 2015 to 2019. (3) All businesses with missing data are excluded. displays the research variables in a categorised format.
Table 1. Represents the classification of research variables.
Initially, this study used OLS model to determine the effects of CSR, GDP, and industrial integration on FC and subsequently apply the Two-Stage Least Squares (2SLS) estimate technique and the two-stage Generalized Method of Moments (2step-GMM) to deal with possible endogeneity. We also evaluate the spatial process of geographical change from different viewpoints using spatial correlation metrics.
3.2. Research hypothesis development
3.2.1. Hypothesis of CSR, GDP, industrial integration and FC
Firms at different life cycle periods have varied perceptions of social responsibility and will use different CSR methods. We argue that appreciating CSR in the workplace improves CSR and impacts funding constraints via two methods. First, greater CSR performance necessitates a high level of stakeholder participation and cooperation based on trust (Andriof & Waddock, 2002). Prior research has found that CSR can ease financial constraints in three ways, but we believe that the benefit will be minimal among early stage businesses. The following are the specific reasons. The start-ups frequently lack sufficient cash and rely heavily on internal financing, private investment, and venture capital (Adizes, 2004). More reliable statistics and financial information on CSR strategy are released, which reduces information asymmetry between corporations and investors and, as a result, lowers funding constraints. The degrees of information asymmetry and agency conflicts differ throughout life cycle stages. Financial performance is either neutral or impaired due to CSR, education, healthcare, women's empowerment, environmental sustainability, infrastructure development, and disaster assistance are all examples of CSR activities in businesses. However, not all businesses have CSR programs that contribute to the many components of inclusive growth. Furthermore, the Chinese capital market indicates that businesses in the early stages of their life cycles typically engage in little CSR while facing significant financial constraints. As a result, our first testable hypothesis on whether disclosing a CSR report adds to budgetary constraints is as follows:
H1: CSR has a significant inhibitory effect on the FC of listed real estate companies.
Firms at the mature stage of their life cycle have advanced significantly. As a result of their improved CSR performance, their connection with the government and banks improves. As a result, the company may receive external financing at a cheaper cost (Dhaliwal et al., Citation2012). In mature businesses, the governance influence of CSR is completely represented. Furthermore, mature businesses establish a positive corporate image and competitive advantages in the marketplace by paying greater attention to fair prices, higher quality products, services, and product safety via different socially responsible cognitions. As a result, we arrive to our third hypothesis:
H2: The degree of industrial integration (conpsm) has a significant inhibitory effect on the FC of listed real estate companies.
Firms in the growth stage of the life cycle have already made it through the difficult start-up period and have settled into a more stable business model. Tao and Wang investigated the relationship between government public health spending and economic growth, concluding that government spending influences economic growth (GDP) directly and indirectly by increasing worker quality. The spatial lag model (SLM), spatial error model (SEM), and spatial data model (SDM) are all common spatial econometric models. SDM is designed to explore the impacts of economic growth (GDP) on financial constraints in a comprehensive manner (FC). The hypothesis of spatial econometric analysis is to measure the spatial distance between two regions, with spatial contiguity being a common distance measurement to define two spatial units. The function of economic growth is critical because economic growth (GDP) may improve a country's economic efficiency.
H3: GDP has a significant role in promoting the FC of listed real estate companies.
3.2.2. Hypothesis CSR of companies at the early, growth, mature and declining stages
The CSR of companies at the early, growth, mature, and declining stages of their life cycle has a significant role in promoting the financing constraints of listed real estate companies
H2a: The CSR of companies at the early stage of their life cycle has a significant role in promoting the FC of listed real estate companies
H2b: The CSR of companies in the growth stage of their life cycle has a significant role in promoting the FC of listed real estate companies
H2c: The CSR of enterprises in the mature stage of the life cycle has a significant inhibitory effect on the FC of listed real estate companies
H2d: The CSR of companies in the declining stage of life cycle has no significant impact on the FC of listed real estate companies
3.3. Research design
3.3.1. Regression equations for CSR, GDP, industrial integration and FC
FC is the dependent variable, while GDP, CSR, and industrial integration (conpsm) are independent variables which are alternatively applied in Equationequation 1(1)
(1) , Equation2
(2)
(2) and Equation3
(3)
(3) after controlling three key attributes of investment theory i.e. Leverage (lev), Dividend Payment Ratio (divschg), Sustainable Growth Rate (sustrt):
(1)
(1)
(2)
(2)
(3)
(3)
To estimate the above equations, we use OLS regression with heteroskedasticity-consistent robust standard errors clustered at the firms’ level. It is important to note that our research model is unlikely to suffer from endogeneity because companies do not choose their headquarters locations in order to disclose CSR information. EquationEquation 4(4)
(4) portrays the impact of all regressors collectively on FC.
(4)
(4)
Where CSR = corporate social responsibility, LEV = short-term and long-term debt divided by total assets; GDP = economic growth, conpsm = industrial integration, divschg = dividend payment ratio, Tobinq = Investment Opportunity, sustrt = Sustainable Growth Rate. Where Life Cycle = lifecycle model measured as retained earnings scaled over total assets (RE/TA), CSR*Life Cycle = an interaction term comprising the life cycle variable multiplied by CSR.
3.3.2. Four stages Moran index model equations
Since the impact factors of CSR of Chinese real estate companies vary from four perspectives of financing constraints, managers, scale, and company's financial status, this study introduces several independent and control variables to disclose the complex relationships. According to the model proposed by Whited and Wu (Citation2006), we have constructed four Stages Moran index model equations-(i-iv) are follows.
LnFC = LnCSR
LnCSR
Early
ΣLn
u(i)
LnFC = LnCSR
LnCSR
Growth
Σ Ln
u(ii)
LnFC = LnCSR
LnCSR
Mature
Σ Ln
u(iii)
LnFC = LnCSR
LnCSR
Declining
Σ Ln
u(iv)
Where symbols used in above equations are described as follows: LnFC = Logarithm FC, LnCSR = Logarithm corporate financial responsibility, Xit = Control variables, γ = Stands for threshold value to estimate, ∈it = stands for the residual term, lnconpsm = logarithm of the financing rate =coefficient of linear correlation, Β = the acceptable probability of a Type II error, ∑ = ‘sigma’ summation, αi = stands for individual fixed effects, σ = the standard deviation of a population μ = refers to a population mean, β1 = the regression coefficient
3.3.3. Spatial effect model for economic growth (GDP) and FC
In the present study, a basic model without considering spatial effect was constructed by using traditional panel data. The constructed panel data model is expressed as follows:
(5)
(5)
Where i is region; t is year; explains the economic growth;
is the set of explanatory variable vectors composed of the control variables;
is the district fixed effect; and
is the random error term. Common spatial econometric models include the spatial error model (SEM) and SDM. For financial constraints, SDM is constructed to discuss the effects of GDP on financial constraints FC. SDM equation is expressed as:
(6)
(6)
Where Y is the economic growth index represented by FC; ρ and λ are spatial autocorrelation coefficient; W is a spatial weight matrix; X is the set of explanatory variable vectors composed of GDP and other control variables that will be introduced in the model; β is a set of coefficient vector of explanatory variable; WX and WY are spatial lag terms of explanatory and explained variables; and ε is the random error term. If ρ and λ≠ 0, then spatial spill-over effect is present and the effects of GDP on FC are explored by constructing SDM.
3.4. Moran’s Index spatial correlation
The data collected is simply one of several possible outcomes, if ‘WX’ is the vector of means of variable ‘X’ in the region of each geographic unit, the closer this index is to ‘1’ in absolute value, the stronger the correlation. This interval is dependent on the weight matrix and can occasionally change outside of the range [-1; 1], emphasising the significance of determining the intervals bounds (Upton & Fingleton, Citation1985) spatial autocorrelation indices are as follows:
(7)
(7)
Where ‘W’ is the spatial weight matrix, the null hypothesis is that the test statistic is the range of values that governs the spatial autocorrelation index, which answers the question about the signals and strength of the spatial autocorrelation:
(8)
(8)
The setting of (0–1) spatial weight matrix observes to the first law of economic geography. If a common border exists between regions i and j, and then the spatial weight matrix is ‘1’ and on the other hand it is “0”. Such (0–1) spatial weight matrix was recorded as W1.
The spatial weight matrix of economic distance considers the economic and industrial integration correlations among different regions. The expression is W1=
*diag (
3.5. Spatial correlation test
Exploratory spatial data analysis is an important research field in spatial econometrics. The spatial distribution pattern of economic growth is described by using ESDA method, and spatial autocorrelation is reflected by the global Moran's I index (22). The expression of global Moran's I index is as follows:
(9)
(9)
(10)
(10)
Where and
are economic growth levels of provinces i and j, respectively; and
is the spatial weight matrix, and its value can present variations in accordance to geographical distance. The value of Moran’si range from (-1) to (1).
If Moran’si > 0, then a positive spatial autocorrelation exists
If Moran’si < 0, then negative spatial autocorrelation exists. The spatial correlation strengthens when absolute value increases
If Moran’si = 0, then no spatial correlation exists.
4. Empirical results and discussions
4.1. Data Analysis techniques
shows the estimated Moran's I record of FC and GDP in China from 2010 to 2019. describes the changing trend in 31 Chinese cities from 2010 to 2019. During these ten years, the overall productivity increased from (-0.236) to (0.348). demonstrates that the most basic proficiency is found in Gangsu, while the most advancement is found in Shanghai.
Figure 1. Moran scatter plot of all provinces of China.
Source: The authors.
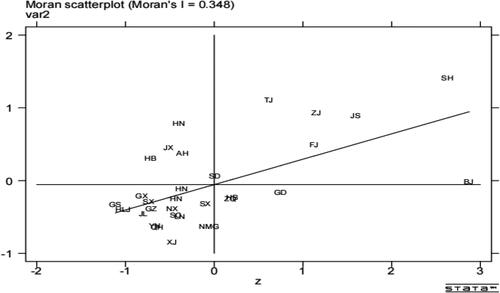
Table 2. Represents Moran’s index.
Out of these 31 provinces of the general efficiencies, some provinces have a value of less than 0.165, such as Gangsu, Henan Region and Shijiazhuang. There are five regions where the overall efficiency is higher than 0.7, and the overall efficiencies of the eastern region are generally greater, but those in the upper east and central districts are often lower. The worldwide Moran record reveals that from 2010 to 2019, all Chinese regions' production has a favourable spatial association, and which districts are located in high-bunch or low-bunch zones. This study focussed on China's completion of five critical tasks linked to CSR and FC during a ten-year period. We created a Moran file of the neighbouring nations' efficacy using state programming, which was a local spatial efficiency.
4.2. Decomposition of economic spatial spillover effects
The spatial slack terms of dependent and free variables, as well as the overall effects of free factors on subordinate factors are included using the effect disintegration approach in SDM. As a result, economic focuses will fundamentally promote local financial growth, with the positive impact being maximised once economic factors are included. The overall impacts of economic growth are favourable but not unusually substantial for less than three spatial loads.
Furthermore, money-related obsessions mostly impact local economic events, with just a few spill-over effects beyond. Overall, the financial impacts of money-related solutions are mostly predictable, and the quick effect coefficient is greater than the indirect effect coefficient. Consequently, financial modifications benefit not only the levels of business sector leaders and the overall prosperity of the local region but also the completion of structure supply.
Relapse coefficient beta 1 was essentially certain, according to the aftereffects of relapse model 2 with autonomous variable relapse, representing past CSR execution to Gross Domestic Product growth, and industrial mix to ease undertaking financing constraints, and more private ventures comparing coefficient of beta 1, corporate FC ease was more evident. To begin, indicates that the impacts of economic focuses on GDP are almost certain in less than three geographical weight frameworks. Time measurement and the use of a geographic aggregative relapse SAR model to look at the financial implications of the Spatial Econometric Model might be used in future research on assessing the economic consequences of GDP based on spatial econometric models (SEM). shows the results of examining the thickness of an SDM model with no constraints and then testing if the SDM model might be streamlined.
Table 3. Spill-over effect decomposition of SDM.
Table 4. Shows the regression results of the applied models.
The notion of Konar and Cohen (Citation2001) was utilised as a reference in choosing a spatial model in this study; namely, an SDM model without any constraints was estimated first, and then the ability to simplify the SDM model was examined. The SDM model estimation was chosen initially, and then the data was processed using Stata software. Finally, the SAR and SEM models were nested in the SDM model. Furthermore, the relapse coefficient of CSR is the largest within the geographical weight framework of economic distance. The relapse coefficient of economic fixations is largest in the spatial weight matrix of financial remoteness. Economic fixations build on the success of excellent employees by combining financial and social events to produce a positive spatial overflow effect. This finding contradicts Wang's conclusion, which is based on a geographical econometric model: most economic fixation factors have insignificant circuitous effects. In-depth analysis of the Chinese CSR and economic growth law is challenging.
4.3. Spatial econometric model analysis
When, through factor portability, industry affiliation, learning impact, and innovation overflow impact, good cutthroat repercussions for economic growth and other encompassing areas overflow effect into space should be created from numerous viewpoints. The results of the observational study suggest the industrial incorporation of the locality and adjacent growth districts. described the modern era ventures are confronted with political constraints, cutthroat constraints, and change constraints, as well as the ‘management of the situation,’ such as industry union rate notice liters’, cost reduction impacts, and industrial advancement to further enhance the impact, industry union speed productivity, and advance economic growth.
Table 5. Regression results of effects of the Spatial Dubin model.
The SDM model had a p-value of 0.000 < 0.05, which indicated that the random effect model hypothesis was rejected at the 5% significance level. SDM's effect model was more appropriate. According to the SDM estimate findings, the spatial lag coefficient (rho) of explanatory variables is not substantially zero. When the spatial lag term coefficient of the explanatory variables is not statistically zero, there will be systematic mistakes in estimating the spill-over impact using the coefficient of SDM. shows the results of early inspections conducted by Chinese real estate businesses. The expansion of territorial coordination is sped up by a multi-focus intuitive activity gathering space and a combination design into further disposal of market borders among diverse places.
Table 6. Show the results of additional inspections early stage.
results satisfied the hypothesis ‘H2a: The corporate social responsibility of companies at the early stage of their life cycle has a significant role in promoting the financing constraints of listed real estate companies’. As indicated in , FC has a negative and negligible impact on economic growth in East China.
Table 7. Shows the effects of GDP growth stage.
The impacts of FC on Central China's economic growth pass the significance test at the 1% level. In West China, the impacts of FC on economic growth are favourable but negligible. In East and Central China, the geographical spill-over effects of economic growth pass the significance test at the 1% level. As a result, GDP has specific geographical spill-over effects in these areas. West China, on the other hand, fails the significance test.
The results of opposed the hypothesis ‘H2b: The corporate social responsibility of companies in the growth stage of their life cycle has a significant role in promoting the financing constraints of listed real estate companies’. With the end selected from the blunder quantities of square, these results are foreseeable. The usual blunder is about sf = −2.42; in light of the exceptional ability, we have Sf = −1.31 exactly as sf = −1.40. These data show that the spatial autocorrelation based on notable capacity is much greater than the link based on forced labour for Chinese city sizes in 2014.
Based on the force work, these results imply that the squared quantity of mistakes between the genuine recurrence dispersion and the hypothetical typical conveyance is around 0.083 in contrast to global spatial autocorrelation. Notably, results in satisfied the hypothesis ‘H2c: The corporate social responsibility of enterprises in the mature stage of the life cycle has a significant inhibitory effect on the financing constraints of listed real estate companies’. With a blunder quantity of square of roughly −1.31, the negative dramatic capacity is more suited for the spatial autocorrelation examination of China's urban communities than the opposite power task as a spatial weight job. In practice, a sample of only 16 components is inadequate to provide a clear, typical bend or ringer histogram. As indicated in , the objective of the above-mentioned logical cycle is to explain the use of a technique, while the end is merely for reference.
Table 8. Shows the spatial correlation of maturity stage.
Table 9. Shows the results of declining stage.
Moreover, the findings in satisfied the hypothesis ‘H2d: The corporate social responsibility of companies in the declining life cycle has no significant impact on the financing constraints of listed real estate companies’. The results show that industrial integration and economic growth immediately impact the splendour of lights around evening time by rampant economic growth.
4.4. Moderating Effects of CSR and GDP lifecycle of FC
In general, the corporate life cycle is divided into four stages: early, growth, maturity, and decline. The Chow test was used to determine the moderating impact of CSR and GDP life cycle, as this technique analyses a business more objectively and is regarded as a superior approach to classifying a firm's life cycle. The results reveal a substantial negative connection between the businesses' CSR and GDP participation and budgetary limitations. However, in the early stages of the life cycle, the correlation between CSR and GDP is insignificant. Tobinq, sustrt and lev are all negative and significant at the 1% level in the control variables. Only the beginning and growth stage groups have substantial lev, implying that leverage is more relevant to the initial and expansion stage businesses when seeking external funding.
The results of the Chow tests are shown in . In columns (1) to (3), the coefficients of lifecycle*CSR are constantly negative and significant at the 1% and 10% levels, implying that the coefficients of CSR and GDP in the early stages are statistically significant. To put it another way, companies in the early phases of their life cycles have a considerably smaller CSR and GDP impact on financial restrictions than firms in later stages. As a result, the firm's life cycle affects the influence of CSR and GDP on financial limitations.
Table 10. Chow test results of moderating effects of CSR & GDP*Lifecycle of FC.
4.5. Robustness test by controlling additional variables
The association between CSR and FC may lead to endogeneity issues due to reverse causality. Therefore, we employ GMM based estimator for robustness after controlling for other variables. shows four models for different combinations of integrated variables and their interaction terms. Model 1 to Model 4 progressively incorporate a different set of control variables in stepwise regression and ensure the consistency of results across all model specifications.
Table 11. Robustness test by controlling additional variables and adopting two-step GMM methods.
Although we have controlled a number of variables in the relapse situation, endogeneity between CSR and FC remains a possibility. Reconsider the link between CSR disclosures and FC using a two-venture GMM evaluation estimator. Overall, certain CSR coefficients are consistent with our expectations, which are identical to those previously stated in . Furthermore, we employ lag1 time of CSR as our instrumental variable in a two-stage least square (2SLS) relapse.
Table 12. CSR and FC: Two-stage least square (2SLS) estimation.
The factors are crucial for predicting CSR and FC, as shown in columns 1 to 3. The coefficients of the instrumented CSR variable are positive and critical at the 1% level, as shown in columns (2–4). The estimation result might be influenced by the coder's abstract judgement, lowering the evaluation result's strength. By considering these factors, the degree of CSR is divided into five categories, ranging from high to low (levels), and the consequences of varying levels of transparency; however, the potential for content inspection may lead to biased estimates. Thus, we also utilise FC elective measures to validate the validity of our findings. It has the potential to minimise financial constraints and have a significant influence on the link between them.
5. Conclusion
The life cycle impact of CSR involvement on financial constraints (FC) in Chinese real estate firms is examined in this study. The outcome of this research shows that a company's CSR efforts help to overcome FC. Also, It implicitly accepts that companies are homogeneous over the industrial life cycle. Firms are also confronted with various social responsibility goals at various stages of growth. They demonstrate a range of CSR proficiency, and the effects of CSR, GDP growth, and industrial integration on FC varied throughout life cycles. The results of this study highlighted that CSR indirectly impacts the GDP via FC. As a result, we rebuild its numerical structure using numerical inference and four distinct ways to compute Moran's list. The results show that CSR, GDP, and Industrial integration have inhibitory effects on financial constraints, implying that these factors improve firms financial access and penetration.
The Moran index results find that CSR, at early, development, mature, and declining stages of their life cycle, has a significant role in promoting the FC of listed real estate companies. This study provides a practical approach for manufacturing executives and policymakers to manage CSR, economic output, and industrial integration in evaluating FC. These findings will also be used to build a scaling analysis of spatial autocorrelation. Although spatial linkages are essential in CSR studies, there is always space for improvement. This study shows that CSR with a higher level of friendly responsibility has lower financing requirements, indicating that CSR has a significant impact on FC, output level, and a combination of these factors are inextricably linked to FC. Likewise, if the degree of CSR disclosure is directly proportional to the company's performance, the disclosure behaviour will be proactive. This result will assist stakeholders in having constructive interactions when it comes to social responsibility information.
China's CSR information disclosure rules are currently insufficient. Unlike the government, the corporation has more control over the substance of the disclosure. The CSR disclosure will be less reliable, comparable, and complete, limiting the function of information disclosure. The regulatory authorities may explore better defining CSR requirements, enhancing their utility, and, in the end, utilising economic incentives in encouraging companies to enhance their social responsibility intentionally.
A future study might look into how players in the credit and stock markets react to this occurrence. Furthermore, Kim et al. argued that participation of CSR activities is a long-term investment goal. Thus, future studies might look at how CFO manipulation affects the long-term financial performance of CSR-induced companies.
Acknowledgement
The authors thanks the financial support of Philosophy & Social Science Fund of Tianjin City, China (TJYJ20XSX-023) and Zhejiang Social Science Project.
Disclosure statement
No potential conflict of interest was reported by the authors.
Additional information
Funding
References
- Adizes, I. (2004). Managing corporate lifecycles. The Adizes Institute Publishing.
- Almeida, H., & Campello, M. (2007). Financial constraints, asset tangibility, and corporate investment. Review of Financial Studies, 20 (5), 1429–1460. https://doi.org/10.1093/rfs/hhm019
- Almeida, H., Campello, M., & Weisbach, M. S. (2004). The cash flow sensitivity of cash. The Journal of Finance, 59(4), 1777–1804. https://doi.org/10.2139/ssrn.345840
- Andriof, J., & Waddock, S. A. (2002). Unfolding stakeholder engagement. In J. Andriof, S. A. Waddock, B. W. Husted, S. S. Rahman (Eds.), Unfolding stakeholder thinking: Theory, responsibility, and engagement (pp. 19–42). Greenleaf Publishing.
- Attig, N., Ghoul, S. E., Guedhami, O., & Suh, J. (2013). Corporate social responsibility and credit ratings. Journal of Business Ethics, 117(4), 679–694. https://doi.org/10.1007/s10551-013-1714-2
- Backman, J. (1983). Entrepreneurship and the outlook for America. Free Press.
- Beck, T. (2008). The econometrics of finance and growth. World Bank Policy Research Working Paper No. 4608. https://ideas.repec.org/p/wbk/wbrwps/4608.html
- Bencivenga, V. R., Smith, B. D., & Starr, R. M. (1995). Transactions costs, technological choice, and endogenous growth. Journal of Economic Theory, 67(1), 153–177. https://doi.org/10.1006/jeth.1995.1069
- Berger, N. A., & Udell, F. G. (1998). The economics of small business finance: The roles of private equity and debt markets in the financial growth cycle. Journal of Banking & Finance, 22(6–8), 613–673.
- Bivand, R. S., Müller, W., & Reder, M. (2009). Power calculations for global and local Moran’s I. Computational Statistics & Data Analysis, 53(8), 2859–2872. https://doi.org/10.1016/j.csda.2008.07.021
- Brown, J. R., Fazzari, S. M., & Petersen, B. C. (2009). Financing innovation and growth: Cash flow, external equity, and the 1990s R&D boom. The Journal of Finance, 64 (1), 151–185. https://doi.org/10.1111/j.1540-6261.2008.01431.x
- Campello, M., & Graham, J. (2007). Do stock prices influence corporate decisions? Evidence from the technology bubble. Nber Working Papers. National Bureau of Economic Research, Inc.
- Castro, F., Kalatzis, A. E. G., & Martins-Filho, C. (2015). Financing in an emerging economy: Does financial development or financial structure matter? Emerging Markets Review, 23, 96–123. https://doi.org/10.1016/j.ememar.2015.04.012
- Chan, C. Y., Chou, D. W., & Lo, H. C. (2017). Do financial constraints matter when firms engage in CSR? The North American Journal of Economics and Finance, 39, 241–259. https://doi.org/10.1016/j.najef.2016.10.009
- Chandavarkar, A. (1992). Of finance and development: Neglected and unsettled questions. World Development, 20(1), 133–142. https://doi.org/10.1016/0305-750X(92)90142-I
- Cheng, B., Ioannou, I., & Serafeim, G. (2014). Corporate social responsibility and access to finance. Strategic Management Journal, 35(1), 1–23. https://doi.org/10.1002/smj.2131
- Demirguc-Kunt, A., & Maksimovic, V. (1998). Law, finance and firm growth. The Journal of Finance, 53(6), 2107–2131. https://doi.org/10.1111/0022-1082.00084
- Dhaliwal, D. S., Radhakrishnan, S., Tsang, A., & Yang, Y. G. (2012). Nonfinancial disclosure and analyst forecast accuracy: International evidence on corporate social responsibility disclosure. The Accounting Review, 87(3), 723–759. https://doi.org/10.2139/ssrn.1596458
- Dutta, S., & Nezlobin, A. (2017). Information disclosure, firm growth, and the cost of capital. Journal of Financial Economics, 123(2), 415–431. https://doi.org/10.1016/j.jfineco.2016.04.001
- Freeman, R. E. (1984). Strategic management: A stakeholder approach. Pitman.
- Garriga, E., & Melé, D. (2004). Corporate social responsibility theories: Mapping the territory. Journal of Business Ethics, 53(1/2), 51–71. https://doi.org/10.1023/B:BUSI.0000039399.90587.34
- Gertler, M. (1992). Financial capacity and output fluctuations in an economy with multi-period financial relationships. The Review of Economic Studies, 59(3), 455–472. https://doi.org/10.2307/2297859
- Harrison, A. E., Love, I., & McMillan, M. S. (2004). Global capital flows and financing constraints. Journal of Development Economics, 75(1), 269–301. https://doi.org/10.1016/j.jdeveco.2003.10.002
- Harrison, A. E., & McMillan, M. S. (2003). Does direct foreign investment affect domestic credit constraints? Journal of International Economics, 61(1), 73–100. https://doi.org/10.1016/S0022-1996(02)00078-8
- Hazlett, S. A., McAdam, R., & Murray, L. (2007). From quality management to socially responsible organizations: The case for CSR. International Journal of Quality & Reliability Management, 24(7), 669–682. https://doi.org/10.1108/02656710710774665
- Hubbard, R. G. (1998). Capital-market imperfections and investment. Journal of Economic Literature, 36, 193–225.
- Husillos, J., González, C. L., & Gil, M. J. Á. (2011). The emergence of triple bottom line reporting in Spain. Spanish Journal of Finance and Accounting / Revista Española de Financiación y Contabilidad, 40(150), 195–219. https://doi.org/10.1080/02102412.2011.10779701
- Husted, B. W., Jamali, D., & Saffar, W. (2016). Near and dear? The role of location in CSR engagement. Strategic Management Journal, 37(10), 2050–2070. https://doi.org/10.1002/smj.2437
- Inoue, Y., & Lee, S. (2011). Effects of different dimensions of corporate social responsibility on corporate financial performance in tourism-related industries. Tourism Management, 32(4), 790–804. https://doi.org/10.1016/j.tourman.2010.06.019
- Jiang, W., Wang, X., Zeng, B., Liu, L., Tardivel, A., Wei, H., Han, J., MacDonald, H. R., Tschopp, J., Tian, Z., & Zhou, R. (2013). Recognition of gut microbiota by NOD2 is essential for the homeostasis of intestinal intraepithelial lymphocytes. Journal of Experimental Medicine, 10(12), 27–91. https://doi.org/10.1084/jem.20122490
- Kaplan, S. N., & Zingales, L. (2000). Investment-cash flow sensitivities are not valid measures of financing constraints. The Quarterly Journal of Economics, 115 (2), 707–712. https://doi.org/10.1162/003355300554782
- Khan, S. A. R., Razzaq, A., Yu, Z., & Miller, S. (2021). Industry 4.0 and circular economy practices: A new era business strategies for environmental sustainability. Business Strategy and the Environment.
- Konar, S., & Cohen, M. A. (2001). Does the market value environmental performance? Review of Economics and Statistics, 83(2), 281–289. https://doi.org/10.1162/00346530151143815
- Kwak, Y. M., & Choi, S. B. (2015). Corporate social responsibility and financial constraints: Evidence from Korean firms. Global Business Finance Review, 20(2), 15–26. https://doi.org/10.17549/gbfr.2015.20.2.15
- Levine, R. (2005). Finance and growth: Theory and evidence. Chapter 12. In P. Aghion & S. Durlauf (Eds.), Handbook of economic growth (Vol. 1, 865–934). Elsevier.
- Love, I. (2003). Financial development and financing constraints: International evidence from the structural investment model. Review of Financial Studies, 16(3), 765–791. https://doi.org/10.1093/rfs/hhg013
- Lucas, R. Jr. (1988). On the mechanics of economic development. Journal of Monetary Economics, 22(1), 3–42. https://doi.org/10.1016/0304-3932(88)90168-7
- Luzzi, A. (2014). Patent use under financial constraints. Academy of Management Proceedings, 2014(1), 17221. https://doi.org/10.5465/AMBPP.2014.17221
- McGuire, C. (1963). A process approach to the construction and analysis of medical examinations. Academic Medicine, 38(7), 139.
- McKinley, A. (2008). The driver [master thesis]. Geography Department and Center for Environment.
- Mehralian, G., Nazari, J. A., Zarei, L., & Rasekh, H. R. (2016). The effects of corporate social responsibility on organizational performance in the Iranian pharmaceutical industry: The mediating role of TQM. Journal of Cleaner Production, 135, 689–698. https://doi.org/10.1016/j.jclepro.2016.06.116
- Mian, A., & Sufi, A. (2014). House of debt: How they (and you) caused the Great Recession, and how we can prevent it from happening again. The University of Chicago Press.
- Moradi, M., Salehi, A., & Rashidi, F. (2018). Investigating the relationship between corporate social responsibility. Agent costs and cash flow sensitivity. Accounting and Management Perspectives, 1(4), 32–47. https://www.researchgate.net/publication/333868904
- Moran, P. A. P. (1948). The interpretation of statistical maps. Journal of the Royal Statistical Society: Series B (Methodological), 10(2), 243–251. https://doi.org/10.1111/j.2517-6161.1948.tb00012.x
- Platonova, E., Asutay, M., Dixon, R., & Mohammad, S. (2018). The impact of corporate social responsibility disclosure on financial performance: Evidence from the GCC Islamic banking sector. Journal of Business Ethics, 151(2), 451–471. https://doi.org/10.1007/s10551-016-3229-0
- Rajan, R., & Zingales, L. (1998). Financial dependence and growth. American Economic Review, 88(3), 559–586.
- Richardson, S. (2006). Over-investment of free cash flow. Review of Accounting Studies, 11(2–3), 159–189. https://doi.org/10.1007/s11142-006-9012-1
- Saeidi, S. P., Sofian, S., Saeidi, P., Saeidi, S. P., & Saaeidi, S. A. (2015). How does corporate social responsibility contribute to firm financial performance? The mediating role of competitive advantage, reputation, and customer satisfaction. Journal of Business Research, 68(2), 341–350. https://doi.org/10.1016/j.jbusres.2014.06.024
- Schumpeter, J. A. (1912). The theory of economic development an inquiry into profits, capital, credit, interest, and the business cycle. Harvard Economic Studies, (46), 255.
- Shahbaz, M., Kandil, M., Kumar, M., & Nguyen, D. K. (2017). The drivers of economic growth in China and India: Globalization or financial development. International Journal of Development Issues, 16(1), 54–84. https://doi.org/10.1108/IJDI-06-2016-0036
- The Economist. (2008). The World in 2008 is the 22nd edition of The Economist's annual collection of predictions for the year ahead. https://www.economist.com/theworldin/2008
- Upton, G., & Fingleton, B. (1985). Spatial data analysis by example. Volume 1: Point pattern and quantitative data. John Wiley & Sons, X, 410 S., L. 32.95.
- Wan, L. Y., Liao, M. Q., & Hu, Y. (2015). Combination of industry and finance and corporate financing constraints: An empirical study based on listed companies’ participating banks. Nankai Management Review, 18, 64–72.
- Whited, T. M., & Wu, G. (2006). The financial constraints risk. Review of Financial Studies, 19(2), 531–559. https://doi.org/10.2139/ssrn.410816
- Windsor, D. (2006). Corporate social responsibility: Three key approaches. Journal of Management Studies, 43(1), 93–114. https://doi.org/10.1111/j.1467-6486.2006.00584.x
- Wood, D. J., & Logsdon, J. (2002). Business citizenship: From individuals to organizations. Business Ethics Quarterly, 3 (59), 55–67.
- Wurgler, J. (2000). Financial markets and allocation of capital. Journal of Financial Economics, 58(1–2), 187–214. https://doi.org/10.1016/S0304-405X(00)00070-2
- Zhao, T., & Xiao, X. (2019). The impact of corporate social responsibility on financial constraints: Does the life cycle stage of a firm matter? International Review of Economics & Finance, 63, 76–93. https://doi.org/10.1016/j.iref.2018.08.010
- Zhou, H., & Tan, Y. (2018). Industrial policy, integration of industry and finance and corporate financing constraints. East China Economic Management, 32, 83–89.