
 ?Mathematical formulae have been encoded as MathML and are displayed in this HTML version using MathJax in order to improve their display. Uncheck the box to turn MathJax off. This feature requires Javascript. Click on a formula to zoom.
Abstract
Air transportation has a deep impact on environmental degradation due to the higher fossil fuel consumption. On the other hand, this industry also embraces the highest innovation that may alter its environmental consequences. However, there is a dearth of empirical evidence that explores the impact of air transportation and eco-innovation on environmental quality. Therefore, this study is a pioneering attempt to examine the role of air-transportation and eco-innovation in reducing environmental degradation in G7 countries using annual data from 1990 to 2019. In doing so, we employed various advance econometric approaches to handle issues arises from panel data such as Pesaran (Citation2007) and Bai and Carrion-I-Silvestre (Citation2009) used to examine the presence of unit root, cross-sectional dependency checked through Pesaran (Citation2015) test, and for parameters heterogeneity through Pesaran and Yamagata (Citation2008). Moreover, the Westerlund and Edgerton (Citation2008) test and Cross Sectional Augmented ARDL were employed to analyse the long run and short run association among variables. The overall results show that air transportation and eco-innovation play an important role in abating environmental deterioration. Air transportation is negatively correlated with carbon emission and PM2.5 exposure (air quality) due to the improved technical structure of aircraft engines and the use of mixed ration or alternative aviation fuels. These results provide valuable suggestions for all stakeholders.
1. Introduction
Air transportation is an important mode of transportation that provides various economic benefits such as boost the businesses and improves the quality of life. Air transportation has a long-term association with the development & growth of the economy with the highly influential pull effects of services (Nasreen et al., Citation2018; Ozturk & Acaravci, Citation2013; Sharif et al., Citation2020). Moreover, by facilitating tourism as one of the essential drivers of economic growth, air transportation indirectly plays a vital role in revenue generation and poverty alleviation (Adedoyin et al., Citation2020; Balsalobre-Lorente et al., Citation2021). According to the statistics of Air Transport Action Group (ATAG, Citation2020), in 2019, the total number of air travel passengers from all over the world has crossed 4.5 billion with a total contribution of more than 691 billion US Dollars in the global GDP. However, in 2020 due to the COVID-19 pandemic, this economic contribution, and the number of passengers has declined by 60%.
For the past few decades, environmental sustainability is a preeminent global issue. A decline in greenhouse gasses emission or decarburisation is a major goal to deal with the economic and environmental issues due to the constant climate emergency crises (Li et al., Citation2020; Lingyan et al., Citation2021; Razzaq, Sharif, Ahmad et al., Citation2021; Suwarni, Citation2020). However, air transportation has a deep impact on environmental degradation due to the high fossil fuel consumption and high altitude and near-surface environment greenhouse gas emission (Erdogan et al., Citation2020; Lu et al., Citation2020; Sun et al., Citation2021). Global air transportation is the second-largest contributor to concentrated greenhouse gasses emission on the surface as well as in the atmosphere (Kommenda, Citation2019). This adds 2% of human-induced carbon emission whereas from all sources of air transportation the overall contribution of aviation is 12% of total carbon dioxide emission. Moreover, long-distance flights such as flights over 1500 kilometers are causing 80% of the carbon emission (ATAG, Citation2020).
This study considers G7 countries as a sample due to the following reasons. The group is consisting of the seven most developed countries of the world; these countries are Canada, France, Germany, Italy, Japan, the UK and the USA. The seven great powers retaining almost 58% of the global GDP and consume 42% of global energy. However, G7 countries have been facing a huge issue of environmental degradation. According to World Bank (Citation2020) G7 economies contribute a 27.3% share of overall world carbon dioxide emission in 2018 which is approximately 95 billion tons. The increasing concern of climate change and energy security has motivated these most developed countries in the world, with the highest human capital index, research, and development capacity, and eco-innovations to use renewable energy sources (Öztürk et al., Citation2020; Sharif et al., Citation2019, Citation2020). From the top five GHGs emitter from aviation bunkers four are main countries of G-7 such as USA, United Kingdom, Japan and Germany (Rutherford et al., Citation2020; Zheng et al., Citation2019).
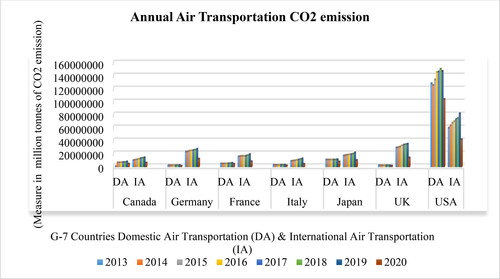
Moreover, explains the details about the G7 countries carbon dioxide emission due to the annual domestic and international air transportation of each year from 2013 to 2020. According to , among all G-7 countries the USA is the highest emitter of carbon through its domestic and international air transportation since 2013. However, there is a sharp decline of carbon emission by USA aviation in 2020 due to the COVID-19 traveling restrictions.
Figure 1. G-7 countries annual air transportation CO2 emission. Source: OECD. Stat Data set of Air transportation carbon emission.
In the present situation, to control the environmental degradation, the air transportation contribution toward carbon emission has attained special attention from the researchers. Most of the researchers now having an aim to find ways to effectively control the GHG emission of the aviation industry by considering the expected high air traveling demand in the future (Naghawi, Citation2019; Razzaq, Sharif, Najmi et al., Citation2021; Zhang et al., Citation2019). Moreover, it is essential to measure the air transportation performance indicators with low carbon emission for policy-making as a valuable tool. It provides important information to monitor and compare different procedural and mechanical modifications (Ali et al., Citation2020; Malhotra & Schmidt, Citation2020).
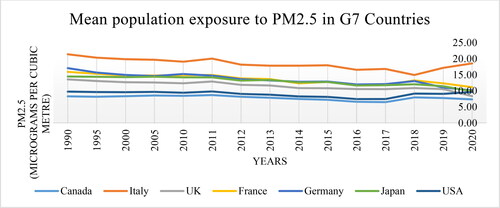
Similarly, air pollution is also a very pressing environmental and health issue worldwide. According to the United States, Environmental Protection Agency (EPA) (Citation2019) the air quality can be measure through fine particulate matter (PM2.5) refer to the air pollution consist of solid particles and liquid droplets of chemicals which can cause serious health problems. These particles are fine enough to inhale and have a diameter of 2.5 or less (Mukherjee & Agrawal, Citation2017). The health effects of air transportation are strongly correlated with the size and composition of the particulate matter (Habre et al., Citation2018; Razzaq et al., Citation2020). The engine of aircraft produces CO2, water vapor and exhaust components such as Nitrogen oxide, Sulfur oxide and other volatile organic compounds which are responsible for degrading the air quality and form fine particulate matter PM2.5 (Arter & Arunachalam, Citation2021). The rapid growth of the aviation industry has a potential influence on environmental sustainability and public health. show the G-7 countries annual mean population exposure to PM2.5 According to Italy has the highest exposure of PM2.5 concentration among all G-7 countries.
Figure 2. Annual exposure of fine particulate matter (PM2.5) of G-7 countries. Source: OECD. Stat Data set of exposure to Fine particulate matter (PM2.5) data aggregated from over 80,000 data points.
Many studies analyse the impact of air transportation on environmental degradation as a sector or as the operations of individual airlines (Balkanski et al., Citation2010; Baumeister, Citation2017; Lee et al., Citation2017; Naghawi, Citation2019; Zhang et al., Citation2019), similarly various studies characterise the aviation industry emission and their impact on air quality specifically on PM2.5 (Arter & Arunachalam, Citation2021; Habre et al., Citation2018; Moniruzzaman et al., Citation2020; Mukherjee & Agrawal, Citation2017; Penn et al., Citation2017; Woody et al., Citation2016; Zhang et al., Citation2020).
Moreover, some studies have linked eco-innovation with air transportation to control air pollution (Chien et al., Citation2021; Mavi et al., Citation2019; Orji et al., Citation2019; Razzaq, Wang et al., Citation2021; Razzaq, Ajaz et al., Citation2021; Van Song et al., Citation2021). Eco-innovation is the adaptation of green technologies for the development of products and procedures to achieve environmental sustainability goals by using green energy or renewable energy resources (Sharif et al., Citation2019; Tao et al., Citation2021; Yurdakul & Kazan, Citation2020). According to Yu et al. (Citation2017) eco-innovation or green innovation, refer as innovation, contributes to reducing the environmental impact. Such as pollution prevention, energy savings and waste management, etc. Similarly, eco-innovation also plays a major role to control the air pollution emitted by air transportation (Chien et al., Citation2021). The environmental damages caused by air transportation is continually growing therefore eco-innovations are crucial to switch the air transportation industries to consume fossil fuel to biofuel (Sharif et al., Citation2020a).
However, in the existing literature, no study has examined both the air transportation and eco-innovation role to reduce environmental degradation. This study will be the first with the aim to examine the role of air transportation and eco-innovation to improve environmental sustainability in G-7 countries. The G7 countries with steady economic growth are supposed to carry out the policies and procedures for the commercial aircraft's fuel efficiency which ensures energy security for the future and fewer greenhouse gasses emission (Staples et al., Citation2018).
The significance and reliability of the study results primarily depend upon the selection of the econometric approaches used for analysis. To avoid the misleading results and different econometric issues of panel data study such as cross-section dependency, structural break, heterogeneity, etc, this study employs the advanced panel data estimations of CS-ARDL along with various other second and third-generation advance approaches. For instance Lluís Carrion‐i‐Silvestre et al. (Citation2005), Bai and Carrion-I-Silvestre (Citation2009), Westerlund and Edgerton (Citation2008) and Banerjee and Carrion‐i-Silvestre (Citation2017). This study provides interesting results for the analysis from 1990 to 2019 and supports that air transportation and eco-innovation in G-7 countries play an important role to abate environmental deterioration. They are negatively correlated with carbon emission and PM2.5 exposure (air quality) due to the advancement of technology for aircraft engines and use of alternative aviation fuels
The rest of the study structured as Section 2 discusses the literature review, Section 3 covers methodology and model specification. Whereas Section 4 provides the findings of the study and Section 5 provides the conclusion and policy recommendation.
2. Literature review
The rapid expansion of the air transport sector and increase in the number of flights also enhance the impact of aircraft emissions on air quality and environmental sustainability. Therefore, the air transportation sector is observed as the second-largest contributor to the greenhouse gases in the world. Existing literature provides various studies investigating the impact of air transportation on greenhouse gases (Balkanski et al., Citation2010; Baumeister, Citation2017; Lee et al., Citation2017; Naghawi, Citation2019; Zhang et al., Citation2019), and on-air quality (Arter & Arunachalam, Citation2021; Habre et al., Citation2018; Moniruzzaman et al., Citation2020; Mukherjee & Agrawal, Citation2017; Penn et al., Citation2017; Sharif et al., Citation2020a; Woody et al., Citation2016; Zhang et al., Citation2020).
Most of the above studies claim that air transportation increases environmental degradation due to the high consumption of fossil fuels which release more greenhouse gases especially carbon dioxide. Similarly, air transportation is a major cause of air pollution by exposing high concentrations of fine particulate matter PM2.5 in the atmosphere, which is highly risky for health and the environment. However, very few studies revealed that air transportation with the new technologies has controlled the exposure of PM2.5 and reduced carbon emission (An, Razzaq, Nawaz et al., Citation2021; Staples et al., Citation2018; Wise et al., Citation2017; Zeng et al., Citation2019). The details of theoretical and empirical studies related to the impact of air transportation on environmental degradation are as under:
Balkanski et al. (Citation2010) warn that global air transportation is more precarious and causes environmental gradation on land as well as at the high altitude. The aircraft's engine produces half of the carbon emission above an altitude of 6000 meters. However, according to Corporan et al. (Citation2002) the particulate matter PM2.5 emission (poor air quality) can be reduced by using fuel additives recommended by National Air Ambient Quality Standards (NAAQS) to implement health base regulations. Woody et al. (Citation2016) characterised aircraft emission and study the nonlinear relationship of formation of particulate matters PM2.5 from the emission of air transportation by providing the quantitative measures and found that the high emission of air transportation of USA lowers down the regional air quality.
On the other hand, Liu et al. (Citation2017) evaluate the link the technological innovation and the performance of the airline by applying the Data Envelopment Analysis (DEA) approach to measure the environmental and economic performance of 12 airlines of China from 2007 to 2013. The result of the study found that technological innovation such as improvement of aircraft engine structure for efficient fuel consumption has dropped a significant amount of CO2 emission. Bo et al. (Citation2019) estimated the various emissions emitted from aircraft engine of all civil airports aviation in China contributes to ambient air quality from the year 2000 to 2016 through the comprehensive Air Quality Model. The outcome of the study revealed that the greenhouse gasses, chemicals, and particulate matter produced during the operational activates of the aircraft significantly affect the air quality. These effects are more intense at the airports which have more air traffic and considered tourism spots.
Zeng et al. (Citation2019) evaluate the benefits of mixed fuel ratio and improved engine structure. The study found that the use of alternative fuel such as liquefied natural gas (LNG) is more appropriate for the environmental safety less emission of greenhouse gasses compared to the use of usual aviation fuel kerosene. The mixture of liquid and gas fuel provides better thermal stability, higher energy density, and cost-effectiveness. Similarly, Staples et al. (Citation2018) also specified the significant overall decline in greenhouse gas emission use to the use of sustainable alternative fuel in the air transportation industry. Moreover, Lo et al. (Citation2020) concentrated on the determinants of carbon emission in air transportation available seat Kilometers (ASK) by designing an econometric model for penal data of flights in Italy from 1997 to 2011. The determinant such as size, route, policies, and decision-making enhanced the total carbon emission but reduces the per-passenger carbon emission. However, the technical progress and low-cost carrier development decreased per available Seat Kilometers (ASK).
Yu et al. (Citation2020) examined the influential factor and growth of civil aviation of China relationship with CO2 emission from 1979 to 2016. The outcomes of the study revealed that the transportation factor is the main contributor to increase CO2 emission whereas; the structural factor has the second-largest influential effect on carbon emission. However, Kito et al. (Citation2020) estimated the greenhouse gasses emission from Japan’s two major airlines from 2005 to 2015, and use the index composition analysis to identify the drivers of these gasses’ emission. The findings of the study described that the investment of fuel-efficient aircraft has no significant influence on the reduction of greenhouse gasses emission. Zhang et al. (Citation2020) estimate the insight details of the total emission from aviation at Zurich Airport. The finding of the study described the effect of annual mean practical concentration on the households and communities lived near the airport. According to the results, the total aviation emission has a very minor contribution to the particulate matter concentration.
Moreover, Chien et al. (Citation2021) has examined the impact of eco-innovation and environmental taxes on environmental pollution, such as PM2.5 for the top Asian economies from 1990 to 2017. The study employed the advanced panel estimations and found that eco-innovation and environmental taxes reduced air contamination. Similarly, Tao et al. (Citation2021) has also examined the role of eco-innovation to obtain the carbon neutrality target of emerging seven (E7) economies. Lin et al. (Citation2021) study the convergent trend of PM2.5 (air pollution) in china from 2013 to 2019 and found that in winter the concertation of PM2.5 is severe due to the high consumption of the fossil fuel in all industries including aviation industry (An, Razzaq, Haseeb et al., Citation2021; Ling et al., Citation2021).
3. Methodology
3.1. Data description
The study investigates the linkages of the carbon emission (CE) and particulate matter (PM2.5) with their determinants such as air transportation (TRA), eco-innovation (ECO), economic growth (GDP), the square of GDP (GDP2). The research area for study is covering G7 economies such as Canada, France, Germany, Italy, Japan, United Kingdom, and the United States from 1990 to 2019. Moreover, the data of economic growth (GDP) sourced from World development Indicators (WDI), and eco-innovation (ECO), environmental degradation measures in terms of carbon emissions (CE), and PM2.5 are taken from OECD database. illustrates the description of the variables used in the study. All the data series have converted into a logarithm form to obtain comparable results.
Table 1. Data description.
3.2. Theoretical rationale and model specification
The aviation sector is an important mode of transportation for goods and services in the current era. The aviation industry is playing a key role in the economic growth along with the new technological innovation which seeks ways to improve environmental sustainability. However, the high consumption of fossil fuels by this industry enhances the greenhouse gasses emanation. This study empirically calculates the impact of the air transportation, eco-innovation, and economic growth of the G7 countries on the overall carbon emission. The empirical model of the discussed variables is as under:
(1)
(1)
Similarly, this study collects empirical evidence of the relationship of air quality with the determinants such as air transportation, eco-innovation, and economic growth. The second empirical model of the study develops as under:
(2)
(2)
According to the EquationEquations (1)(1)
(1) and Equation(2)
(2)
(2) the cross-section denoted as “i,” used for the G7 economies including Canada, France, Italy, Japan, Germany, the United Kingdom, and the United States of America. However, “t” represents the time period of the study from 1990 to 2019.
(3)
(3)
(4)
(4)
EquationEquations (3)(3)
(3) and Equation(4)
(4)
(4) show the regression form of the EquationEquations (1)
(1)
(1) and Equation(2)
(2)
(2) . Where
and
are present as constant, and
and
are displayed as the parameters. Whereas,
are special terms of cross-section and the error terms represent as
and
respectively.
Airplanes propulsion requires the high combustion of fossil fuels which leads to the increase in the greenhouse gasses emission in the atmosphere. Hence the increase in air transportation (TRA) is expected to have a positive impact on environmental degradation (Saether et al., Citation2021; Yu et al., Citation2020; Zhang et al., Citation2017). Similarly, the increase in air transportation releases more aerosol dispensers and leads to a raise in the concentration of particulate matter. This pollutant has a negative impact on health and ultimately deprived the air quality (Harrison et al., Citation2015). Hence the > 0 and
> 0.
On the other hand, eco-innovations reduced carbon emission and air pollution. Therefore, it has expected that the eco-innovation has a negative influence on carbon emission and poor air quality. < 0 and
< 0 (Afrifa et al., Citation2020; Pope et al., Citation2020). However, the economic growth is expected to be positively correlated to the environmental degradation and air pollution because the rapid expansion of the economy increases the energy consumption which leads to the increase in carbon emission (CE) and concentration of fine particulate matter (PM2.5) (Destek & Sarkodie, Citation2019; Khan, Ali, Umar et al., Citation2020). Hence
> 0 and
> 0. Moreover, the expected relation of GDP2 with CE and PM2.5 is negative
< 0 and
< 0 (Khan, Ali, Umar et al., Citation2020).
3.3. Advanced panel data estimation
3.3.1. Unit root test
The analysis of the study begins with the tests of cross-section dependency which is a very common issue in panel data analysis. The spillover effect or the influence of unobserved common factors in all sections creates the problem of cross-section dependency. These unobserved common factors are referred to as economic uncertainty, commodity price fluctuations, stock market volatilities, residual interdependency and globalisation, etc. According to Westerlund (Citation2007) and Salim et al. (Citation2017), the analysis without considering the cross-section dependency problem gives biased results. However, this issue can be tackled with the appropriate unit root test hence the study uses the cross-section dependency test introduce by Pesaran (Citation2015) with the null hypothesis of no dependency and alternative hypothesis support the presence of correlation among the cross section units.
The number of unit root test was used in the existing studies to determine the presence of unit root and its effects on the results of panel data such as Choi (Citation2001), Harris and Tzavalis (Citation1999), Im et al. (Citation2003), Lluís Carrion‐i‐Silvestre et al. (Citation2005), Levin et al. (Citation2002) and Pesaran (Citation2007). All these tests are different and follow several assumptions in terms of their relevancy. The first-generation tests such as Levin et al. (Citation2002) and Choi (Citation2001) handle the panel nonstationary with the common parameter panel autoregressive effects and cannot resolve the issue of parameter heterogeneity and cross-section dependency. However, Im et al. (Citation2003) consider the heterogeneous issue but ignore the issue of cross-section dependency. In the same way, Lluís Carrion‐i‐Silvestre et al. (Citation2005) introduce the unit root test with structural breaks but unable to solve the cross-section dependency issue.
The second-generation unit root test of Pesaran (Citation2007) and Moon and Perron (Citation2012) handle all the issues of panel data such as cross-section dependency, parameter heterogeneity but failed to accommodate the presence of structural break (global events) and provide imprecise results However, the third-generation tests of unit root take into account all the panel data issues including all the global events as structural breaks (Bai & Carrion-I-Silvestre, Citation2009). This study employ Bai and Carrion-I-Silvestre (Citation2009), Pesaran (Citation2007) and Lluís Carrion‐i‐Silvestre et al. (Citation2005) evaluate the data stationarity along with all other dynamic interactions in the panel data. The null hypothesis of all unit root tests supports the existence of unit root in data series.
3.3.2. Cointegration test
Before checking the variables for the order of integration, the study tests the heterogeneity of parameters by employing the test of Pesaran and Yamagata (Citation2008) the null hypothesis of the test supports the slope parameter homogeneity whereas the alternative hypothesis assumes the heterogeneity of the slope parameters. Next after considering all the econometric problems related to panel data, the study applied the panel cointegration tests of Westerlund and Edgerton (Citation2008) and Banerjee and Carrion‐i-Silvestre (Citation2017).
The purpose of employing these tests is to identify the presence of a long-term relationship among the variables over all the G7 economies. The Westerlund and Edgerton (Citation2008) is more applicable and superior as it is free from the common factor restrictions. Whereas Banerjee and Carrion‐i-Silvestre (Citation2017) provide in-depth knowledge about the strong and weak of cross-section dependency. These tests are also known as the Common Correlated Effects Mean Group (CCEMG). The null hypothesis of these tests is that there is no cointegration while the alternative hypothesis states that there is a long-term relationship between the variables.
3.3.3. Long-run and short run estimations
According to Yao et al. (Citation2019) to estimate the long run correlation among the panel data the most appropriate estimator is a cross-section augmented autoregressive distribution lag (CS-ARDL). This estimator takes into account the parameters heterogeneity, error cross-country dependency, structural breaks, and dynamic common correlation effects (Çoban & Topcu, Citation2013).
EquationEquation (5)(5)
(5) illustrates the autoregressive distributed lag (ARDL) model as under:
(5)
(5)
Furthermore, the EquationEquation (5)(5)
(5) extended into the EquationEquation (6)
(6)
(6) by using each repressors’ cross-section average. The CS-ARDL estimator presented by Chudik and Pesaran (Citation2015) implementation in empirical form overcome the cross-section dependence effects or the common correlated effects (CCE) with a cross-section average and provide the unbiased results of panel data.
(6)
(6)
where
is used for dependent variable for both the models according to EquationEquations (3)
(3)
(3) and Equation(4)
(4)
(4) carbon emission and PM2.5, respectively. Whereas
indicates the all independent variables such as air transportation, eco-technology, and GDP etc. However, to overcome the cross-section dependency problem the average of both dependent and independent variables is denoted as
While the
and
represents as the variable’s lags.
The value of the long run coefficients is estimated from the coefficients of short run in the cross-section augmented autoregressive distributed lag (CS-ARDL) test. The mean group estimator and the long run coefficient are as under:
(7)
(7)
The mean group is as follows:
(8)
(8)
The estimated short run coefficients are as under:
(9)
(9)
where
(10)
(10)
(11)
(11)
The error correlation term (ECM) value is expected to be negative and significant. The ECM also illiterates the time taken by the economy to adjust toward long-run equilibrium.
3.3.4. Robustness tests
The robustness of the CS-ARDL results is tested through the Augmented Mean Group (AGM) estimator and Common Correlated Effect Mean Group (CCEMG) introduced by Eberhardt and Teal (Citation2011) and Pesaran (Citation2006), respectively. Both the tests are important estimators for a number of reasons. These estimators are deemed to be an appropriate measure to bring more accurate outcomes in the case of data endogeneity, non-stationarity and slope heterogeneity. Moreover, these methods consider the cross-section correlation and cross-section average of coefficients.
4. Results and discussions
The analysis of the panel data starts with the test of cross-section dependency. According to Khan, Ali, Jinyu et al. (Citation2020), Churchill et al. (Citation2019) and Westerlund (Citation2007) to avoid the biased cointegration and unit root results it is very important to address the possible contemporary correlation across the countries. explains the results of the Pesaran (Citation2015) test for cross-section dependency. From the table, it has observed that all the variables result statistically reject the null hypothesis of no cross-section dependency at all significance level such as 1%, 5% and 10%, respectively. Therefore all variables CE, AIR, ECO, GDP and GDP2 comprise cross-section dependence which illustrates that the tremors from one of the G7 countries creates ripple effects and spread across other countries.
Table 2. Results of cross-sectional dependence analysis.
After an initial test of cross-section dependency in the panel data, the next step is to check the stationarity, which will prevent the spurious regression estimates. The study uses the Pesaran (Citation2007) and Bai and Carrion-I-Silvestre (Citation2009) test for unit root determination. These tests are reliable in the presence of cross-section dependency and heterogeneous parameters. illustrates the results of these tests, show stationarity at the level and at the first difference at all levels of significance. The Pesaran (Citation2007) results show that all the variables are stationary at level, whereas according to Bai and Carrion-I-Silvestre (Citation2009) all the variables of the panel data analysis such as CE, AIR, ECO, GDP and GDP2 are integrated into the first order. The mixed result of integration supports the use of the Westerlund and Edgerton (Citation2008) test of cointegration.
Table 3. Results of unit root test with & without structural break Pesaran (Citation2007).
shows the results of slope heterogeneity of the Pesaran and Yamagata (2008) test. The null hypothesis of the test supports the existence of homogenous parameters. According to the result the null hypothesis has rejected at a significance level of 1%, 5% and 10%, respectively which endorse that the coefficient of the models are heterogeneous and the slope varies across countries. For the non-ambiguous results, the presence of heterogeneity, in the panel data requires the second generation cointegration test such as CS-ARDL.
Table 4. Results of slope heterogeneity analysis.
Next, the study employs the cointegration tests of Westerlund and Edgerton (Citation2008) and Banerjee and Carrion‐i-Silvestre (Citation2017) the null hypothesis of each test assumed that there is no cointegration among the dependent and independent variable in the presence of cross-section dependency, slope heterogeneity, structural break. summarise the results of Westerlund and Edgerton (Citation2008) and show the rejection of the null hypothesis at the significance level of 1%, 5% and 10%, respectively across all the three stages of both the dependent variables such as CE and PM2.5 thus the results endorsed the existence of cointegration among CE and AIR, ECO, GDP, GDP2, and PM2.5 and AIR, ECO, GDP, GDP2.
Table 5. Results of Westerlund and Edgerton (Citation2008) panel cointegration analysis.
Moreover, demonstrates the results of Banerjee and Carrion‐i-Silvestre (Citation2017) which endorse the presence of cointegration among all the variables of both models such as dependent variables CE emission and PM2.5 emission and dependent variables AIR, ECO, GDP, GDP2 for the all sections such as Canada, Italy, France, Germany, Japan, The United States and the United State of America.
Table 6. Results of Banerjee and Carrion‐i-Silvestre (Citation2017) cointegration analysis.
After confirming the existence of cointegration through Westerlund and Edgerton (Citation2008), and Banerjee and Carrion‐i-Silvestre (Citation2017) test. The study continues to estimate the long-run and the short-run association between the dependent and independent variables. The prime empirical strategy of the study is to investigate the cointegration vectors, therefore the study employs the CS-ARDL estimator. demonstrates the long-run correlation of CE and PM2.5 with their predictors. For the CE model, the outcome of the test reveals that the coefficient of GDP comes out to be significant and positive which means that with the increase of 1% of GDP the carbon emission increased by 0.311, however, the quadric term of GDP has a negative but significant effect on the carbon emission. The increase of 1% in GDP2 reduced the carbon emission by 0.284% at the level of 10% significance. This shows the presence of an inverted U shape environmental Kuznets Curve (EKC).
Table 7. Results of CS-ARDL analysis (Long run CS-ARDL results).
Similarly, the air transportation (AIR) and eco-innovation (ECO) decreases carbon emission. The coefficient of AIR is −0.253 which is significant at all levels of significance. This can be due to the improvement of airplane engine efficiency and the change in the mix ratio of fuel. The results of air transportation are result is consistent with the outcomes of the study of Kito et al. (Citation2020), Bo et al. (Citation2019) and Zeng et al. (Citation2019). Whereas the ECO shows a −0.264 value of coefficient which imply that the increase of ECO decreases the carbon emission at 5% and 10% significance level, respectively in G7 countries. Eco-innovation results support the outcomes of Afrifa et al. (Citation2020).
On the other hand, for the second model of PM2.5, the empirical results revealed that GDP has a positive impact on air quality degradation. One percent increase in economic growth leads to an increase the air pollution by 0.269% at all levels of significance. Whereas GDP2 shows the reverse results. The coefficient of GDP2 has a negative but significant value of 0.350 which also confirms the existence of invert U shape environmental Kuznets Curve (EKC). In the same way, the AIR and ECO both have negative and significant values of coefficient such as 0.173 and 0.312, respectively. However, the air transportation AIR has a negative impact on the increase of air pollution at a 10% significance level.
Continuing on with the short-term correlation among the variables CS-ARDL short-run estimates indicates that for the first model of CE the GDP significantly upsurges the carbon emission whereas the GDP2 mitigates the effect of carbon emission by 0.039 at all significance level. Similarly, air transportation and eco-innovation also reduce carbon emissions. Moreover, the error correlation term ECM shows the negative coefficient with a significant value of −0.212 illustrates the reasonable convergence of the economies toward the long-run equilibrium. On the other hand, for the second model of PM2.5 the Air transportation, eco-innovation, and GDP2 decreases the concentration of particulate matter significantly except the GDP which shows the negative but insignificant short-run relationship with PM2.5. While the increase in economic growth (GDP) significantly increases the air quality poor standard. Finally, the ECM term for the short-run CS-ARDL results shows a negative and significant coefficient which means that system has reasonable convergence to its equilibrium.
Table 8. Results of CS-ARDL analysis (short run CS-ARDL results).
Moreover, this study used the AMG and CCEMG methods in order to test the robustness of both models. demonstrates the results of long-run elasticities from both tests are strongly align with CS-ARDL estimations. According to the results, economic growth GDP has a positive and significant value of the coefficient is 0.156 with AMG method and 0.238 with CCEMG method for the first model of carbon emission. However, for the remaining variables such as GDP2, AIR and ECO both the AMG and CCEMG methods show the negative and significant impact on environmental degradation with a coefficient of −0.058, −0.237, −0.402 and −0.158, −0.364 and −0.341, respectively.
Table 9. Results of AMG & CCEMG for robustness check.
Similarly, for the second model, according to AMG and CCEMG methods GDP found to have a positive and significant relationship with poor air quality with a coefficient value of 0.251 and 0.103, respectively. Whereas the GDP2, AIR and ECO have a negative but significant impact on the poor air quality by having coefficients of −0.168, −0.247, −0.302 under AMG method and −0.062, −0.208 and −0.342 as per the CCEMG method.
5. Conclusion and policy recommendations
For a sustainable environment, many economic and environmental factors play a key role. The study aimed to empirically examine the influence of air transportation, eco-innovation, and economic growth on the environmental degradation and air quality of the G7 economies for the period from 1990 to 2019. To accommodate the general issues of panel data analysis such as the cross-section dependency, structural break, slope heterogeneity, and presence of unit root the study uses traditional and advanced methods of estimations. The study began with the cross-section dependency test of Pesaran (Citation2015) which shows the presence of cross-section dependency among all variables. Secondly to determine the unit root existence in a panel data series the study applied Pesaran (Citation2007) and Bai and Carrion-I-Silvestre (Citation2009) tests and found that the results of Pesaran (Citation2007) show all the variable stationary at a level whereas the outcomes of Bai and Carrion-I-Silvestre (Citation2009) declares that all series are stationarity at first difference. Moreover, the Pesaran and Yamagata (Citation2008) test determines the presence of heterogeneity in slope parameters of all variables.
Furthermore, the Westerlund and Edgerton (Citation2008) and Banerjee and Carrion‐i-Silvestre (Citation2017) implication in a study discovered the existence of cointegration among both model's dependent and independent variables. However, the investigation of the cointegration vectors through CS-ARDL revealed that air transportation (AIR) and eco-innovation (ECO) have long term negative impact on environmental degradation (CE) and the concentration of particulate matter PM2.5 (air pollution). However, generally, air transportation is considered as the main cause of carbon emission and air pollution but this study discovers the inverse relationship due to the improvement in the mechanism of the fuel consumption by air transportation during the study period. Whereas the increase in economic growth upsurge both the dependent variables CE and PM2.5. The short-run CS ARDL results are similar to the long-run CS ARDL except for the GDP2 which found to have an insignificant relationship with CE at PM2.5. Finally, the outcomes of CS-ARDL are reaffirmed by employing the Augmented Mean Group (AMG) and Common Correlate Effect Mean Group (CCEMG) methods on the panel data.
Environmental degradation is a global phenomenon and there is a need to consider various factors to mitigate the deteriorating effects of greenhouse gases emission. Air transportation generally considered as the main contributor to poor air quality. However, the result of this study support the role of air transportation to reduce greenhouse gases emission and fine particulate matter emission in G-7 countries due to the adaptation of the advanced technology improves in aircraft and the use of alternative fuel or mix ratio fuels. However, there is still a need for more improvement to reduce the carbon emission by the air transportation in the USA, The United Kingdom, and Germany for a sustainable environment. Following are the few recommendations to further control the carbon and fine particulate matter emission in G-7 countries.
The governments should support more research and development to produce improved fuel-efficient aircraft engines. As the size of the aircraft reduces the per-passenger carbon emission therefore for the high demanded domestic routes the use of wide-body or Boeing aircraft should be encouraged. Moreover, the domestic and international flight routes should be optimised and proper air transport structures should implemented for the route and network management. Such as the formation of hub-and spoke networks that manage large passenger flow with minimum transportation links and wide body aircrafts will reduce environmental damages per passenger. The aviation authorities should provide improved communication, technical, and monitoring facilities to minimise the ground-waiting period of aircraft. For the reduced exposure of the particulate matter, it has suggested that aircraft should use less aromatic sulfur and hydrocarbon fuels with improving combustion designs.
Disclosure statement
No potential conflict of interest was reported by the authors.
Additional information
Funding
References
- Adedoyin, F. F., Bekun, F. V., Driha, O. M., & Balsalobre-Lorente, D. (2020). The effects of air transportation, energy, ICT and FDI on economic growth in the industry 4.0 era: Evidence from the United States. Technological Forecasting and Social Change, 160, 120297.
- Afrifa, G. A., Tingbani, I., Yamoah, F., & Appiah, G. (2020). Innovation input, governance and climate change: Evidence from emerging countries. Technological Forecasting and Social Change, 161, 120256. https://doi.org/10.1016/j.techfore.2020.120256
- Ali, S. S., Kaur, R., Persis, D. J., Saha, R., Pattusamy, M., & Sreedharan, V. R. (2020). Developing a hybrid evaluation approach for the low carbon performance on sustainable manufacturing environment. Annals of Operations Research, 1–33. https://doi.org/10.1007/s10479-020-03877-1
- An, H., Razzaq, A., Haseeb, M., & Mihardjo, L. W. (2021). The role of technology innovation and people's connectivity in testing environmental Kuznets curve and pollution heaven hypotheses across the Belt and Road host countries: New evidence from Method of Moments Quantile Regression. Environmental Science and Pollution Research International, 28(5), 5254–5270. https://doi.org/10.1007/s11356-020-10775-3
- An, H., Razzaq, A., Nawaz, A., Noman, S. M., & Khan, S. A. R. (2021). Nexus between green logistic operations and triple bottom line: Evidence from infrastructure-led Chinese outward foreign direct investment in Belt and Road host countries. Environmental Science and Pollution Research, 28(37), 1–24. https://doi.org/10.1007/s11356-021-12470-3
- Arter, C. A., & Arunachalam, S. (2021). Assessing the importance of nonlinearity for aircraft emissions' impact on O3 and PM2.5. Science of the Total Environment, 777, 146121. https://doi.org/10.1016/j.scitotenv.2021.146121
- ATAG. (2020). Facts & figures. Retrieved March 8, 2021, from https://www.atag.org/facts-figures.html
- Bai, J., & Carrion-I-Silvestre, J. L. (2009). Structural changes, common stochastic trends, and unit roots in panel data. Review of Economic Studies, 76(2), 471–501. https://doi.org/10.1111/j.1467-937X.2008.00530.x
- Balkanski, Y., Myhre, G., Gauss, M., Rädel, G., Highwood, E. J., & Shine, K. P. (2010). Direct radiative effect of aerosols emitted by transport: From road, shipping and aviation. Atmospheric Chemistry and Physics, 10(10), 4477–4489. https://doi.org/10.5194/acp-10-4477-2010
- Balsalobre-Lorente, D., Driha, O. M., Bekun, F. V., & Adedoyin, F. F. (2021). The asymmetric impact of air transport on economic growth in Spain: Fresh evidence from the tourism-led growth hypothesis. Current Issues in Tourism, 24(4), 503–519. https://doi.org/10.1080/13683500.2020.1720624
- Banerjee, A., & Carrion‐i-Silvestre, J. L. (2017). Testing for panel cointegration using common correlated effects estimators. Journal of Time Series Analysis, 38(4), 610–636. https://doi.org/10.1111/jtsa.12234
- Baumeister, S. (2017). ‘Each flight is different’: Carbon emissions of selected flights in three geographical markets. Transportation Research Part D: Transport and Environment, 57, 1–9. https://doi.org/10.1016/j.trd.2017.08.020
- Bo, X., Xue, X., Xu, J., Du, X., Zhou, B., & Tang, L. (2019). Aviation's emissions and contribution to the air quality in China. Atmospheric Environment, 201, 121–131. https://doi.org/10.1016/j.atmosenv.2019.01.005
- Chien, F., Sadiq, M., Nawaz, M. A., Hussain, M. S., Tran, T. D., & Le Thanh, T. (2021). A step toward reducing air pollution in top Asian economies: The role of green energy, eco-innovation, and environmental taxes. Journal of Environmental Management, 297, 113420.
- Choi, I. (2001). Unit root tests for panel data. Journal of International Money and Finance, 20(2), 249–272. https://doi.org/10.1016/S0261-5606(00)00048-6
- Churchill, S. A., Inekwe, J., Smyth, R., & Zhang, X. (2019). R&D intensity and carbon emissions in the G7: 1870–2014. Energy Economics, 80, 30–37. https://doi.org/10.1016/j.eneco.2018.12.020
- Chudik, A., & Pesaran, M. H. (2015). Common correlated effects estimation of heterogeneous dynamic panel data models with weakly exogenous regressors. Journal of Econometrics, 188(2), 393–420.
- Çoban, S., & Topcu, M. (2013). The nexus between financial development and energy consumption in the EU: A dynamic panel data analysis. Energy Economics, 39, 81–88.
- Corporan, E., Roquemore, M., Harrison, W., Jacobson, A., & Phelps, D. (2002). Air Force programs to reduce particulate matter emissions from aircraft. In 38th AIAA/ASME/SAE/ASEE Joint Propulsion Conference & Exhibit (p. 3722).
- Destek, M. A., & Sarkodie, S. A. (2019). Investigation of environmental Kuznets curve for ecological footprint: The role of energy and financial development. The Science of the Total Environment, 650(Pt 2), 2483–2489.
- Eberhardt, M., & Teal, F. (2011). Aggregation versus heterogeneity in cross-country growth empirics (No. 11/08). CREDIT Research Paper.
- Erdogan, S., Adedoyin, F. F., Bekun, F. V., & Sarkodie, S. A. (2020). Testing the transport-induced environmental Kuznets curve hypothesis: The role of air and railway transport. Journal of Air Transport Management, 89, 101935. https://doi.org/10.1016/j.jairtraman.2020.101935
- Habre, R., Zhou, H., Eckel, S. P., Enebish, T., Fruin, S., Bastain, T., Rappaport, E., & Gilliland, F. (2018). Short-term effects of airport-associated ultrafine particle exposure on lung function and inflammation in adults with asthma. Environment International, 118, 48–59. https://doi.org/10.1016/j.envint.2018.05.031
- Harris, R. D., & Tzavalis, E. (1999). Inference for unit roots in dynamic panels where the time dimension is fixed. Journal of Econometrics, 91(2), 201–226. https://doi.org/10.1016/S0304-4076(98)00076-1
- Harrison, R. M., Masiol, M., & Vardoulakis, S. (2015). Civil aviation, air pollution and human health. Environmental Research Letters, 10(4), 041001. https://doi.org/10.1088/1748-9326/10/4/041001
- Im, K. S., Pesaran, M. H., & Shin, Y. (2003). Testing for unit roots in heterogeneous panels. Journal of Econometrics, 115(1), 53–74. https://doi.org/10.1016/S0304-4076(03)00092-7
- Khan, Z., Ali, M., Jinyu, L., Shahbaz, M., & Siqun, Y. (2020). Consumption-based carbon emissions and trade nexus: Evidence from nine oil exporting countries. Energy Economics, 89, 104806. https://doi.org/10.1016/j.eneco.2020.104806
- Khan, Z., Ali, S., Umar, M., Kirikkaleli, D., & Jiao, Z. (2020). Consumption-based carbon emissions and international trade in G7 countries: The role of environmental innovation and renewable energy. Science of the Total Environment, 730, 138945. https://doi.org/10.1016/j.scitotenv.2020.138945
- Kito, M., Nagashima, F., Kagawa, S., & Nansai, K. (2020). Drivers of CO2 emissions in international aviation: The case of Japan. Environmental Research Letters, 15(10), 104036. https://doi.org/10.1088/1748-9326/ab9e9b
- Kommenda, N. (2019). How your flight emits as much CO2 as many people do in a year. The Guardian. https://www.theguardian.com/environment/nginteractive/2019/jul/19/carbon-calculator-how-taking-one-flight-emits-as-much-asmany-people-do-in-a-year
- Lee, B. L., Wilson, C., Pasurka, C. A., Fujii, H., & Managi, S. (2017). Sources of airline productivity from carbon emissions: An analysis of operational performance under good and bad outputs. Journal of Productivity Analysis, 47(3), 223–246. https://doi.org/10.1007/s11123-016-0480-4
- Levin, A., Lin, C. F., & Chu, C. S. J. (2002). Unit root tests in panel data: Asymptotic and finite-sample properties. Journal of Econometrics, 108(1), 1–24. https://doi.org/10.1016/S0304-4076(01)00098-7
- Li, X., Wang, J., Zhang, M., Ouyang, J., & Shi, W. (2020). Regional differences in carbon emission of China’s industries and its decomposition effects. Journal of Cleaner Production, 270, 122528. https://doi.org/10.1016/j.jclepro.2020.122528
- Lin, W., He, Q., & Yu, H. (2021). The convergence of PM2.5 concentration in Chinese cities: A distribution dynamic approach. Economic Research-Ekonomska Istraživanja, 1–19. https://doi.org/10.1080/1331677X.2021.1967772
- Ling, G., Razzaq, A., Guo, Y., Fatima, T., & Shahzad, F. (2021). Asymmetric and time-varying linkages between carbon emissions, globalization, natural resources and financial development in China. Environment, Development and Sustainability, 1–29. https://doi.org/10.1007/s10668-021-01724-2
- Lingyan, M., Zhao, Z., Malik, H. A., Razzaq, A., An, H., & Hassan, M. (2021). Asymmetric impact of fiscal decentralization and environmental innovation on carbon emissions: Evidence from highly decentralized countries. Energy & Environment, 0958305X2110184. https://doi.org/10.1177/0958305X211018453
- Liu, X., Zhou, D., Zhou, P., & Wang, Q. (2017). Dynamic carbon emission performance of Chinese airlines: A global Malmquist index analysis. Journal of Air Transport Management, 65, 99–109. https://doi.org/10.1016/j.jairtraman.2017.09.009
- Lluís Carrion‐i‐Silvestre, J., Del Barrio-Castro, T., & López-Bazo, E. (2005). Breaking the panels: An application to the GDP per capita. The Econometrics Journal, 8(2), 159–175.
- Lo, P. L., Martini, G., Porta, F., & Scotti, D. (2020). The determinants of CO2 emissions of air transport passenger traffic: An analysis of Lombardy (Italy). Transport Policy, 91, 108–119. https://doi.org/10.1016/j.tranpol.2018.11.010
- Lu, Y., Shao, M., Zheng, C., Ji, H., Gao, X., & Wang, Q. G. (2020). Air pollutant emissions from fossil fuel consumption in China: Current status and future predictions. Atmospheric Environment, 231, 117536. https://doi.org/10.1016/j.atmosenv.2020.117536
- Malhotra, A., & Schmidt, T. S. (2020). Accelerating low-carbon innovation. Joule, 4(11), 2259–2267. https://doi.org/10.1016/j.joule.2020.09.004
- Mavi, R. K., Fathi, A., Saen, R. F., & Mavi, N. K. (2019). Eco-innovation in transportation industry: A double frontier common weights analysis with ideal point method for Malmquist productivity index. Resources, Conservation and Recycling, 147, 39–48. https://doi.org/10.1016/j.resconrec.2019.04.017
- Moniruzzaman, C. G., Bowden, J., & Arunachalam, S. (2020). Aircraft landing and takeoff emission impacts on surface O3 and PM2.5 through aerosol direct feedback effects estimated by the coupled WRF-CMAQ model. Atmospheric Environment, 243, 117859. https://doi.org/10.1016/j.atmosenv.2020.117859
- Moon, H. R., & Perron, B. (2012). Beyond panel unit root tests: Using multiple testing to determine the nonstationarity properties of individual series in a panel. Journal of Econometrics, 169(1), 29–33. https://doi.org/10.1016/j.jeconom.2012.01.008
- Mukherjee, A., & Agrawal, M. (2017). A global perspective of fine particulate matter pollution and its health effects. Reviews of Environmental Contamination and Toxicology, 244, 5–51.
- Naghawi, H. (2019). Econometric modeling for international passenger air travel demand in Jordan. Jordan Journal of Civil Engineering, 13(3), 377–385.
- Nasreen, S., Saidi, S., & Ozturk, I. (2018). Assessing links between energy consumption, freight transport, and economic growth: Evidence from dynamic simultaneous equation models. Environmental Science and Pollution Research International, 25(17), 16825–16841.
- Orji, I. J., Kusi-Sarpong, S., Gupta, H., & Okwu, M. (2019). Evaluating challenges to implementing eco-innovation for freight logistics sustainability in Nigeria. Transportation Research Part A: Policy and Practice, 129, 288–305.
- Ozturk, I., & Acaravci, A. (2013). The long-run and causal analysis of energy, growth, openness and financial development on carbon emissions in Turkey. Energy Economics, 36, 262–267. https://doi.org/10.1016/j.eneco.2012.08.025
- Öztürk, İ., Sharif, A., Tuzemenc, O. B., Uzuner, G., & Sinha, A. (2020). Revisiting the role of renewable and non-renewable energy consumption on Turkey’s ecological footprint: Evidence from Quantile ARDL approach. Sustainable Cities and Society, 57, 102138.
- Penn, S. L., Boone, S. T., Harvey, B. C., Heiger-Bernays, W., Tripodis, Y., Arunachalam, S., & Levy, J. I. (2017). Modeling variability in air pollution-related health damages from individual airport emissions. Environmental Research, 156, 791–800.
- Pesaran, M. H. (2006). Estimation and inference in large heterogeneous panels with a multifactor error structure. Econometrica, 74(4), 967–1012. https://doi.org/10.1111/j.1468-0262.2006.00692.x
- Pesaran, M. H. (2007). A simple panel unit root test in the presence of cross‐section dependence. Journal of Applied Econometrics, 22(2), 265–312. https://doi.org/10.1002/jae.951
- Pesaran, M. H. (2015). Testing weak cross-sectional dependence in large panels. Econometric Reviews, 34(6–10), 1089–1117. https://doi.org/10.1080/07474938.2014.956623
- Pesaran, M. H., & Yamagata, T. (2008). Testing slope homogeneity in large panels. Journal of econometrics, 142(1), 50–93.
- Pope, C. A., III, Coleman, N., Pond, Z. A., & Burnett, R. T. (2020). Fine particulate air pollution and human mortality: 25+ years of cohort studies. Environmental Research, 183, 108924. https://doi.org/10.1016/j.envres.2019.108924
- Razzaq, A., Ajaz, T., Li, J. C., Irfan, M., & Suksatan, W. (2021). Investigating the asymmetric linkages between infrastructure development, green innovation, and consumption-based material footprint: Novel empirical estimations from highly resource-consuming economies. Resources Policy, 74, 102302. https://doi.org/10.1016/j.resourpol.2021.102302
- Razzaq, A., Sharif, A., Ahmad, P., & Jermsittiparsert, K. (2021). Asymmetric role of tourism development and technology innovation on carbon dioxide emission reduction in the Chinese economy: Fresh insights from QARDL approach. Sustainable Development, 29(1), 176–193. https://doi.org/10.1002/sd.2139
- Razzaq, A., Sharif, A., Aziz, N., Irfan, M., & Jermsittiparsert, K. (2020). Asymmetric link between environmental pollution and COVID-19 in the top ten affected states of US: A novel estimations from quantile-on-quantile approach. Environmental Research, 191, 110189. https://doi.org/10.1016/j.envres.2020.110189
- Razzaq, A., Sharif, A., Najmi, A., Tseng, M. L., & Lim, M. K. (2021). Dynamic and causality interrelationships from municipal solid waste recycling to economic growth, carbon emissions and energy efficiency using a novel bootstrapping autoregressive distributed lag. Resources, Conservation and Recycling, 166, 105372. https://doi.org/10.1016/j.resconrec.2020.105372
- Razzaq, A., Wang, Y., Chupradit, S., Suksatan, W., & Shahzad, F. (2021). Asymmetric inter-linkages between green technology innovation and consumption-based carbon emissions in BRICS countries using quantile-on-quantile framework. Technology in Society, 66, 101656. https://doi.org/10.1016/j.techsoc.2021.101656
- Rutherford, D., Mao, X., Osipova, L., & Comer, B. (2020). Limiting engine power to reduce CO [Working Paper 2020-01]. International Council on Clean Transportation, 1–16.
- Saether, E. A., Eide, A. E., & Bjørgum, Ø. (2021). Sustainability among Norwegian maritime firms: Green strategy and innovation as mediators of long‐term orientation and emission reduction. Business Strategy and the Environment, 30(5), 2382–2395. https://doi.org/10.1002/bse.2752
- Salim, R., Yao, Y., & Chen, G. S. (2017). Does human capital matter for energy consumption in China? Energy Economics, 67, 49–59. https://doi.org/10.1016/j.eneco.2017.05.016
- Sharif, A., Baris-Tuzemen, O., Uzuner, G., Ozturk, I., & Sinha, A. (2020). Revisiting the role of renewable and non-renewable energy consumption on Turkey’s ecological footprint: Evidence from Quantile ARDL approach. Sustainable Cities and Society, 57, 102138. https://doi.org/10.1016/j.scs.2020.102138
- Sharif, A., Raza, S. A., Ozturk, I., & Afshan, S. (2019). The dynamic relationship of renewable and nonrenewable energy consumption with carbon emission: A global study with the application of heterogeneous panel estimations. Renewable Energy, 133, 685–691. https://doi.org/10.1016/j.renene.2018.10.052
- Staples, M. D., Malina, R., Suresh, P., Hileman, J. I., & Barrett, S. R. (2018). Aviation CO2 emissions reductions from the use of alternative jet fuels. Energy Policy, 114, 342–354. https://doi.org/10.1016/j.enpol.2017.12.007
- Sun, Y., Duru, O. A., Razzaq, A., & Dinca, M. S. (2021). The asymmetric effect eco-innovation and tourism towards carbon neutrality target in Turkey. Journal of Environmental Management, 299, 113653.
- Suwarni, Akhmetshin, E. M., Okagbue, H. I., Lydia, E. L., & Shankar, K. (2020). Digital economic challenges and economic growth in environmental revolution 4.0. Journal of Environmental Treatment Techniques, 8(1), 546–550.
- Tao, R., Umar, M., Naseer, A., & Razi, U. (2021). The dynamic effect of eco-innovation and environmental taxes on carbon neutrality target in emerging seven (E7) economies. Journal of Environmental Management, 299, 113525.
- U.S. Environmental Protection Agency (EPA). (2019). Integrated Science Assessment (ISA) for particulate matter (Final Report, 2019). U.S. Environmental Protection Agency, EPA/600/R-19/188. Retrieved May 10, 2021, from https://cfpub.epa.gov/ncea/isa/recordisplay.cfm?deid=347534
- Van Song, N., Tiep, N. C., van Tien, D., Van Ha, T., Phuong, N. T. M., & Mai, T. T. H. (2021). The role of public-private partnership investment and eco-innovation in environmental abatement in USA: Evidence from quantile ARDL approach. Environmental Science and Pollution Research, 1–12. https://doi.org/10.1007/s11356-021-16520-8
- Westerlund, J. (2007). Testing for error correction in panel data. Oxford Bulletin of Economics and Statistics, 69(6), 709–748. https://doi.org/10.1111/j.1468-0084.2007.00477.x
- Westerlund, J., & Edgerton, D. L. (2008). A simple test for cointegration in dependent panels with structural breaks. Oxford Bulletin of Economics and Statistics, 70(5), 665–704. https://doi.org/10.1111/j.1468-0084.2008.00513.x
- Wise, M., Muratori, M., & Kyle, P. (2017). Biojet fuels and emissions mitigation in aviation: An integrated assessment modeling analysis. Transportation Research Part D: Transport and Environment, 52, 244–253. https://doi.org/10.1016/j.trd.2017.03.006
- Woody, M. C., Wong, H. W., West, J. J., & Arunachalam, S. (2016). Multiscale predictions of aviation-attributable PM2.5 for US airports modeled using CMAQ with plume-in-grid and an aircraft-specific 1-D emission model. Atmospheric Environment, 147, 384–394. https://doi.org/10.1016/j.atmosenv.2016.10.016
- World Bank. (2020). Patent applications. RESD. Retrieved May 28, 2020, from https://data.worldbank.org/indicator/IP.PAT
- Yao, Y., Ivanovski, K., Inekwe, J., & Smyth, R. (2019). Human capital and energy consumption: Evidence from OECD countries. Energy Economics, 84, 104534. https://doi.org/10.1016/j.eneco.2019.104534
- Yu, J., Shao, C., Xue, C., & Hu, H. (2020). China's aircraft-related CO2 emissions: Decomposition analysis, decoupling status, and future trends. Energy Policy, 138, 111215. https://doi.org/10.1016/j.enpol.2019.111215
- Yu, W. D., Cheng, S. T., Miao, C. M., & Perng, G. Y. (2017). Green innovation of green roof technology – A case study: Umweltverträgliche Dachtechnologie‐eine Fallstudie. Materialwissenschaft und Werkstofftechnik, 48(5), 420–429. https://doi.org/10.1002/mawe.201700015
- Yurdakul, M., & Kazan, H. (2020). Effects of eco-innovation on economic and environmental performance: Evidence from Turkey’s manufacturing companies. Sustainability, 12(8), 3167. https://doi.org/10.3390/su12083167
- Zeng, W., Liu, J., Yu, L., Ma, H., & Zheng, W. (2019). Reaction kinetic simulation of the combustion and emission characteristics of a dual-fuel aero-engine. Fuel, 237, 352–360. https://doi.org/10.1016/j.fuel.2018.09.122
- Zhang, X., Karl, M., Zhang, L., & Wang, J. (2020). Influence of aviation emission on the particle number concentration near Zurich airport. Environmental Science & Technology, 54(22), 14161–14171. https://doi.org/10.1021/acs.est.0c02249
- Zhang, X., Zheng, Y., & Wang, S. (2019). A demand forecasting method based on stochastic frontier analysis and model average: An application in air travel demand forecasting. Journal of Systems Science and Complexity, 32(2), 615–633. https://doi.org/10.1007/s11424-018-7093-0
- Zhang, Y. J., Peng, Y. L., Ma, C. Q., & Shen, B. (2017). Can environmental innovation facilitate carbon emissions reduction? Evidence from China. Energy Policy, 100, 18–28. https://doi.org/10.1016/j.enpol.2016.10.005
- Zheng, X. S., Graver, B., & Rutherford, D. (2019). US domestic airline fuel efficiency ranking, 2017-2018. The International Council of Clean Transportation. https://theicct.org/sites/default/files/publications/CO2-commercial-aviation-oct2020.pdf