
 ?Mathematical formulae have been encoded as MathML and are displayed in this HTML version using MathJax in order to improve their display. Uncheck the box to turn MathJax off. This feature requires Javascript. Click on a formula to zoom.
Abstract
From the perspective of spatial interaction, the impact of the modern service industry’s agglomeration on today’s increasingly connected cities is worth studying. This study uses a spatial econometric model to test the development trends and factors influencing the modern service industry’s agglomeration in the Yangtze River Delta city group. The results show that the industry has the highest agglomeration in leasing and business and the lowest in education. The overall concentration of the industry is generally low, implying a more fragmented distribution. Moreover, the agglomeration has a significant positive spatial correlation with economic development, knowledge intensity, and city size. However, it has a negative correlation with information technology level and transportation infrastructure, inconsistent with existing research. This study argues that the development of the information technology level and transportation infrastructure in a city could lead to the ‘virtual agglomeration’ of the modern service industry and gradual decentralisation in geographical distribution. This is a new paradox that city groups may face when improving their infrastructure and developing modern services. This study uses the spatial interaction perspective to propose policy recommendations for promoting the modern service industry’s agglomeration and coordinated regional development.
1. Introduction
Research on industrial agglomeration has attracted the attention of academia since the neoclassical economic period. Industrial agglomeration is often guided by the market’s spontaneous behaviour and is mainly caused by three factors: labour market pooling, investment in intermediate products, and specialised markets. As rational market players, enterprises will agglomerate to achieve optimal efficiency based on differences in factor endowments. The government can also realize the Leontief multiplier and polarisation effects through administrative intervention, thereby promoting industrial agglomeration (Perroux, Citation1950). Research in this area has advanced with the emergence of new economic geography in the 1990s, and after Krugman (Citation1991) and Fujita et al. (Citation1999) incorporated spatial factors into the industrial agglomeration analysis framework. Such research focuses on the causes, mechanisms, and influencing factors of industrial agglomeration locally and overseas, thereby forming the two intertwined theoretical models of ‘new economic geography’ (Chen et al., Citation2017; Goto & Minamimura, Citation2019; Martinez-Galarraga et al., Citation2021) and ‘new geographic economics’ (Thisse, Citation2011). Extensive empirical research has also been conducted in China to verify and supplement the two models.
As the world economy shifts from an ‘industrial economy’ to a ‘service economy’, the ‘service-based economy’ and ‘knowledge-based services’ have become the main pillars of economic development. Therefore, the focus of industrial agglomeration research has shifted from manufacturing to the service industry. Moreover, the development of the geography of service has promoted research on the spatial interaction of the service industry. Cao et al. (Citation2019) argued that, in China, service companies show significant spatial heterogeneity. Smętkowski et al. (Citation2021) found that, in Warsaw, different producer service industries have different spatial distribution patterns, Kim et al. (Citation2021) revealed a significant spillover effect in the service industry in the United Kingdom. Wu et al. (Citation2021) found that high-end service industry agglomeration has a significant spatial interaction in China.
However, existing studies mainly focus on producer services (Xi et al., Citation2021; Yang et al., Citation2020; Yeh et al., Citation2017), knowledge-intensive services (Boix-Domenech & Soler-Marco, Citation2017; Chung & Tseng, Citation2019; Kuchiki, Citation2021), and the relationship between producer services and the manufacturing industry (Li, Citation2017; Liu et al., Citation2019). Only a few studies have been conducted on the agglomeration of the modern service industry from the perspective of spatial interaction. The modern service industry includes basic, production and marketing, consumer, and public services. Unlike other industries, the personal consumption and public service industries have high substitutability and relatively weak agglomeration capacity. Compared with the traditional service industry, the modern service industry is characterised by complex technical and cultural content and meets the demands of modern people and cities. Given China’s intensive urban construction, an increasing number of densely distributed cities of different administrative grades have started forming city groups under the action of spatial interaction. Moreover, the city group’s service industry is dominated by the modern service industry. The geographical proximity and social and cultural homogeneity of city groups can significantly reduce spatial transaction costs due to integrated construction (Rabellotti, Citation1997), promoting the modern service industry’s agglomeration. Scholars have arrived at many research results in industry agglomeration from the city group perspective (Shao et al., Citation2017; Tang & Xiu, Citation2021), with the following questions: What are the spatial and temporal evolution characteristics of the modern service industry within a city group? Will the factors that affect the service industry’s agglomeration produce new changes within the city group? How are policies formulated when cities of different sizes in a city group promote the agglomeration of modern services? These questions have certain research value, and attempts have been made to answer them (Xi et al., Citation2021). Thus, the current study will discuss the agglomeration of the modern service industry and its influencing factors from the perspective of spatial interaction in the city group. Spatial interaction in geography is reflected by the spatial autocorrelation of data, and the spatial econometric model is an important method for calculating spatial autocorrelation. Therefore, a spatial econometric model was selected to by this study.
The remainder of this paper is organised as follows. Section 2 characterises the modern service industry’s agglomeration in the Yangtze River Delta (YRD) city group through the spatial Gini coefficient. Section 3 builds the theoretical analysis framework. Section 4 presents the empirical methodology. Section 5 selects the variables and econometric model, analyses the results, and discusses the dynamic relationship between modern service industry agglomeration, information technology, and infrastructure construction from the spatial interaction perspective. Finally, Section 6 presents a summary and future research prospect.
2. Characteristics of modern service industry agglomeration
2.1. Study area
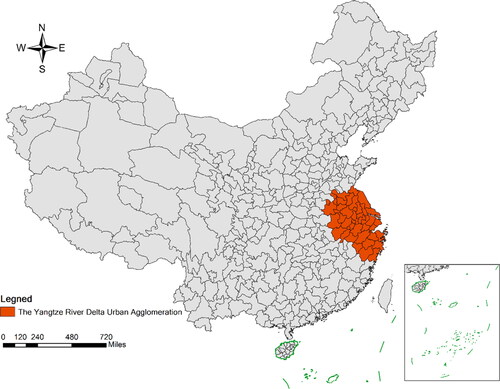
This study considered 41 cities above the prefecture level in China’s YRD (Yangtze River Delta) city group from 2008 to 2018. The reasons for selecting these subjects are as follows. First, this study uses spatial measurement for analysis because the smaller the geographical unit, the more accurate the measurement results. Previous research has mainly focused on provincial cities. Moreover, a considerably microscopic research subject can substantially reflect the agglomeration of the modern service industry. Second, the YRD city group is the only world-class city group in China and is an internationally competitive and globally important modern service centre (Zhou et al., Citation2021). Therefore, this agglomeration is a typical representative sample. The Chinese government is good at testing new policies through ‘early and pilot implementation’ and then amending or promoting these policies based on the lessons learned from successes and failures. Hence, there is also some guidance for the YRD city groups. Third, the evolution of the service process can take 10–20 years or longer. Accordingly, the current study considers the Guidelines on Accelerating the Development of the Service Industry promulgated by China’s State Council (Citation2008), which has had a strong influence on the development of the modern service industry.
The geographical location of the study area is shown in .
Figure 1. Spatial distribution of the Yangtze River Delta urban agglomeration.
Source: Made by author.
2.2. Characteristics of modern service industry agglomeration
This study uses the spatial Gini coefficient to describe the clustering characteristics of the modern service industry. The industry comprises basic, production and marketing, consumption, and public services, but considers consumption and public management services to be the final services, which tend to be geographically diversified (Illeris, Citation1996). Thus, the current study selected services related to transportation, warehousing, and post (TP); information transmission, software, and information technology (IT); finance (FN); real estate (RE); leasing and business (LB); scientific research and technology (ST); education (ED); and culture, sports, and entertainment (CE). The main measurement methods of industrial agglomeration are the spatial Gini coefficient (from an industry perspective), Herfindahl index (from a firm perspective), location entropy (level of industry specialisation), and EG index (based on the spatial Gini coefficient). The Gini coefficient comprehensively considers the two dimensions of industry and enterprise, and is a better measurement method due to its superior representativeness. Given that we only need to describe the spatial clustering characteristics and degree of the modern service industry in the YRD city group, disregarding the enterprise dimension does not affect the judgment of spatial agglomeration. Therefore, the spatial Gini coefficient is adopted, and is calculated as follows (Krugman, Citation1991):
(1)
(1)
where
refers to the spatial Gini coefficient,
refers to the ratio of the modern service industry’s employment in region i to the total employment by the modern service industry in the YRD city group,
is the ratio of the total employment in region i to the total employment in the YRD city group, and n represents the number of sample regions. The larger the G, the higher the degree of spatial agglomeration, and conversely, the more balanced the spatial layout, where G ∈ [0, 1].
This study used the modern service sub-industry data of 41 cities in the YRD city group from 2008 to 2018 and calculated the Gini coefficient according to EquationEquation (1)(1)
(1) . presents the results.
Table 1. Spatial Gini coefficient of modern service industry in Yangtze River Delta city group.
In , there is a clear difference in the spatial Gini coefficients between industries. A ranking by industry indicates the following pattern: leasing and business services coefficient > scientific research and technology services coefficient > transportation, warehousing, and postal services coefficient > information transmission, software, and information technology services coefficient > real estate services coefficient > culture, sports, and entertainment services coefficient > finance services coefficient > education services coefficient. Leasing and business services have the highest spatial concentration, while employees in these industries are mainly concentrated in municipalities, provincial capitals, or large cities, such as Shanghai, Hangzhou, Nanjing, Ningbo, Suzhou, and Hefei. The proportion of employment in these cities in the YRD city group is 50.10%, 12.09%, 8.08%, 5.48%, 2.43%, and 2.12%, respectively, accounting for 80.29%. The spatial distribution of the education industry is the most balanced (except for Shanghai, which accounts for over 20%), while the remainder of the cities are within 10%.
also shows that the overall Gini coefficient of the modern service industry in the YRD city group is generally not high. The service industry is highly concentrated. The well-developed infrastructure, large markets, and extensive labour resources in metropolises encourage the development of the service industry. The modern service industry is characterised by complex technical and cultural content and the ability to meet the demands of modern people and cities. Given the increasing land rent in most metropolises and the development of information technology and transportation, many modern service industries have started migrating outwards from the metropolis, resulting in diffusion. Therefore, the low Gini coefficient of the YRD city group may also be owing to a similar phenomenon. A non-linear relationship may exist between this phenomenon and the development of information technology and transportation infrastructure. Section 4 discusses this issue in detail.
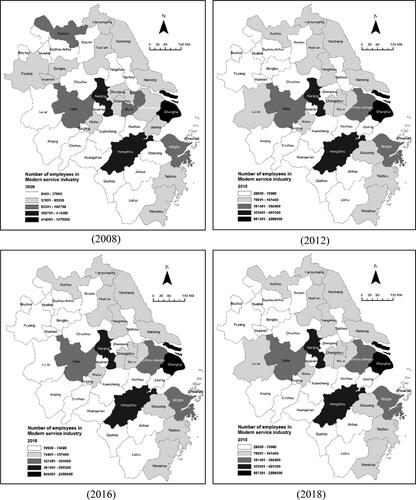
These results indicate that the modern service industry’s agglomeration in the YRD has four main characteristics. First, industries with high spatial agglomeration are production-oriented, and the agglomeration areas exhibit high levels of economic development. The top-ranked industries are leasing and business services; scientific research and technical services; transportation, warehousing, and postal services; information transmission, software, and information services; and real estate services. These industries are producer service industries and are highly concentrated in Shanghai, Hangzhou, Nanjing, and Hefei, among other cities. Rental and business services, and transportation, warehousing, and postal services in Shanghai account for over 50% of the total employment in the YRD, showing evident spatial agglomeration. Second, industries with low spatial agglomeration are mostly consumer-oriented, and the agglomeration areas are mostly municipalities and provincial capitals, such as Shanghai, Hangzhou, Nanjing, and Hefei. Financial services; culture, sports, and entertainment services; and education services are all consumer-oriented industries. Such industries have broad and balanced distribution and low spatial agglomeration owing to their extensive audience, low industry threshold, and considerable substitution flexibility. Third, the Gini coefficient of some industries exhibits an inverted-U shaped trend over time. This indicates that although the spatial agglomeration of the modern service industry in the YRD city group has increased, there may be an agglomeration–diffusion–aggregation phenomenon at play during the entire process. Fourth, distinct features emerge from the perspective of spatial distribution. shows that the employees of modern service industries are mainly concentrated in Shanghai, Hangzhou, Nanjing, Hefei, and other metropolises, but the surrounding areas have relatively few modern service workers. The polarisation effect of the core metropolis may be greater than its diffusion effect, leading to the ‘shadow effect of agglomeration’. However, the agglomeration and diffusion of the service industry are often relative and dynamic. Given the further development of core cities, the agglomeration of the modern service industry may have changed.
Figure 2. Spatial distribution of modern service workers in the Yangtze River Delta urban agglomeration (2008, 2012, 2016, 2018).
Source: Made by author.
3. Analysis of the factors influencing modern service industry agglomeration
Chen et al. (Citation2009) proposed an analytical framework based on factors, space, cities, and institutions for the agglomeration of producer service industries. Xie et al. (Citation2015) analysed the factors driving the modern service industry’s agglomeration in China and found that the economic development level, fixed asset investment, and traffic conditions had the greatest impact. Ren and Qiu (Citation2010) calculated the spatial Gini coefficient of the modern service industry in the YRD city group, and found that the top four industries—including the leasing and business services; scientific research and technical services; transportation, warehousing, and postal services; and information transmission, software, and information technology services—are production-oriented. Accordingly, production-oriented service industries have a relatively significant impact on the agglomeration process of modern service industries. This study uses the existing literature and the characteristics of flexible production in production-oriented services to analyse four agglomeration factors: economic development, informatisation level, knowledge intensity, and urban size.
3.1. Economic development
According to new economic geography, the spatial agglomeration economy is an external economy of scale, including localised and urbanised economies (Malmberg et al., Citation2000). Economic development in cities can result in the agglomeration of labour and capital, rapid diffusion of professional information and technology, sharing of infrastructure construction, and concentration of markets. Therefore, service industries tend to agglomerate in metropolitan areas, with this locational choice closely related to the ability of cities to bring greater economic benefits and regional economic growth. The expansion of economic scale resulting from economic development and an increase in GDP per capita are conducive to stimulating consumption growth, thereby encouraging the development of the modern service industry.
3.2. Informatisation level
Krugman (Citation1991) explained the spatial agglomeration effects of industries by combining the assumptions of imperfect competition and increasing returns to scale in new trade theory with the transportation costs in location theory. He considered the geographical concentration of production as evidence of the ubiquity of increasing returns. However, the majority of the outputs of the modern service industry are ‘intangible products’ that rely on information technology. The transportation cost of products is not the geographic transportation cost, but the information cost based on the network. Therefore, within the context of the modern service industry, the informatisation level can better reflect the spatial factors in the agglomeration process compared to transportation infrastructure.
3.3. Knowledge intensity
Marshall and Marshall (Citation1920) summarised the externality theory and found that technology and knowledge spillover are important factors affecting industrial agglomeration. The modern service industry is a high-tech economic activity. Industrial agglomeration resulting from an active collective-learning process is highly efficient and improves the competitive advantage of agglomeration enterprises (Keeble & Nachum, Citation2002; Shi et al., Citation2014). Some studies have found that the geographical agglomeration of enterprises is not so much to benefit from the localised input–output connection as to acquire strong learning and innovation ability in pursuit of a special local environment (Malmberg, Citation1996). Geographical proximity can help realize technological innovation and knowledge accumulation, thereby creating a convenient learning environment, reducing innovation uncertainty, increasing knowledge density, and producing a regional engine to promote industrial agglomeration and economic growth (Markusen, Citation1996). In particular, the modern service industry relies considerably on human capital, which is knowledge-intensive. Thus, knowledge intensity is expected to have a significant positive impact on the industry’s agglomeration.
3.4. Urban size
Service industry agglomeration is considerably biased toward cities (Mun & Hutchinson, Citation1995). As workers migrate to the agglomeration, urban size expands. However, it is unclear what impact urban size expansion will have on the agglomeration of the service industry. Urban economics generally believes that the size of cities can be maximised but not minimised. According to the second axiom of the urban economy, the self-reinforcing effect produces extreme results. Extremely small cities will lead to low utility of the labour force, which will in turn cause the migration of the labour force and the disappearance of the cities. Therefore, small cities hinder industrial agglomeration. Meanwhile, large cities have substantial inflow of labour, and the agglomeration effect can further improve urban productivity, leading to large-scale labour force and industrial agglomeration (Coll-Martínez, Citation2019; Wang & Wei, Citation2016; Zhou & Liu, Citation2019).
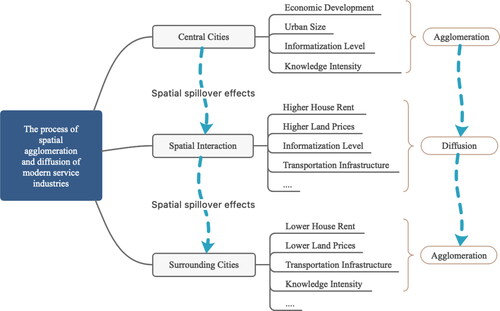
Existing empirical studies have concluded that economic development, informatisation level, knowledge intensity, and urban size promote the agglomeration of modern service industries in central cities. However, the descriptive analysis of the characteristics of modern service industries in in the present study shows that, with the rapid economic and social development of the YRD city cluster in recent years, modern service industries not only show obvious agglomeration, but also decreasing agglomeration in some industries. This phenomenon has previously been observed in developed countries (Groshen & Robertson, Citation1993), mainly due to high land rents and labour prices. The study argues that, with the improvement of the construction of city groups, the connection between cities is getting closer. With the continuous improvement of transportation infrastructure and information technology, some industries that do not depend on better office locations are relocating from the central cities to surrounding areas, which is a new phenomenon explored in the present study. This process of change is shown in .
Figure 3. Spatial agglomeration and diffusion of modern service industries.
Source: Made by author.
4. Methodology
4.1. Selection of variables
We now investigate the feasibility of the theoretical analysis from the spatial interaction perspective and introduce geographical location into the proposed model. Therefore, spatial measurement method was selected for the empirical test. Based on the analysis in Section 3, four factors—economic development level, informatisation level, knowledge intensity, and urban size—were chosen as the core explanatory variables. In addition, three variables—industrial structure, transportation infrastructure, and level of opening to the outside world—were employed as control variables based on the results of other studies. To reduce the influence of singular values after collinearity and matrixing, the natural logarithm was taken for all independent variables. The specific measures for each variable are as follows:
4.1.1. Agglomeration degree
In this study, the explained variable is the number of workers in the modern service industry and it measures the agglomeration degree of the industry. This variable is denoted by MSIi,t, which represents the number of workers in the modern service industry in region i in year t. Given that the research object is the overall modern service industry rather than individual sub-industries, the spatial Gini coefficient in Section 2 cannot be used directly. The panel data of the number of employees in the modern service industry can be used to reflect the modern service industry in a region from the two dimensions of time and space.
4.1.2. Economic development level
This study uses GDP per capita to measure the level of economic development. This is denoted by PGDPi,t, which is the GDP per capita in area i in year t. Economic development can often be measured by indicators such as GDP, national income, national income per capita, and economic growth rate. This study uses GDP per capita to reflect the relative size of the regional economy and the level of regional economic development.
4.1.3. Informatisation level
The number of mobile phone users is used to measure the level of informatisation—this is denoted as NMPi,t, which is the number of mobile phone users in area i in year t. In the past 10 years, China’s information construction has mainly focused on digitalisation. Given the rapid development of the new generation of information infrastructure, various new services and formats focused on mobile phones are constantly being developed. As of 2019, the number of mobile phone users in China exceeded 1.6 billion and continues to develop rapidly. Therefore, the number of mobile phone users can substantially reflect China’s informatisation level over the past decade.
4.1.4. Knowledge intensity
This study uses the number of students enrolled in colleges and universities to measure knowledge intensity, denoted as NSUi,t, which represents the number of these students in area i in year t. Knowledge intensity can be evaluated using indicators such as human resource input, R&D input, and industrial knowledge output. Given that the modern service industry is knowledge-intensive, the workers are required to have a high intellectual level and advanced abilities in science, technology, and management. Hence, the number of students in colleges and universities can directly represent the skill level in society, thereby reflecting knowledge intensity.
4.1.5. Urban size
The study utilises the size of the permanent resident population to measure the size of a city; this is denoted by RPi,t, which represents the size of the resident population in area i in year t. Given the impact of the household registration policies of many cities in the YRD city group, the permanent resident population can better reflect urban size compared to the household registration records.
4.1.6. Industrial structure
The proportion of secondary industry in the GDP is used to measure the industrial structure, denoted by PSIi,t, which is the proportion of the secondary industry in the GDP in area i in year t. According to Clark’s law, the industrial structure can be measured by the proportion of non-agricultural output(Clark, Citation1965). With the global development of the ‘service economy’, the ratio of the output value of the tertiary industry to that of the secondary industry can indicate the industrial structure. Given that the explained variable in the current study is the number of employees in the modern service industry, the proportion of secondary industry in the GDP is selected to measure the industrial structure, thereby avoiding endogeneity problems. An increase in this proportion means that the development of the service industry is hindered, and the expected sign of the relationship between the two is negative.
4.1.7. Transportation infrastructure
Highway mileage is used to measure transportation infrastructure, denoted by HMi,t, which represents the highway mileage in area i in year t. The current research adopts the spatial interaction perspective to focus on the transportation relationship between cities. Therefore, the common indicators of urban transportation infrastructure—such as road construction area, public transportation coverage, and rail transit construction mileage—are not suitable for this study. Hence, highway mileage was selected for the measurement.
4.1.8. Level of opening up
The proportion of actual utilised foreign capital in GDP is used to measure the level of opening to the outside world, denoted by AFCi,t, which represents the proportion of actual utilised foreign capital in GDP in area i in year t.
4.2. Data collection and model specification
This study selects a spatial measurement method for empirical testing. We use panel data of 41 cities at the prefectural level and above in the YRD city group. Although Shanghai is directly governed by the central government, this is only a political status and the city retains an urban scale in terms of geographical units; therefore, Shanghai should be considered a city rather than a province. The original data are mainly sourced from local statistical yearbooks and the China City Statistical Yearbook (Citation2019). Some missing data were smoothed.
In terms of model selection, based on the test procedure described by Anselin et al. (Citation2008) and Elhorst (Citation2014), the current study first conducts a Lagrange multiplier test and selects the spatial econometric model based on the test results (see ).
Table 2. Results of Lagrange multiplier test.
In , R2 = 0.9821, and the degree of fitting is relatively good. The estimated value LMρ of the spatial lag model (SLM) and the estimated value LMλ of the spatial error model (SEM) reject the original hypothesis that the model does not have spatial lag and spatial error terms at the 1% significance level. This result proves that the spatial correlation between the observations is significant. However, the robust LMρ is determined to be more significant than LMλ at the 1% significance level. Moreover, the t-value is high. Therefore, the spatial lag model should be selected to analyse the agglomeration of the modern service industry in the YRD city group.
The spatial lag model is as follows:
(2)
(2)
(3)
(3)
(4)
(4)
(5)
(5)
(6)
(6)
where i, j = 1, 2,…, N cities; t = 1, 2,…, t years;
represents the explained variable in the t-th year in the ith city;
represents the explanatory variable in the t-th year in the i-th city, and is expressed by formula (3);
represents the individual specific effect in the t-th year in the i-th city, where
represents the spatial-specific effect,
represents the time-specific effect,
is the regression coefficient of the spatial lag term, and
refers to the spatial weight matrix between the i-th and j-th cities.
is the distance inverse weighting matrix,
is the spatial weight matrix between city i and city j. This study determines the spatial weight matrix of the model using the binary spatial adjacency matrix, according to the geographic coordinates of the 41 cities. Moreover, this research assumes that the spatial weight matrix does not change with time t;
are parameters to be estimated;
represents the error term for the t-th year in i-th city; and
The treatment of individual specific effects is generally divided into fixed and random effects according to whether
and
are related. Through the Hausman test for the spatial lag model (see ), the P value of the result was determined to be above 0.05. Thus, the null hypothesis is accepted. Meanwhile,
is considered a random variable with a mean of 0 and variance of
and is added to the model. Based on the preceding analysis, the spatial lag model of individual random effects is eventually selected for this empirical study.
Table 3. Result of Hausman test for spatial lag model.
5. Results
5.1. Model result
This study uses the estimation results of the factors influencing the modern service industry to further conduct spatially decompose the results of each influencing factor. shows the model results, and presents the results of the effect decomposition.
Table 4. Result of spatial lag model estimation of random effects.
Table 5. Result of random effects decomposition of spatial lag model.
According to the estimated results in , all explanatory variables passed the significance test, except for the proportion of actual utilised foreign investment in GDP (). The lagged dependent variable is significant at the 1% significance level, and the coefficient is positive. This result reflects the existence of circular cumulative causality owing to ‘path dependence’ during the agglomeration of the service industry.
Among the explanatory variables, GDP per capita (), number of students in colleges and universities (
), and size of permanent population (
) are significant at the 1% level, and their coefficients are positive. This result proves that an improvement in economic development level and knowledge intensity, along with the continuous expansion of the urban size, are conducive to the agglomeration of the modern service industry, consistent with the existing research. Although some scholars found a non-linear relationship between urban size and service industry agglomeration, the author believed this non-linear relationship to exist only in Central and Western China. The urban size in the eastern region and the service industry’s agglomeration maintains a long-term stable linear relationship. This result is consistent with that of the current research. Professional and technical talent are the most important factors affecting the externalisation trend of the service industry (Beyers & Lindahl, Citation1996); moreover, the diffusion of technology and the improvement of learning and innovation capabilities are important factors for generating dynamic agglomeration economies (Malmberg, Citation1996). This explains why the regression coefficient of knowledge density in the empirical results is positive and significant at the 1% significance level. Moreover, the direct, indirect, and total effects of these three variables were positive and significant. That is, economic growth, an increase in knowledge density, and urban size expansion in the local and surrounding areas are conducive to the agglomeration of local modern service industries. This result proves that the spatial economic and knowledge spillover effects of city groups in the YRD are greater than the polarisation effect. In addition, the increase in the number of local college students and permanent residents in this city group may not be caused by a decrease in the population size in neighbouring areas, but by the net inflow of advanced talent and population from Central and Western China. This may also be the reason for the positive direct, indirect, and total effects of the three variables.
In addition, the number of mobile phone users () and highway mileage (
) are significant at the 1% significance level, and the proportion of the secondary industry in the GDP (
) is significant at the 5% level. However, the regression coefficients of the three variables are negative. The direct, indirect, and total effects of the three variables are also negative. Among them, the regression coefficient of
is negative, consistent with the expected results. However, it is generally believed that service industry agglomeration aims to achieve the sharing of transportation, communication, and other infrastructure to obtain agglomeration benefits. Thus, the negative regression coefficients of the number of mobile phone users (
) and highway mileage (
) appears contrary to common sense and existing research. For instance, Hong and Fu (Citation2008) used Chinese data in 2004 to prove that the more extensive the information technology, the higher the industrial spatial agglomeration. However, some studies believe that advancements in information technology eliminate the need for employees to gather in the same place, and industries tend to be decentralised rather than agglomerated (Quah, Citation2011). In particular, the emergence of network technology has made economic development considerably decentralised. Against this background, the miniaturisation and decentralisation of enterprises makes them substantially flexible and spatially decentralised. This phenomenon can be explained from the perspective of corporate behaviour. Corporate transaction costs are the main driving force for enterprises to choose industrial agglomerations (Scott & Cooke, Citation1988). Enterprises will participate in industrial agglomeration spontaneously according to their respective benefits and seek a low-cost spatial layout. An improvement in the information technology level will promote the ‘virtual agglomeration’ of modern service enterprises. Moreover, in the YRD city group, land rents in the central areas of municipalities such as Shanghai, Nanjing, Hangzhou, and Hefei, are extremely different from the surrounding areas. Under the combined effects of the two, enterprises will choose to spread to the surrounding areas of central cities to minimize cost and obtain higher benefits. In recent years, China’s information infrastructure construction and continuous improvement of its information technology have provided modern service enterprises in the YRD city group with additional choices in terms of spatial location. This explains the negative correlation between the modern service industry and information technology level.
Similarly, the complex technical content of the modern service industry and huge regional differences in land rent in the YRD city group can explain the negative correlation between highway mileage () and modern service industry agglomeration. The ‘iceberg’ theory of new economic geography indicates that transportation cost is an important factor to ensure industrial agglomeration. Given that an increase in highway mileage will objectively reduce transportation costs, industrial agglomeration should be promoted. However, the modern service industry differs from the traditional manufacturing industry. The majority of products in the former are ‘intangible products’ produced through information (Lee & Lee, Citation2020). An increase in highway mileage does not directly reduce the transportation costs of the modern service industry. Instead, such an increase in mileage will enable enterprises to spread to places with cheap land rent. These aspects are a result of the diseconomies of scale that arise from the excessive agglomeration of services. Moreover, advanced transportation infrastructure will relatively reduce the degree of urban concentration, hindering the agglomeration of the modern service industry. This phenomenon also demonstrates that the agglomeration and diffusion of the service industry are relative and undergo continuous transformation and movement.
Similar conclusions have been drawn from the practical development of the YRD city group in recent years. In 2016, the Ministry of Housing and Urban–Rural Development, National Development and Reform Commission, and Ministry of Finance jointly issued a notice to develop characteristic towns nationwide. In particular, the key areas included business and logistics, modern manufacturing, educational technology, traditional culture, and leisure tourism. As of the end of 2018, the YRD city group had 69 characteristic towns, and nearly every city had its own characteristic towns. Among them, the ‘Fund Town’ and ‘Science-Innovation Town’ in Shanghai, the ‘Information-Economy Town’ and ‘Finance Town’ in Hangzhou, and the ‘Culture Town’ and ‘Cultural-Innovation Town’ in Nanjing are all typical modern service industry towns, where the industry has spread out from the urban area to the surrounding areas. However, note that the research object in this study is the YRD city group, which is the most developed region in China. Other regions in China and the YRD city group have evident differences in terms of information technology level, transportation infrastructure, and land rent. According to the existing literature, the relationship between the informatisation level, transportation infrastructure, and agglomeration of modern service industries in the central and western regions remains positively correlated. Therefore, the agglomeration of the modern service industry may be affected by land rent in the urban centre, and there may be a nonlinear relationship between agglomeration and the information technology level and transportation infrastructure, which needs further study.
Lastly, the proportion of actual utilised foreign capital in the GDP () has a positive but insignificant effect on the agglomeration of the modern service industry. This result may be because the actual utilised foreign capital in the YRD city group mainly flows into the manufacturing industry. However, this research does not obtain specific data on the actual utilised foreign capital invested in the modern service industry.
5.2. Robustness test
In order to test whether an improved informatisation level will negatively affect industrial agglomeration and to estimate the reliability of the results, this study selects Internet users()instead of mobile phone users(
)to denote informatisation level. In addition, this study also uses technology spending (LN_TS) to replace the number of students in colleges and universities (LN_NSU) to express knowledge intensity. The new model is suitable for the fixed effect spatial lag model after the Lagrange and Hausman tests. The review results are presented in —although the estimated coefficients of the core explanatory variables are different from the previous regression results, the positive and negative effects and significance do not change, indicating that the conclusion of this study remains valid and confirming the robustness of the model results.
Table 6. Result of robustness test.
6. Discussion
This study uses the panel data of 41 cities at the prefectural level and above in the Yangtze River Delta city group from 2008 to 2018 to explore the factors influencing the modern service industry’s agglomeration, based on the spatial lag model of random effects.
6.1. Theoretical implications
The spatial Gini coefficients reveal that leasing and business services have the highest spatial concentration while education has the lowest, and there is an agglomeration–diffusion–aggregation phenomenon in the city group. Moreover, the use of the spatial measurement method shows that local economic development level, knowledge intensity, and urban size have a significant positive impact on the agglomeration of the modern service industry, as well as a significant spatial spillover effect on the surrounding areas. Information technology level, transportation infrastructure, and the proportion of the secondary industry have a significant negative impact on the modern service industry and the surrounding areas. This phenomenon may be due to the joint action of the strong information technology dependence of the modern service industry, and the huge regional differences in land rent in the YRD city group. This shows that the agglomeration of the modern service industry undergoes continuous transformation and movement together with diffusion. Future analysis and research can examine the linear or nonlinear relationships and explore whether the modern service industry constantly exists in the state of diffusion or experiences agglomeration and diffusion under the joint action of information technology, transportation infrastructure, and land rent. .
6.2. Practical implications
Based on the theoretical implications, as developing countries such as China gradually enter the ‘service economy’ society, the reasonable and effective promotion of the modern service industry’s agglomeration can provide a long-term and stable driving force for national economic growth. This study finds that the spatial knowledge spillover effects of city groups in the YRD are greater than the polarisation effect. Therefore, in terms of policy implementation, the government should actively implement the strategies of ‘rejuvenating the country through science and education’ and ‘strengthening the country through talents’, give preference to the education industry in fiscal policy, and formulate a special plan to attract local professional and technical talent. Hence, talent should be trained internally and attracted externally, human capital must be strengthened, and the agglomeration of the modern service industry should be strengthened. This study also finds that even though the continuous expansion of urban size is conducive to the agglomeration of the modern service industry, the industry may migrate from a big city to the surrounding areas. Compared with large cities, small and medium-sized cities should continue to expand their size, while large cities should build new service industry functional areas through reasonable planning and improve public services and other regional policies to avoid the problem of diseconomies in urban centres. By realising coordinated regional development, the modern service industry can be encouraged to agglomerate in small and medium-sized cities or in the surrounding areas of large cities. By doing so, a modern city group with a reasonable spatial structure and layout can be formed.
Disclosure statement
No potential conflict of interest was reported by the author(s).
Additional information
Funding
References
- Anselin, L., Le Gallo, J., & Jayet, H. (2008). Spatial panel econometrics. In L. Mátyás and P. Sevestre (Eds.), The econometrics of panel data (pp. 625–660). Springer.
- Beyers, W. B., & Lindahl, D. P. (1996). Explaining the demand for producer services: Is cost-driven externalization the major factor? Papers in Regional Science, 75(3), 351–374. https://doi.org/10.1007/BF02406758
- Boix-Domenech, R., & Soler-Marco, V. (2017). Creative service industries and regional productivity. Papers in Regional Science, 96(2), 261–279. https://doi.org/10.1111/pirs.12187
- Cao, Y., Jiang, Z., Ye, S., Wu, W., & Liang, S. (2019). Spatial pattern and heterogeneity of port and shipping service enterprises in the Yangtze River Delta, 2002–2016. Chinese Geographical Science, 29(3), 474–487. https://doi.org/10.1007/s11769-019-1035-1
- Chen, J., Chen, G., & Huang, J. (2009). Study on producer services agglomeration and its influencing factors from the perspective of new economic geography—Empirical evidence from 222 cities in China. Journal of Management World, 4, 83–95.
- Chen, M., Long, H., Wang, C., Huang, J., & Niu, F. (2017). Review of and prospects for China’s human and economic geography. Journal of Geographical Sciences, 27(12), 1556–1576. https://doi.org/10.1007/s11442-017-1452-y
- Chung, T., & Tseng, C. (2019). The knowledge intensity and the economic performance in Taiwan’s knowledge intensity business services. Economic Research-Ekonomska Istraživanja, 32(1), 797–811. https://doi.org/10.1080/1331677X.2019.1583586
- Clark, C. (1965). National income and outlay. Routledge.
- Coll-Martínez, E. (2019). Creativity and the city: Testing the attenuation of agglomeration economies in Barcelona. Journal of Cultural Economics, 43(3), 365–395. https://doi.org/10.1007/s10824-019-09340-9
- Elhorst, J. P. (2014). Spatial econometrics from cross-sectional data to spatial panels (pp. 50–99). Springer.
- Fujita, M., Krugman, P. R., & Venables, A. (1999). The spatial economy: Cities, regions, and international trade (pp. 283–285). MIT Press.
- Goto, H., & Minamimura, K. (2019). Geography and demography: New economic geography with endogenous fertility. The Japanese Economic Review, 70(4), 537–568. https://doi.org/10.1111/jere.12213
- Groshen, E. L., & Robertson, L. (1993). Are the Great Lakes cities becoming service centers? Economic Commentary (Federal Reserve Bank of Cleveland)), 1–6. https://doi.org/10.26509/frbc-ec-19930601
- Hong, J., & Fu, S. (2008). Information and communication technologies and geographic concentration of manufacturing industries: Evidence from China. https://doi.org/10.2139/ssrn.1104652
- Illeris, S. (1996). The service economy: A geographical approach (pp. 111–143). Wiley.
- Keeble, D., & Nachum, L. (2002). Why do business service firms cluster? Small consultancies, clustering and decentralization in London and southern England. Transactions of the Institute of British Geographers, 27(1), 67–90. https://doi.org/10.1111/1475-5661.00042
- Kim, Y. R., Williams, A. M., Park, S., & Chen, J. L. (2021). Spatial spillovers of agglomeration economies and productivity in the tourism industry: The case of the UK. Tourism Management, 82, 104201. https://doi.org/10.1016/j.tourman.2020.104201
- Krugman, P. (1991). Increasing returns and economic geography. Journal of Political Economy, 99(3), 483–499. https://doi.org/10.1086/261763
- Kuchiki, A. (2021). Sequencing Economics’ on the ICT industry agglomeration for economic integration. Economies, 9(1), 2. https://doi.org/10.3390/economies9010002
- Lee, S. M., & Lee, D. (2020). ‘Untact’: A new customer service strategy in the digital age. Service Business, 14(1), 1–22. https://doi.org/10.1007/s11628-019-00408-2
- Li, B. (2017). The interaction of clusters between manufacturing and producer services in China. Economic Research-Ekonomska Istraživanja, 30(1), 1427–1442. https://doi.org/10.1080/1331677X.2017.1355253
- Liu, D., Chen, G. S., & Zhi, D. (2019). Do extensive producer services promote manufacturing agglomeration? Evidence from territorial servitisation in Northeast China. Economic Research-Ekonomska Istraživanja, 32(1), 3773–3794. https://doi.org/10.1080/1331677X.2019.1674178
- Malmberg, A. (1996). Industrial geography: Agglomeration and local milieu. Progress in Human Geography, 20(3), 392–403. https://doi.org/10.1177/030913259602000307
- Malmberg, A., Malmberg, B., & Lundequist, P. (2000). Agglomeration and firm performance: Economies of scale, localisation, and urbanisation among Swedish export firms. Environment and Planning A: Economy and Space, 32(2), 305–321. https://doi.org/10.1068/a31202
- Markusen, A. (1996). Sticky places in slippery space: A typology of industrial districts. Economic Geography, 72(3), 293–313. https://doi.org/10.2307/144402
- Marshall, A., & Marshall, M. P. (1920). The economics of industry. Macmillan and Company.
- Martinez-Galarraga, J., Paluzie, E., Pons, J., Silvestre, J., & Tirado, D. A. (2021). New economic geography and economic history: A survey of recent contributions through the lens of the Spanish industrialization process. Cliometrica, 15(3), 719–751. https://doi.org/10.1007/s11698-020-00214-1
- Mun, S. I., & Hutchinson, B. G. (1995). Empirical analysis of office rent and agglomeration economies: A case study of Toronto. Journal of Regional Science, 35(3), 437–456. https://doi.org/10.1111/j.1467-9787.1995.tb01413.x
- National Bureau of Statistics of China. (2019). China city statistical yearbook 2019. https://db.cei.cn/
- Perroux, F. (1950). Economic space: Theory and applications. The Quarterly Journal of Economics, 64(1), 89–104. https://doi.org/10.2307/1881960
- Quah, D. (2011). The global economy’s shifting centre of gravity. Global Policy, 2(1), 3–9. https://doi.org/10.1111/j.1758-5899.2010.00066.x
- Rabellotti, R. (1997). External economies and cooperation in Italy and Mexico. In External economies and cooperation in Industrial districts (pp. 133–165). Palgrave MacMillan.
- Ren, Y., & Qiu, B. (2010). Analysis on spatial clustering characteristics of modern service industry—A case study of Hunan Province. Economic Geography, 03, 104–109. https://doi.org/10.15957/j.cnki.jjdl.2010.03.027
- Scott, A. J., & Cooke, P. (1988). The new geography and sociology of production. Environment and Planning D: Society and Space, 6(3), 241–244. https://doi.org/10.1068/d060241
- Shao, S., Tian, Z., & Yang, L. (2017). High speed rail and urban service industry agglomeration: Evidence from China’s Yangtze River Delta region. Journal of Transport Geography, 64, 174–183. https://doi.org/10.1016/j.jtrangeo.2017.08.019
- Shi, X., Wu, Y., & Zhao, D. (2014). Knowledge intensive business services and their impact on innovation in China. Service Business, 8(4), 479–498. https://doi.org/10.1007/s11628-013-0202-1
- Smętkowski, M. D., Celińska-Janowicz, D., & Wojnar, K. (2021). Location patterns of advanced producer service firms in Warsaw: A tale of agglomeration in the era of creativity. Cities, 108, 102937. , https://doi.org/10.1016/j.cities.2020.102937
- Tang, R., & Xiu, P. (2021). The modern service industry agglomeration and tourism efficiency in China: Regional difference and influencing mechanism. Journal of the Asia Pacific Economy, 1–20.
- The State Council of the People’s Republic of China. (2008). Guidelines on accelerating the development of the service industry. http://www.jstor.org/stable/41345988
- Thisse, J. (2011). Geographical economics: A historical perspective. Recherches Économiques de Louvain, 77(2), 141–168. https://doi.org/10.3917/rel.772.0141
- Wang, P., & Wei, C. (2016). Study on the mutual spatial effect between urbanization and service industry agglomeration: Empirical analysis based on Chinese provincial panel data. International Conference on Industrial Economics System and Industrial Security Engineering (IEIS), (pp. 1–5). Sydney: IEEE, 24–27 July 2016. https://doi.org/10.1109/IEIS.2016.7551877
- Wu, D., Tong, X., Liu, L., & Wang, J. (2021). Do regional financial resources affect the concentration of high-end service industries in Chinese cities? Finance Research Letters, 42, 101935. https://doi.org/10.1016/j.frl.2021.101935
- Xi, Q., Sun, R., & Mei, L. (2021). The impact of special economic zones on producer services productivity: Evidence from China. China Economic Review, 65, 101558. https://doi.org/10.1016/j.chieco.2020.101558
- Xie, M., Zhao, H., Zhu, N., & Xie, G. (2015). Characteristics and causes of spatial agglomeration of tertiary industry in Zhejiang Province. Economic Geography, 09, 98–104. https://doi.org/10.15957/j.cnki.jjdl.2015.09.013
- Yang, H., Lu, F., & Zhang, F. (2020). Exploring the effect of producer services agglomeration on China’s energy efficiency under environmental constraints. Journal of Cleaner Production, 263, 121320. https://doi.org/10.1016/j.jclepro.2020.121320
- Yeh, A. G. O., Yang, F. F., & Xu, Z. (2017). Will rural urbanization produce a new producer service space in China? Habitat International, 67, 105–117. https://doi.org/10.1016/j.habitatint.2017.07.004
- Zhou, G., & Liu, W. (2019). Study on the relationship between urbanization and tertiary industry in Hubei Province. In J. Hung, N. Yen, & L. Hui (Eds.), Lecture notes in electrical engineering (Vol. 542, pp. 997–1006). Springer. https://doi.org/10.1007/978-981-13-3648-5_126
- Zhou, R., Zhang, Y., & Gao, X. (2021). The spatial interaction effect of environmental regulation on urban innovation capacity: Empirical evidence from China. International Journal of Environmental Research and Public Health, 18(9), 4470. https://doi.org/10.3390/ijerph18094470