
 ?Mathematical formulae have been encoded as MathML and are displayed in this HTML version using MathJax in order to improve their display. Uncheck the box to turn MathJax off. This feature requires Javascript. Click on a formula to zoom.
Abstract
Football players’ wages are, in most clubs, the largest share of expenses and one of the most important incentives to keep players motivated. How are football players encouraged to constantly improve their performance and what is the effect of good performances on wages? Are wage spreads within teams being set to motivate players, as in a rank-order tournament? Using accurate data from Portuguese First League football player wages, we study the relationship between wages and players’ performance. Using minutes, number of games and performance statistics during the season as a proxy for players’ performance, we show that players who play more minutes earn a wage prize and those at the top face a convex relationship suggesting the setup of a tournament within football teams.
1. Introduction
In the last 20 years, football clubs have become more than simple sport organizations. Clubs have been transformed into large companies with high revenues associated to the increase of ticket prices, transfer fees, broadcasting and prize moneys. The European football market reached €28.9 billion in 2018/2019 and without the covid-19 pandemic, it was expected to keep growing in the coming years (Deloitte, Citation2020).
The participation in Union of European Football Associations (UEFA) competitions, especially the Champions League, is one of the objectives of the top teams in Europe due to the impact on revenues (Pawlowski et al., Citation2010). However, professional clubs can be seen as a community service (Sloane, Citation1971) and profit may not always be the main goal, it is crucial to ensure good management results in order to guarantee club sustainability. According to Deloitte, (Citation2020) wage costs represents around 60% of clubs revenue, therefore the management of players’ wages is crucial to ensure good financial results and sport managers face a challenge to keep players motivated and fans happy.
The Financial Fair Play concept of UEFA (UEFA, Citation2009) require clubs to manage rigorously their assets to maintain access to competitions organized by UEFA. Clubs’ management should seek to ensure the efficient use resources (Franck & Nüesch, Citation2011; Ribeiro & Lima, Citation2012), knowing that clubs’ performance depends mainly on players’ effort and that their wages represent the main cost component. We may question the rationale of this wage policy when taking into account UEFA’s requested sustainability.
The sports labour market analysis, that lead us to the 50 s with Rottenberg’s (Citation1956) study on players’ market and industry organization of baseball competitive balance, offers an opportunity to study issues related with incentives and human capital accumulation. Clubs’ success is the outcome of teamwork where each player’s contribution is difficult to quantify – the production function is non-separable (Alchian & Demsetz, Citation1972). Even if the final score is highly dependent on forwards and the goal scorers, club success rests ultimately on team performance. One may question if there is a difference between marginal productivities that can explain such pay dispersion. Annala and Winfree (Citation2011) found that team inequality is negatively related with field performance in Major League Baseball aligned with the findings of Bose et al. (Citation2010) that the perception of unfair payments within teams can lead to sabotage in the working groups. Sport managers seek the best results and for that need to reward their players the best way to encourage them and avoid team conflicts.
Rewarding players, and determine their wages it is a crucial issue to sports organizations and has been studied in several sports over the last decades (Ashworth & Heyndels, Citation2007; Barajas & Rodríguez, Citation2010; Bryson et al., Citation2013; Kahn, Citation2000). If clubs define wage policies to elicit effort as in a rank-order tournament (Lazear & Rosen, Citation1981; Rosen, Citation1986), then wages should increase more than proportionally with performance for top players – the wage-performance profile should be convex. In this context, our main objective is to study if, when we take the performance distribution and translate it into the wage distribution, the outcome is consistent with the tournament theory, recognising explicitly the discrete nature of the pay structure within football teams.
This paper represents an important advance compared with previous studies of wage determination since we use reliable data on players’ wages coming from an official national database. We consider all the main variables present in the extant literature, like games played during the season (Lucifora & Simmons, Citation2003; Thrane, Citation2019); season performance (Thrane, Citation2019); goals (Bryson et al., Citation2013; Frick, Citation2011) and shots per game (Franck & Nüesch, Citation2012); and we also include the minutes played by each player during the season (Auer & Hiller, Citation2015). Consequently, this research makes possible to clubs managers understand how ably they are rewarding their workers and succeed to increase revenue spending efficiency. Just around 40% of players stay more than one year in each team (Ribeiro & Lima, Citation2019; Weimar & Scharfenkamp, Citation2019) and there is no public information about the share of contracts that are negotiated each year. Therefore, we are not determining the effect of players’ performance on new contracts, new wages or even wage bonus.
Players’ and clubs’ information comes from a matched employer-employer matched data set. We use players’ statistics from 2016 to 2017 and 2017 to 2018 seasons of Portuguese First League as proxy for players’ performance: minutes played; number of games played; goals; man of the match prize; average passes per game and ratings.
In the next section, we review the literature on tournaments, explaining the mechanism design behind this incentive device. In the third section, we describe the First League competition context in Portugal, present the data set and discuss the variables’ definition. We detail our empirical framework in the fourth section and present the results in the fifth section. Section six concludes.
2. Tournaments
The seminal paper by Lazear and Rosen (Citation1981) show how a rank-order tournament is superior to piece rates in settings where the individual contribution (performance) is difficult to observe without error. Assume that workers are risk neutral and that their output is the combination of effort and a random component (luck or a constant ability factor). The worker’s effort has a cost that is positive and increasing with the level of effort. The firm can implement a compensation scheme based on piece rates, where the wage is equal to the value of each worker’s (marginal) contribution to production. The pay scheme is optimal in a competitive environment, but the firm needs to observe each individual contribution. Even when production is additively separable and only uses labour, firms cannot distinguish the random component from the effort each worker puts into production. The complexity of firms’ decision increases when production is not separable (Alchian & Demsetz, Citation1972) – the outcome of joint production where workers are complements. Consider the alternative of setting a prize structure that awards the highest prize to the worker with the largest realization of performance. In this case, the firm only has to observe the rank order of individual performance. The largest the spread between the winning and losing prize, the higher the worker’s incentive to invest in effort. The cost of effort is increasing at a rising rate, limiting the spread in equilibrium.
Rosen (Citation1986) extends the original model to games with sequential stages and more than two workers to compare. The progression to the top is associated with an increasing wage rise – an increasing wage spread between hierarchical ranks. The mechanism design of the tournament rests on the incentive provided by the future interrank prize spreads that the worker can win by climbing to higher ranks. At the top, the prize has to be disproportionally higher to compensate the disincentive effect of no more ranks to climb – it acts as extending the horizon of the game for the winner of the last round. Increasing effort becomes more difficult for workers, not only by the convexity of the cost of effort function, but also due to performance also becoming less sensible to players’ effort. Rosen (Citation1986) defines a performance function – a response function to effort – that can be considered concave to high values of effort (decreasing marginal productivity). Both effects – convex cost function and concave performance function – act to decrease the level of effort. Again, the spread between successive ranks has to increase, contributing to the convexity of the compensation structure.
In addition to Rosen (Citation1986), a large set of papers on tournament (e.g. Carmichael, Citation1983; Eriksson, Citation1999; Eriksson et al., Citation2009) theory followed the seminal paper by Lazear and Rosen (Citation1981).
Football clubs can observe each player’s performance but cannot quantify the marginal contribution of all players to the final outcome given the joint production nature of the game. The solution is to order players by performance and set a rank-order tournament. Moreover, top players are decisive to the outcome of a football match, as in a pyramidal hierarchy where top managers decisions have a higher impact on firm’s performance than decisions taken at the bottom. It implies that the compensation is each rank contributes to induce effort to win a position in that rank, but also has incentive effects to all ranks bellow, explaining the concentration of compensation at the top players, as is typical in higher leagues. Under this discussion, tournaments within football teams will convert a continuous distribution of performance into a discrete distribution of compensation, a high non-linear transformation (Lazear & Rosen, Citation1981; Rosen, Citation1986). Our first objective is to study this transformation – the image of performance at the wage space – and test if it is consistent with tournament theory.
The optimal spread increases with the value of production (Lazear & Rosen, Citation1981). Thus, we should expect to find larger wage spreads within teams belonging to richer leagues. Furthermore, the level of the prize only matters for the decision to enter the game, a possible explanation on why entry wages at first league football teams are relatively higher when compared with entry wages in other industries. In addition, Lazear and Rosen (Citation1981) show that the existence of different ability workers will undermine the efficiency of the rank order tournament at the initial stage. The solution is to impose an entry barrier based on player’s performance. In football, first league players have first to demonstrate their quality in inferior or junior leagues. The same argument can be made for first leagues competitions in countries with different maturity levels. Rosen (Citation1986) arrives to the same result as the marginal effect of effort on the probability of winning is decreasing in the players’ heterogeneity. As players climb the prize ladder, the set of winners in each rank becomes more homogeneous, ‘the survival of the fittest’ (Rosen, Citation1986).
A number of authors tested several implications of tournament theory in sports industries. Ehrenberg and Bognanno (Citation1990) use data from professional golf tournaments and find that larger prize gaps induce higher effort. Similar effects are observed by Fornwagner (Citation2019) in National Hockey League (NHL), Rosenqvist (Citation2019) in golf tournaments and Humphreys and Frick (Citation2019) in the National Association for Stock Car Racing (NASCAR) racing. The estimation of compensation functions in sports has also been the subject of research with diverse objectives. Scully (Citation1974) estimate wage equations for baseball players, along with marginal revenue products to discuss the effect of restrictions to the functioning of the labour market. Idson and Kahane (Citation2000) study the relationship between team attributes and players’ compensation. Among numerous studies on discrimination (for the US market), Kahn and Shah (Citation2005) estimates wage equations for the National Basketball Association (NBA) players. Reviews on the particular economics of sports can be found at Khan (2000), Rosen and Sanderson (Citation2001), Siegfried and Sanderson (Citation2006), Sloane (Citation2006) and Frick (Citation2007). Wicker et al. (Citation2012) studied the impact of several factors in the income of non-professionalised sports elite athletes.
Lucifora and Simmons (Citation2003) find evidence of the Rosen’s (Citation1981) superstar effect in the case of the season 1995–1996 Italian professional league players. The authors find a convex relationship between pay and performance measures such as goal-scoring rates. Rosen (Citation1981) contended on the inequality of earnings distribution in professional sports among other industries characterized by individual performance. The rewards function exhibits a convexity that amplifies even small differences in talent. The presence of scale economies and talent scarcity (along with poor substitution between talent levels) in sports, particularly in football, with large and global audiences to the top leagues and competitions, explains such high concentration of pay on few players and of revenues on a small number of clubs.
Rosen’s superstar effect offers an additional reason for the wage convexity. It explains the high pay level for those players who outstand in a game, such as forwards and goal-scorers. It does not, however, fully explain the provision of incentives prevalent in the football industry for all players. Franck and Nüesch (Citation2012) are exemplary in analysing the Rosen’s superstar effect. The authors’ setup allows distinguishing talent (Rosen, Citation1981) from popularity (Adler, Citation1985) in German football premier league, relying on the idea of capturing popularity by the residuals from regressing player’s press citation on his performance indicators. The main result comes from a players’ market value (not wages) equation estimated at the 95% percentile by quantile regressions and using performance measures such as goal-scoring and career.
The issue of performance measurement and talent identification in football has been subject to various approaches. For example: Franck and Nüesch (Citation2012) use 20 performance indicators, along with team performance and popularity measures (derived from press citations); Reilly et al. (Citation2000) and Mohr et al. (Citation2003) offer examples from a sports sciences perspective; Duch et al. (Citation2010) attempt to quantify individual contribution to team performance in football using a network approach; Hiller (Citation2015) and Auer and Hiller (Citation2015) propose a new game-theoretical approach to measure the importance of players.
Our study is closer to Lucifora and Simmons (Citation2003) and Franck and Nüesch (Citation2012) studies on tournaments, however we focus on the wage policy within clubs and use a comprehensive proxy to measure of player’s performance covering several studies of Bryson et al. (Citation2013); Frick (Citation2011); Franck and Nüesch, (Citation2012) and more recently Thrane (Citation2019) in a single one with accurate and reliable data on players’ wages.
3. Data and variables’ definition
We use data from the Portuguese First League with players’ and clubs’ information for the 2016–2017 and 2017–2018 seasons. The players’ demographics and wages come from a matched employer-employee dataset – the Quadros de Pessoal (QP) survey collected yearly by the Portuguese government. The QP survey is a mandatory administrative census of Portuguese employers and it has been used in research since the late eighties in a diversified range of applied fields, predominantly on labour. Recent examples include Distel et al. (Citation2019) and Baptista et al. (Citation2020). An average of more than 350 000 employers covering more than three million workers answered the survey each year, including football clubs. October is the reference month for data collection. Therefore, it is impossible to know if the club paid some prize to the player during the season, or at the end, to reward individual or team performances. We are able to identify undoubtedly 10 different clubs, out of the 16 First League clubs, and 377 players, an average of almost 20 players for each club. There is no evidence of sample selection, if we compare players under analysis with players left outside due to missing information in the QP data set.
We have clubs that occupied all kinds of positions in the table, from champions to relegated clubs and we cover an average of 80% of the total minutes played during the entire season. There may be several reasons for non-observed players: players hired in January; loan players who are not part of club’s staff; or players who could not be identified due to missing records. The QP provides information on players’ wage (monthly salary and regular benefits), age, schooling and tenure. We match the QP information with official clubs statistics for minutes played, games played, goals, position in the field by each player during the season (Liga Portuguesa de Futebol Profissional, Citation2016, Citation2017) and other performance statistics from whoscored.com. The QP information is confidential, so we cannot disclose players’ identification.
We use minutes played during the season to capture each player’s contribution to the team. The variable can be considered a proxy for performance, assuming that players who have been chosen more often by the coach are the ones performing better within the season. Elite players are more tolerant to fatigue and have more aerobic power (Reilly et al., Citation2000) and coaches use the best performers more frequently (Mohr et al., Citation2003), therefore best players are more likely to play more minutes during the season. There are other characteristics and statistics used to measure football players’ performance, and we use and test them; however the common characteristic for all 11 players who start the game is that they can play 90 minutes each game, providing a simple and consistent proxy for performance and that does not depend on player’s position in the field. The maximum number of minutes that a player can participate throughout the season is 3060 (34 games x 90 minutes). The number of identified players per club ranges from 15 to 26 since we only consider in our model those players who played at least one minute.
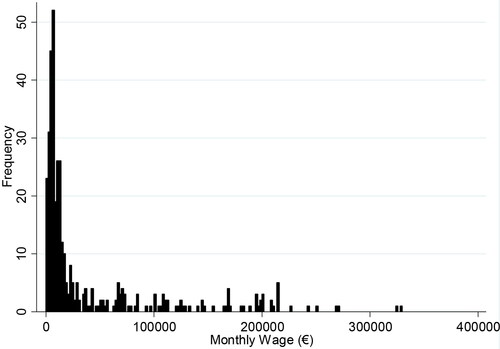
shows wage distribution in the 2016–2018 seasons. The average monthly wage is 41108 Euros per month and the median wage is less than 11752 Euros. The wage distribution is skewed, and the highest wage is almost nine times the average wage. There are clubs where the maximum wage is more than 50 times the value of minimum wage in the same club indicating a wide pay scale.
Figure 1. Monthly wage distribution, 2016–2017 until 2018–2019 seasons.
Source: Staff and Portuguese Football League Professional.
As in , shows that there is evidence of a wide pay scale: players at the 90% percentile receive 46.9 times the wage of those at the 10% percentile; players at the 50% percentile receive 3.79 times the wage of those at the 10%. For minutes played, the figures are 15.38 and 7.49 for the 90/10 and 50/10 ratios. Thus, the wage dispersion is much wider than the corresponding distribution of minutes played, suggesting a convex wage-performance relationship, at least at the upper part of the wage distribution.
Table 1. The wage distribution, 2016–2017 until 2018–2019 seasons.
Player statistics () shows that players’ age ranges from 16 to 38 years old with a 26 average. Age captures industry-specific human capital as most players start the professional (or semi-professional) career at roughly the same age, between 16 and 19 years old. Tenure captures club-specific human capital, though its accumulation seems modest as almost half of players (46.4%) are new hires.
Table 2. Players’ descriptive statistics, 2016–2017 until 2018–2019 seasons.
Schooling captures general human capital. We define dummy for schooling around twelve years of completed enrolment – the compulsory level after 2012 (nine years before): 45% hold at maximum nine years, 52% hold twelve years and just nine players have a college degree.
The average number of minutes played is 1355 with a standard deviation of 925. We gather players into four different groups of minutes played and define a dummy for each group. We aggregate all players who played less than 10% of total minutes possible in the season in the first group: players who almost never play, on average, unless at the last couple of minutes in few games during the season. In the next group are those who play between 10% and 70% of minutes during the season: players typically used by the coach during the game but if the result is not the expected they will be the first to leave the field, probably because they are the coach’s second choice. The following group includes players who play between 70% and 90%: players who are regularly the first choice for the coach, but for several reasons (injuries, discipline, technical) they do not play more than 90% of the possible minutes. The last group cover players who play more than 90%: the best players of the team. They play almost all games as first option and finish the majority of the started games.
Near 17% of players play 10% or less. Typically, there are more than 25 players in each club and at most 14 players play in each game, implying that a significant number of players have a small contribution to the club’s season. The distribution of players across the remaining groups resembles a pyramid: 55% (for the 10–70% group), 21% (70–90% group) and 6% (> 90% group). We also identify those players who played during the season international matches by their country (22.5%), those who were new hires (46%), foreign players (51.5%) and also the field position of the player.
The correlation matrix for the variables used shows that most correlations between control variables and groups of performance variables are within a reasonable range, indicating that we do not face a serious problem of possible collinearity among the variables that could reduce the precision of the estimates. We also performed the VIF’s to test collinearity issues and all values are lower than 4 to all models.
4. Methodology
We content that football clubs device a wage policy resembling the rank-order tournament proposed by Rosen (Citation1986). The club commits to prizes for the winner and the loser, where the winner is the player who produces more, and the two prizes are independent of the difference between the absolute levels of the outputs. The spread – difference between the winning and losing prizes – serves as an incentive for effort. The equilibrium spread generates efficient effort levels and only requires an ordinal ranking of the players. In this setting, players’ wages rise more than proportionally with successful effort, originating a convex wage curve.
We start by defining a standard wage equation where the player’s wage in logarithm is a (linear) function of his individual attributes, such as various forms of human capital (Becker, Citation1975):
(1)
(1)
where schooling and new player are vectors of dummy variables; age is a vector for age and performance is a vector for the variable used to measure the player performance; club is a vector of dummies for each club and ε is the error term. The schooling dummies are defined for less than twelve years of schooling, twelve years and college degree. New player is defined by 0 if the player was already in the club in the previous season and equals to 1 if it is a new hire. Age is defined as a continuous variable. We include dummies for each club to capture fixed effects that could influence wages in each club and that are not observable to the researcher (Idson & Kahane, Citation2000).
The total minutes in each season is fixed: defined by the 90 minutes of each game times 34 games of each season. Therefore, minutes played can be considered a measure of relative performance – those players used more often are the ones who perform better – and overall independent of player position. We specify a cubic function on minutes played, which seems flexible enough to capture possible non-linearities. If we observe that wages rise with minutes, but at a decreasing rate (decreasing marginal productivity within a match and within the season), it will originate first a concave wage-minutes relationship. However, if a tournament is set for the best players, we expect wages to rise at an increasing rate for those players intensively used within the season, originating a convex wage-minutes relationship at higher wages. Even though a cubic function is a flexible polynomial, it still is linear in its parameters. As an alternative specification, we use the defined set of dummies for minutes: 10% or less, 10–70%, 70–90%, more than 90%.
Rosen (Citation1986) suggests that the progression across sequential stages of the tournament could be modelled with a Poisson, as in a patent rate, for example. Such count model assumes a port of entry at the bottom pay rank. In football teams, we do not expect to observe such a rigid use of ports of entry, apart from junior players entering the profession. Furthermore, players' mobility between clubs suggests that we cannot think of a strict sequence of stages within a team. To further address these issues and not adhere strictly to a linear model as wage EquationEq. (1)(1)
(1) we also define an ordered logit model, a discrete model in line with the Lazear and Rosen (Citation1981) and Rosen (Citation1986) argument that tournaments transform a continuous distribution of performance into a discrete distribution of pay.
We divided the continuum of wages within each team into four equal size ranks with 25% of players in each rank. We could use any pyramidal pay distribution, but the particular form is arbitrary, not defined a priori as with job levels inside a firm or elimination rounds in a golf tournament. The equal size distribution is the least disrupting – it offers a lower bond and will probably underestimate the coefficients. Consider the probability of a given observed wage rank Q = j, j = 1,…,4, within the team for each player defined as
(2)
(2)
where
is a vector of regressors defined as in EquationEq. (1)
(1)
(1) ,
is the vector of coefficients to be estimated and
the cut points with
and
If the error term u follows the logistic distribution, then EquationEq. (2)
(2)
(2) can be written as
(2’)
(2’)
and can be estimated by maximum likelihood. We present the results by computing the marginal effects.
We could also use a quantile regression (Koenker & Bassett, Citation1978). However, it continues to be a linear model, tough more flexible than the regression to the mean used to estimate EquationEq. (1)(1)
(1) . In addition, contrary to the ordered logit model in EquationEq. (2)
(2)
(2) , it does not allow to explicitly consider the player’s relative rank within his team. These reasons, coupled with the limited number of observation available, preclude the use of the quantile regression model.
To further extend our results, we do not limit the analysis to minutes as a proxy for performance to test the presence tournament within teams. We consider additional players’ variables as proxies for performance as: games played during the season (Lucifora & Simmons, Citation2003; Thrane, Citation2019); season performance (Thrane, Citation2019); goals (Bryson et al., Citation2013; Frick, Citation2011), and we also had new variables such as: number of times the player was awarded as man of the match; and the number of average passes by game. The number of games played and minutes came from official statistics and the other variables are collected from whoscored.com. As we stated before, we link this data with reliable data on players’ wages.
5. Results
We start to estimate the wage EquationEq. (1)(1)
(1) by least squares with four different specifications presented in . The first specification (Model I) includes only the control variables. The second (Model II) adds minutes played. Model III considers the cubic function for minutes played. Model IV considers the wage estimation with the dummies for minutes played.
Table 3. Wage equations for football players.
Schooling is not significant in the first model and has a positive effect on wages in the other three models, significant at a 10% level. New hires earn on average more, between 0.285 and 0.3 log points, comparing to players who are playing, at least, the second season in the club. Age and age squared are significant in all models and the coefficients peak at 33 years old, near the probable maximum player’s productivity. We also control for players positions occupied in the game. It is very different to be a goalkeeper or a forward, and therefore, we control for this. We can observe that when we consider minutes as a proxy for performance the coefficient for Defenders is negative and for Forwards is positive, not significant in some models. The coefficient for Midfielders is not significant in all models. All positions can take as important role in the game and in the final result and we can capture that by measuring the number of minutes each player stays in the game field.
Model III shows the cubic function for minutes played. All minute’s coefficients are significant, and we can observe a convex shape in line with tournaments theory.
Model IV presents the wage estimation with the dummies for minutes played (<10%, 10–70%, 70–90%, >90%) instead of the cubic function. The estimated coefficients for the minutes played dummies are all significant at the 1% level. The positive and increasing coefficients confirm the positive wage-minutes played relationship found in Model II with the continuous specification. Concerning the specific form of that relationship, there is a high wage change for those who play 10 to 70% during the season (0.398 log points) and 70 to 90% (0.507 log points). The last group of players, in the more than 90% of utilization, experience a wage change of 0.634 log points. Given the different ranges for percentage time intervals, the results for the top players suggest that they receive disproportionally higher wages.
Next, and to validate our previous results, we estimate the ordered logit in EquationEq. (2)(2)
(2) , defining wage quartiles within each club. We define the vector of regressors as in Model IV: age, new hire dummy, schooling, minutes played, position in the field and club fixed-effects. presents the results. For each time category, the marginal probability of being in each wage quartile increases with minutes played. Across time categories, the more minutes played, the higher the probability of being in a top quartile. For example, the change in the probability of being in the fourth quartile is 9.8 percentage points (p.p.) for range 10–70% of time played, 17.0 p.p. for 70–90%, and then jumps to 25.1 p.p. for more than 90% of season time (when compared with those least used, <10%). For the first (bottom) quartile, the probability changes from −11.8 p.p. for those less used (10–70%) to −22.1 for the most used players.
Table 4. Ordered logit for wage quartiles, marginal effects.
Table 5. Wage equations for football players, Heckman selection model.
Across quartile, the vector of marginal effects for the less used (10–70% of playing time) ranges from −11.8 in the first quartile to 9.8 p.p. in the fourth quartile; and from −22.1 to 25.1 p.p. for the most used (>90%). The gradient defined by the coefficients of each time category becomes stepper across quartiles as we move towards the best players. The results from the ordered model seem to confirm the claim that clubs set a rank-order tournament among players such that the wage-performance relationship is positive and convex – wages raise disproportionately for the top performers within each team.
When we use as dependent variable the difference between the (log) wage of a player and the (log) wage of the least paid player of each team in the linear regression, the results are similar. We also explore variations to the pool of players included in the linear and in the ordered logistic models. We first considered only players who played at least 10% of total minutes possible in one season (270 minutes). In a second variation, we remove just the 10% players who played less in each team. In both cases, the results are similar to those presented in and .
We proceed with several types of wage EquationEq. (1)(1)
(1) using the Heckman selection model (Heckman, Citation1979), where we apply players position in the field, age and foreign dummy as variables for the selection equation, with different specifications of performance. The Heckman correction model is used in order to correct some non-random effect of the sample. We follow the several variables used by Thrane (Citation2019), Battré et al. (Citation2009) and Bryson et al. (Citation2013). Our models VI to XVII bring up the several combinations of variables that do not represent high correlation between them, for this reason we do not mix all variables in just one model. For instance, we did not gather variables ‘goals’ and ‘man of the match’ since they are highly correlated and therefore, we can expect biased and non-significant coefficients. The coefficient for the number of times a player is considered the man of the match, Model VII, is quite high which is in line with what we could predict. The best players, the ones who perform better, earn more. The coefficient for individual average performance measure (Rating) during the season has the highest value but we constant is not significant (Model X). Models XI until XVIII have all coefficients significant, except average passes per game in model XVII. All the coefficients and models prove that sweat pays off. Those who perform better, earn more. The Heckman correction models results are very similar to the results of , what reinforces the evidence of non-existence of sample selection.
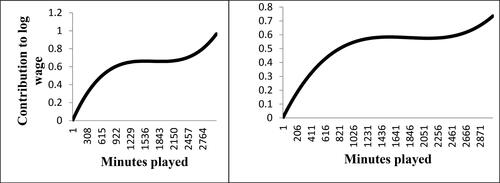
First, it shows that players who play more minutes earn more at the end of the month, controlling for age, tenure, schooling and club fixed effects. Second, the function is concave until around 1300 minutes played, corresponding to 40% of the season total. After that point, the function is relatively flat, but still positively inclined until around 65% of minutes played (2000 minutes). For more than 65% of minutes played, wages rise again, but at an increasing rate – the wage-minutes played relationship becomes convex.
Minutes played by each player in the season exhibit a cubic relationship with wages: the three coefficients are significant in all models. The quadratic term has a negative coefficient and the cubic term a positive one. presents the implied relationship with wages (coefficients from Model III and model VI).
Figure 2. Minutes contribution to log wage (estimated coefficients from model III, and model VI, ).
Source: Staff and Portuguese Football League Professional.
6. Discussion and conclusions
We analyse the wage-performance relationship for the case of professional football players. In particular, we test if the transformation of players’ performance distribution into the wage distribution is consistent with the tournament theory. This assessment is an important tool for clubs’ managers rethink the wage policy. The observation that extremely high wages exert a disproportionate pressure on clubs’ financial structure, raising sustainability issues in the Portuguese First League and in other European leagues triggered our research questions. Even if a club can recover the money invested in the player by selling him to another club, the value of the transfer is contingent on player’s performance. We also study the possible influence of different kinds of human capital on wages.
Our results ascertain that general (schooling) human capital do not play a significant role on wage formation. Industry-specific human capital – players’ age – seems to be a determinant of wages. The shape of the wage-age relationship follows the expected concave profile. For ages reaching the maximum variation on wages, around the early thirties, when players are expected to be near their maximum productivity, the relationship becomes negative.
Using minutes played within the season as a proxy for performance, the estimation result shows that players who play more minutes earn higher wages and those at the top of the effort distribution face a convex relationship – the size of the difference in the pay rank increases as the contestants approach the top. In football, the players are encouraged to push hard in training in order to be called to participate in the game. We also tested several performance variables, and they help to explain wages.
Our empirical setting, though based solely on two seasons, those that have all the data available that we used, provides clues for future research. We aim to extend the analysis to consider players’ and clubs’ longitudinal information to further test the tournament theory. Namely, we can ascertain how much of the concentration of wages at the top is explained by the star effect, as well as previous performances, as opposed to tournament incentives. Moreover, given the observed high mobility of players along their career path, we intend to analyse the wage-career profile under different explanations. Following players’ careers across several seasons will allow studying issues like the club-player matching process or the extent to which clubs’ learning about players’ quality is reflected on wages (Farber & Gibbons, Citation1996).
Although we use precise data of players’ wages and performance metrics there will always be limitations regarding the performance analysis. It is not consensual players’ performance measure in literature and among sport managers and sports economists. Our papers aims to provide a new approach, using real and precise data, and grouping several variables used by some renamed researchers.
Our study opens doors to further research regarding wage policy inside sport organizations and the set-up of prize schemes that could reward even more those who perform significantly better than other teammates.
Acknowledgements
We are thankful to the Portuguese Ministry of Labour and Social Solidarity and to Statistics Portugal for giving us access to the data used in this research. The views expressed in this article are those of the authors and do not necessarily reflect the official views of authors' institutions.
Disclosure statement
No potential conflict of interest was reported by the authors.
References
- Adler, M. (1985). Stardom and talent. American Economic Review, 75, 208–212.
- Alchian, A. A., & Demsetz, H. (1972). Production, information costs, and economic organization. American Economic Review, 62, 777–795.
- Annala, C. N., & Winfree, J. (2011). Salary distribution and team performance in major league baseball. Sport Management Review, 14(2), 167–175. https://doi.org/10.1016/j.smr.2010.08.002
- Ashworth, J., & Heyndels, B. (2007). Selection bias and peer effects in team sports: The effect of age grouping on earnings of German soccer players. Journal of Sports Economics, 8(4), 355–377. https://doi.org/10.1177/1527002506287695
- Auer, B. R., & Hiller, T. (2015). On the evaluation of soccer players: A comparison of a new game-theoretical approach to classic performance measures. Applied Economics Letters, 22(14), 1100–1107. https://doi.org/10.1080/13504851.2015.1005809
- Baptista, R., Karaöz, M., & Leitão, J. C. (2020). Diversification by young, small firms: The role of pre-entry resources and entry mistakes. Small Business Economics, 55(1), 103–122. https://doi.org/10.1007/s11187-019-00142-z
- Barajas, Á., & Rodríguez, P. (2010). Spanish football clubs' finances: Crisis and player salaries. International Journal of Sport Finance, 5(1), 52.
- Battré, M., Deutscher, C., & Frick, B. (2009). Salary Determination in the German “Bundesliga”: A Panel Study. University of Paderborn, Department of Management.
- Becker, G. S. (1975). Human capital (2nd ed.). National Bureau of Economic Research.
- Bose, A., Pal, D., & Sappington, D. (2010). Equal pay for unequal work: Limiting sabotage in teams. Journal of Economics & Management Strategy, 19(1), 25–53. https://doi.org/10.1111/j.1530-9134.2009.00244.x
- Bryson, A., Frick, B., & Simmons, R. (2013). The returns to scarce talent: Footedness and player remuneration in European soccer. Journal of Sports Economics, 14(6), 606–628. https://doi.org/10.1177/1527002511435118
- Carmichael, H. L. (1983). The agent–agents problem: Payment by relative output. Journal of Labor Economics, 1(1), 50–65. https://doi.org/10.1086/298004
- Deloitte. (2020). Home truths—Annual review of football finance 2020. Retreived November 23, 2021 from https://www2.deloitte.com/uk/en/pages/sports-business-group/articles/annual-review-of-football-finance.html.
- Distel, A. P., Sofka, W., de Faria, P., Preto, M. T., & Ribeiro, A. S. (2019). Dynamic capabilities for hire—How former host-country entrepreneurs as MNC subsidiary managers affect performance. Journal of International Business Studies, 1–32. https://doi.org/10.1057/s41267-019-00274-0
- Duch, J., Waitzman, J. S., & Amaral, L. A. N. (2010). Quantifying the performance of individual players in a team activity. PLoS One, 5(6), e10937. https://doi.org/10.1371/journal.pone.0010937
- Ehrenberg, R. G., & Bognanno, M. L. (1990). Do tournaments have incentive effects? Journal of Political Economy, 98(6), 1307–1324. https://doi.org/10.1086/261736
- Eriksson, T. (1999). Executive compensation and tournament theory: Empirical tests on Danish data. Journal of Labor Economics, 17(2), 262–280. https://doi.org/10.1086/209920
- Eriksson, T., Teyssier, S., & Villeval, M.-C. (2009). Self-selection and the efficiency of tournaments. Economic Inquiry, 47(3), 530–554. https://doi.org/10.1111/j.1465-7295.2007.00094.x
- Farber, H. S., & Gibbons, R. (1996). Learning and wage dynamics. The Quarterly Journal of Economics, 111(4), 1007–1047. https://doi.org/10.2307/2946706
- Fornwagner, H. (2019). Incentives to lose revisited: The NHL and its tournament incentives. Journal of Economic Psychology, 75, 102088. https://doi.org/10.1016/j.joep.2018.07.004
- Franck, E., & Nüesch, S. (2011). The effect of wage dispersion on team outcome and the way team outcome is produced. Applied Economics, 43(23), 3037–3049. https://doi.org/10.1080/00036840903427224
- Franck, E., & Nüesch, S. (2012). Talent and/or popularity: What does it take to be a superstar? Economic Inquiry, 50(1), 202–216. https://doi.org/10.1111/j.1465-7295.2010.00360.x
- Frick, B. (2007). The football playersʼ labor market: Empirical evidence from the Major European Leagues. Scottish Journal of Political Economy, 54(3), 422–446. https://doi.org/10.1111/j.1467-9485.2007.00423.x
- Frick, B. (2011). Performance, salaries, and contract length: Empirical evidence from German soccer. International Journal of Sport Finance, 6, 87–118.
- Heckman, J. J. (1979). Sample selection bias as a specification error. Econometrica, 47(1), 153–161. https://doi.org/10.2307/1912352
- Hiller, T. (2015). The importance of players in teams of the German Bundesliga in the season 2012/2013—A cooperative game theory approach. Applied Economics Letters, 22(4), 324–329. https://doi.org/10.1080/13504851.2014.941527
- Humphreys, B., & Frick, B. (2019). Prize structure and performance: Evidence from NASCAR. Economies, 7(4), 102. https://doi.org/10.3390/economies7040102
- Idson, T., & Kahane, L. (2000). Team effects on compensation: An application to salary determination in the National Hockey League. Economic Inquiry, 38(2), 345–357. https://doi.org/10.1111/j.1465-7295.2000.tb00022.x
- Kahn, L. M. (2000). The sports business as a labor market laboratory. Journal of Economic Perspectives, 14(3), 75–94. https://doi.org/10.1257/jep.14.3.75
- Kahn, L. M., & Shah, M. (2005). Race, compensation and contract length in the NBA: 2001–2002. Industrial Relations, 44(3), 444–462. https://doi.org/10.1111/j.0019-8676.2005.00394.x
- Koenker, R., & Bassett, G. (1978). Quantile regression. Econometrica, 46(1), 33–50. [Database] https://doi.org/10.2307/1913643
- Lazear, E., & Rosen, S. (1981). Rank-order tournaments as optimum labor contracts. Journal of Political Economy, 89(5), 841–864. https://doi.org/10.1086/261010
- Liga Portuguesa de Futebol Profissional. (2016). Game reports. Retreived November 23, 2021 from https://www.ligaportugal.pt/pt/liga/estatisticas/jogadores/minutos/20162017/liganos
- Liga Portuguesa de Futebol Profissional. (2017). Game reports. Retreived November 23, 2021 from https://www.ligaportugal.pt/pt/liga/estatisticas/jogadores/minutos/20172018/liganos
- Lucifora, C., & Simmons, R. (2003). Superstar effects in sport: Evidence from Italian soccer. Journal of Sports Economics, 4(1), 35–55. https://doi.org/10.1177/1527002502239657
- Mohr, M., Krustrup, P., & Bangsbo, J. (2003). Match performance of high-standard soccer players with special reference to development of fatigue. Journal of Sports Sciences, 21(7), 519–528. https://doi.org/10.1080/0264041031000071182
- Pawlowski, T., Breuer, C., & Hovemann, A. (2010). Top clubsʼ performance and the competitive situation in European domestic football competitions. Journal of Sports Economics, 11(2), 186–202. https://doi.org/10.1177/1527002510363100
- Reilly, T., Williams, A. M., Nevill, A., & Franks, A. (2000). A multidisciplinary approach to talent identification in soccer. Journal of Sports Sciences, 18(9), 695–702. https://doi.org/10.1080/02640410050120078
- Ribeiro, A. S., & Lima, F. (2012). Portuguese football league efficiency and players’ wages. Applied Economics Letters, 19(6), 599–602. https://doi.org/10.1080/13504851.2011.591719
- Ribeiro, A. S., & Lima, F. (2019). Football players’ career and wage profiles. Applied Economics, 51(1), 76–87. https://doi.org/10.1080/00036846.2018.1494375
- Rosen, S. (1981). The economics of superstars. American Economic Review, 71, 845–858.
- Rosen, S. (1986). Prizes and incentives in elimination tournaments. American Economic Review, 76, 701–715.
- Rosen, S., & Sanderson, A. (2001). Labour markets in professional sports. Economic Journal, 111, 47–68.
- Rosenqvist, O. (2019). Are the most competitive men more resilient to failures than the most competitive women? Evidence from professional golf tournaments. Social Science Quarterly, 100(3), 578–591. https://doi.org/10.1111/ssqu.12606
- Rottenberg, S. (1956). The baseball player’s labor market. Journal of Political Economy, 64(3), 242–258. https://doi.org/10.1086/257790
- Scully, G. W. (1974). Pay and performance in Major League Baseball. American Economic Review, 64(6), 915–930.
- Siegfried, J., & Sanderson, A. (2006). Simon Rottenberg and baseball, then and now: A fiftieth anniversary retrospective. Journal of Political Economy, 114, 594–605.
- Sloane, P. (1971). The economics of professional football: The football club as a utility maximiser. Scottish Journal of Political Economy, 18(2), 121–146. https://doi.org/10.1111/j.1467-9485.1971.tb00979.x
- Sloane, P. J. (2006). Rottenberg and the economics of sport after 50 years: An evaluation. IZA Discussion Paper No. 2175, Available at SSRN: https://ssrn.com/abstract=918719
- Thrane, C. (2019). Performance and actual pay in Norwegian soccer. Journal of Sports Economics, 20(8), 1051–1065. https://doi.org/10.1177/1527002519851146
- UEFA (2009). UEFA executive committee Nyon decisions. 101. Retreived November 23, 2021 from http://www.uefa.com/MultimediaFiles/Download/PressRelease/uefa/UEFAMedia/88/67/81/886781_DOWNLOAD.pdf
- Weimar, D., & Scharfenkamp, K. (2019). Effort reduction of employer-to-employer changers: Empirical evidence from football. Managerial and Decision Economics, 40(3), 277–291. https://doi.org/10.1002/mde.3001
- Wicker, P., Breuer, C., & Hanau, T. (2012). Understanding the income determinants of German elite athletes in non-professionalised sports. International Journal of Sport Management and Marketing, 11(1/2), 26–43. https://doi.org/10.1504/IJSMM.2012.045486