
 ?Mathematical formulae have been encoded as MathML and are displayed in this HTML version using MathJax in order to improve their display. Uncheck the box to turn MathJax off. This feature requires Javascript. Click on a formula to zoom.
Abstract
There is a growing body of economic literature focusing on the negative health effect of air pollution. This paper performs a data-driven analysis of 844 economic publications on air pollution and health in the last three decades. We provide a novel way to visualize the research patterns and features, including the numerical analysis, collaboration network analysis at macro-meso-micro levels, keyword co-occurrence network analysis, and co-citation connection analysis. Additionally, the comparison with the topic dendrogram in environmental science is supplemented to seek the potential research direction. The results reveal that the entire field is now experiencing the rapid development. United States has not only published the largest number of articles, but has also established the most extensive collaborations with other countries. Besides, there have developed a couple of stable cooperative teams consisting of the leading authors. Research topics are gradually leaning toward the developing countries, and research contents are turning to psychological health. More types of air pollutants are worthy of analysis in the future.
1. Introduction
As air pollution has become one of the most important issues worldwide, its impact on public health has also received extensive attention for a long time. Both short-term and long-term exposure to air pollution will lead to a series of respiratory and cardiovascular diseases (Götschi et al., Citation2008; Horne et al., Citation2018; Rajagopalan et al., Citation2018), and even interfere in the functioning of the reproductive system and endocrine system (Iavicoli et al., Citation2009; Mohallem et al., Citation2005).
The link from air pollution to health in the field of economics has also been investigated in many studies. The contents of this area show the diversified characteristics from multiple aspects. On the one hand, the types of air pollutants discussed include particulate matters (PM2.5 or PM10), SO2, NO2, CO, ozone, and greenhouse gas emission (like CO2) (Currie & Walker, Citation2011; Ebenstein et al., Citation2016). Besides the outdoor ambient quality, the indoor air pollution generated by biomass fuels combustion is also widely studied (Grieshop et al., Citation2011; Jeuland et al., Citation2015a). On the other hand, the casual studies cover a various of health effects, such as infant health (Currie, Citation2011), mortality, life expectancy (Chen et al., Citation2013), respiratory diseases like asthma, and cardiovascular diseases (Schlenker & Walker, Citation2016). In addition, the studies tend to extend the health impact to the psychological level, like happiness, life satisfaction, crime, judgement and productivity. Meanwhile, more analysis has been transferred from developed countries to developing countries, like China and India (Greenstone & Hanna, Citation2014; Schreifels et al., Citation2012).
Literature review provides a comprehensive elaboration of the current research, playing a significant role in understanding the performance and frontiers of the development in the field. It not only helps the senior experts to recognize the latest evolution, but also enables the newcomers to quickly grasp the structure and features of the existing scientific articles (Randolph, Citation2009). The traditional review summarizes and evaluates the ideas of the representative publications refined and sorted out by authors themselves (Xie et al., Citation2020), making each review have its own focus. For example, Currie et al. (Citation2014) review the literature associated with both short and long term effects of early-childhood exposure to pollution. Greenstone and Jack (Citation2015) are concerned with the low marginal willingness to pay for environmental quality in developing countries and review the literature for explanations. Jeuland et al. (Citation2015b) review the problem of household air pollution. In addition, due to the inherent incompleteness of the literature collection process, the review performed in the traditional way is likely to be partially biased according to the author’s personal background and profession.
In this paper, we provide a novel way based on the data-driven analysis, namely bibliometric analysis, intuitively visualising the patterns of the economic publications in the air pollution-health area. Compared with the traditional review, bibliometric analysis has the rather advantageous characteristics: Numerical analysis, which integrates the bibliographic information and provides the ranking information from the aspects of authors, journals, cited references, institution, and country; Collaboration network analysis, helps to figure out the international cooperation at national, institutional and author levels; Keyword co-occurrence analysis, along with the clustering technique, indicates the hotspots and frontiers; Co-cited networks at documents and authors present the leading experts and highly cited papers on various topics; Topic dendrogram maps the overall analytical framework in the field.
Bibliometric method has also been used in economics, like Lin and Su (Citation2020), Costa et al. (Citation2019), and Benavides-Velasco et al. (Citation2013). However, there are few efforts on air pollution and health, which is growing popular in environmental economics. Through a set of the analysis procedures, the major contribution of our paper is to explore the global performance, research trends, hotspots and frontiers in the economic studies linking from air pollution to health.
The remainder of the paper is laid out as follows: Section 2 describes the bibliographic data collection process. Section 3 provides the necessary introduction of the methods and softwares we adopt for the bibliometric analysis. Section 4 explains the visualization results comprehensively, including the numerical outputs at journal and country level, collaboration network at macro-meso-micro levels, keyword co-occurrence network, co-citation network of documents and authors, and comparison of the topic dendrogram between economics and environmental science. Section 5 concludes.
2. Data
We collect the bibliographic data from Web of Science (WOS) core collection, that consists of more than 21,100 high-quality peer-reviewed academic journals and covers over 250 disciplines involving science, social sciences, art and humanities.Footnote1 WOS core collection also provides a comprehensive “cover to cover” indexed records, including each paper’s authors, affiliation, country, keywords (or keywords plus), field, and full reference, which allows us to conduct an in-depth analysis of cooperation network, keywords co-occurrence and co-cited connections.Footnote2 In this background, we tailor the searching under its advanced search setting tool.
As shown in , the search query is formulated to connect the two parts of the topics (TS), “air pollution” and “health”, using the basic Boolean operator “AND”. For the “air pollution” part, besides the basic expression, a variety of specific pollutants, like PM2.5, PM10, NO2, SO2, ozone and lead, are also incorporated through the basic operator “OR”.Footnote3 Moreover, topics with “health”, “mortality” or “disease” are added to filter out the “health” related literature. Finally, we obtain 844 English academic publications (articles or reviews) in economic field over the period from 1990 to 2020. The following bibliometric analysis will be conducted based on those derived full records and cited reference.
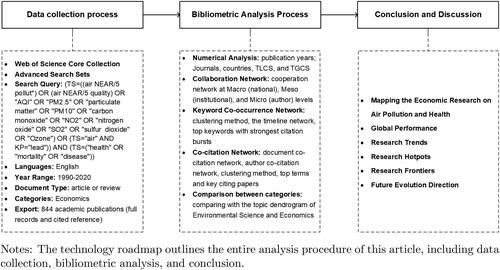
Figure 1. The technology roadmap.
Source: Authors.
3. Methodology and software
3.1. Methodology
This paper aims to present a bibliometric analysis of economic research structure about “air pollution” and “health” in the last three decades. The main methodology consists of five parts: Numerical analysis, that shows the publication trends, the leading journals and the most productive countries, as well as their respective total local citation scores (TLCS) and total global citation scores (TGCS); Collaboration network analysis, that visualizes the co-authorship networks at macro (national), meso (institutional), and micro (author) levels; Keyword co-occurrence networks, along with clustering map and citation burst, are used to demonstrate the knowledge connections among research contents, and detect the paradigm and hotspots in the current field; Co-citation studies include both document and author co-citation networks, help to explore the key citing articles, the highly cited papers, the authoritative scholars, and the research trend; Comparison with the topic dendrogram in Environmental Science, which is the most productive category in “air pollution” and “health”, could be seen as the future evolution direction, providing the scientific basis and new ideas for the economic research.
Through a set of bibliometric analysis mentioned above, we can comprehensively get knowledge of the structure and frontiers in the existing literature. The work not only helps such new scholars, who enter the field for the first time, to quickly grasp the historical development of the topic, but also helps the senior experts to explore the cutting-edge hotspots and generate new ideas.
3.2. Software
In recent years, a series of bibliometric analysis methods, characterized by text mining and visualization, have been widely used to explore the structures and trends of a certain research field. Among them, CiteSpace (5.8.R2 version), developed by Chaomei Chen in the College of Computing and Informatics at Drexel University, and VOSviewer, developed at Leiden University’s Centre for Science and Technology Studies (CWTS), are the two most popular tools (Pan et al., Citation2018). Both of them can intuitively visualize the development status and evolution trends in scientistic publications. In this paper, we combine the advantages of their respective map features and draw a set of the collaboration, co-occurrence, and co-citation network graphs which are discussed in the results section.
In addition, we also adopt HistCite software, whose main function is its statistical analysis of the WOS database. Specifically, HistCite can clearly show the yearly output trend, and quickly list the important documents, the academic experts, the key journals, and the productive countries according to the records and citation scores (Lucio-Arias & Leydesdorff, Citation2008). Besides the main methods introduced above, the Bibliometrix tool is also supplemented in this article for visualizing the topic dendrogram. It is a newly developed R language toolkit for comprehensive science mapping analysis (Aria & Cuccurullo, Citation2017), that supports the study of authors including the affiliations and the countries, documents including the cited references and the keywords, conceptual structure, intellectual structure, and social structure. The following part of this paper will move on to describe in greater detail the settings and applications of the tools listed above.
4. Results
As shown in , the total 844 academic publications including the full records and cited references have till now been collected through the advanced search set under the WOS core collection. Then, we will explain the bibliometric results produced during the aforementioned research process, mapping the global performance and research fronts of the economic literature on air pollution-health area.
4.1. Numerical analysis
We first conduct the numerical analysis mainly through the HistCite software, where the documentation records, TLCS and TGCS are extracted for summarizing the statistics of the yearly output, journals and countries. TLCS is the number of times of one article that has been cited by the references in the local field which are the set we collected related to “air pollution” and “health”. TGCS is the frequency of one article that has been cited by the set in the whole WOS (Chen et al., Citation2017). The former explains more about its popularity in the economic field, while the other highlights its influence in the entire scientific field.
4.1.1. Yearly output
The development of the economic research on “air pollution” and “health” has been shown in , revealing that the number of publications experienced a significant increase from 1990 to 2020. Intuitively, the overall trend could be divided into three phases:
Figure 2. The number of articles published each year.
Source: Authors.
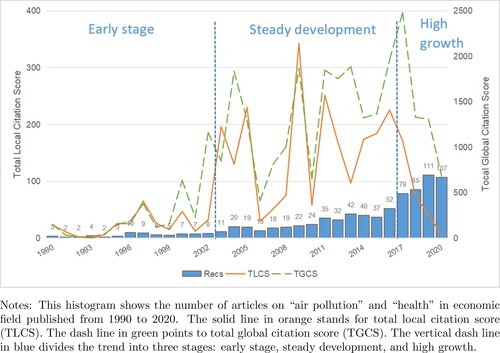
(1) Early stage (1990 to 2002): The annual number of publications is under 10. During that time, the health impact of air pollution had begun to be discussed by a few of scholars in the field of economics. However, limited by the data on air pollutants and health statistics, many studies could not be carried out in large numbers nor in great depth. Thus, the development of the documents is relatively slow, and the influence is also small with both low levels of TLCS and TGCS.
(2) Steady development (2003 to 2016): At this stage, except for some fluctuations, both the number of publications and citations (TLCS and TGCS) have steadily improved to a certain extent compared with those in the last phrase. The number of articles has increased by an average of 18.64% each year. In addition, after a period of accumulation, the air pollution-health topic tends to be mature. Many influential scholars gradually emerge in the field, like Muller NZ, Neidell M, Currie J, Greenstone M, Jones BA, Krupnick A, Brajer V, Zivin JG and so on. It is noted that there are clearly citation bursts in 2004, 2009, and 2011, mainly because of the appearance of several highly cited articles (will be discussed later).
(3) High growth (2017 to present): Since 2017, there has been a rapid growth in the economic studies of air pollution and health. In 2020, 107 articles were published which are 35 times as many as that in 1990, and 4 times that in 2010. However, when looking at the TLCS and TGCS, the influential literature with high citations has constantly decreased due to the insufficient time accumulation and the lack of in-depth explorations.
4.1.2. Journals
We present the most active journals in from three aspects: the ten most-published journals, the ten journals with the largest-TLCS, and the ten journals with the largest-TGCS. It can be seen that Energy Policy published the most literature (135 publications) related to “air pollution” and “health” in the last three decades, followed by Ecological Economics (57 publications), Journal of Environmental Economics and Management (57 publications), and Environmental and Resource Economics (48 publications). Others have 30 or fewer papers in this field.
Figure 3. The top ten active journals.
Source: Authors.
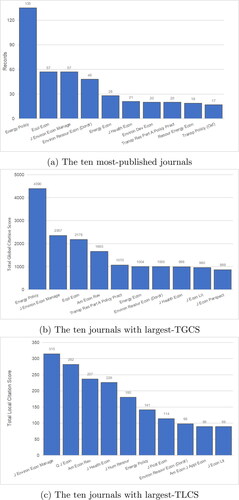
When looking at the TGCS shown in Panel (b) of , it is not surprising that Energy Policy has the most significant number of citations in the entire scientific area because of its quantity advantage. In Panel (c), Journal of Environmental Economics and Management has the largest TLCS, in which the articles like Zivin and Neidell (Citation2009) and Muller and Mendelsohn (Citation2007) have strong citations. Although The Quarterly Journal of Economics has only 2 relevant publications ranked outside the top ten and not shown in , it is also one of the most influential journals in the local field, ranking second in TLCS, mainly due to the high popularity of its two articles, Chay and Greenstone (Citation2003) and Currie and Neidell (Citation2005). A similar situation also occurs in Journal of Health Economics and The American Economic Review, which published relatively fewer papers related to our target topic but those papers have strong citations, such as Currie et al. (Citation2009), Neidell (Citation2004), Graff Zivin and Neidell (Citation2012), and Muller and Mendelsohn (Citation2009).
4.1.3. Countries
lists the top ten productive countries according to the number of publications on “air pollution” and “health” in the economic field over the period from 1990 to 2020. It can be seen that United States published the largest amount of papers regarding the related topic with the number of 419 in total. Besides, United States likewise plays a dominant role among all countries with the largest TLCS and TGCS. PR. China also has a relatively large number of articles, ranking second in both numbers and citations. With the intensification of local air pollution problems, the Chinese scholars have carried out a lot of relevant economic research in recent ten years. Other countries like United Kingdom, which has 74 papers, followed by Germany, Canada, France, Australia, Spain, Netherlands and India, having papers ranging from 41 to 19.
Table 1. The top ten productive countries.
4.1.4. Three-fields plot
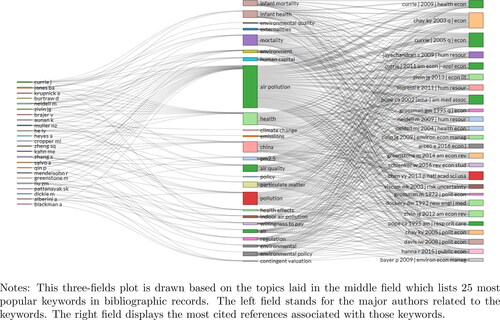
We also draw the three-fields plot () regarding keywords, authors and references with 25 items for each field, intuitively virtualizing the main structure and features related to air pollution-health research in the field of economics. It is important to note that this picture is drawn based on the keywords in the middle area, where the height of blocks represents the number of articles including that keyword, suggesting that the higher the block is, the hotter it has been studied. The left field demonstrates the leading authors whose papers contain that keyword, and the right field lists the corresponding most cited papers. The connecting lines help to identify the internal connections among those three fields.
It is evident that, except for the general keywords of “pollution” and “health”, the main topics include “China”, “mortality”, “infant health”, “particulate matter”, “environmental policy”, “human capital”, “externalities” and “indoor air pollution”, representing the hottest topics in this area. Furthermore, according to the connection line to the relevant authors on the left side, we can find and list the leading authors related to each topic. For example, Aunan K, Krupnick A, Brajer V, Zheng SQ, Kahn ME, Zhang X, and He LY are most interested in the topic of air pollution in China; Currie J, Jones BA, Neidell M and Muller NZ focus on mortality; Currie J, Jones BA, Burtraw D, and Neidell M also put more efforts into infant health; Muller NZ carries out the research based on the particulate matter; Dickie M studies environmental policy; Currie J, Neidell M and Zivin JG evaluate the human capital; Jones BA analyses the externality; Zhang X and Pattanayak SK examine the effect of indoor air pollution. At last, the right field lists the corresponding references with citations indicated by the height of the block. When looking at the whole field, it is clear that Chay and Greenstone (Citation2003) and Currie and Neidell (Citation2005) published in The Quarterly Journal of Economics are highly cited in the air pollution-health area, which again reinforces the above statement.
In summary, this section describes the trend of yearly output, as well as the distribution patterns among journals and countries. Moreover, the three-fields plot has reviewed the three key aspects of keywords, authors and references, that allow us to comprehensively get knowledge of the hottest topics in this field and the outstanding scholars. Besides, it also lists the documents worthy of attention under the corresponding topic. Therefore, the whole numerical analysis enables the scholars in economics, especially for beginners, to quickly grasp the basic structure and characteristics of the air pollution-health literature. The next section of this paper will move on to the collaboration analysis among nations, institutions and authors, which helps to further deepen the understanding of the entire academic network ().
Figure 4. Three-fields plot.
Source: Authors.
4.2. Collaboration analysis
In this section, we provide the three-level studies on collaboration analysis, that is the macro level (country co-authorship), meso level (institutional co-authorship) and the micro level (author co-authorship), intuitively explaining the internal connection structures through the visualized diagrams. Among them, the national collaboration world map is drawn under the Biliometrix toolkit, and institution and author collaboration networks are obtained through VOSViewer software. The specific settings will be introduced separately in the following parts.
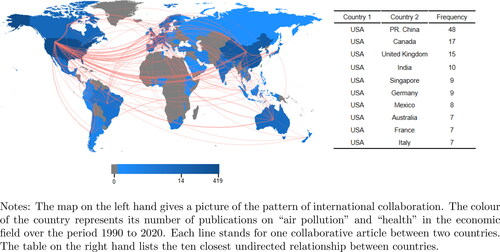
4.2.1. National cooperation network
The national cooperation network can be shown in . The map on the left-hand side presents the geographical distribution of the international collaboration. The depth of the blue colour change is proportional to the number of the national economic publications on air pollution-health, some of which are listed in . It is apparent that United States has the largest amount of papers with the darkest blue. Each connection line represents one collaborative article between two countries. The table on the right-hand side lists the ten closest undirected connections between countries. It is interesting to note that the closest international co-authorship is around the United States extending to different countries. Moreover, United States cooperates most closely with PR. China, followed by Canada, then United Kingdom, India, and Germany.
Figure 5. National cooperation network.
Source: Authors.
4.2.2. Institutional cooperation network
We create the institutional co-authorship network in , which conveys a wealth of information from multiple aspects. Institutions with three or more documents will be displayed as nodes. The larger the circle of the node, the more articles the institution has. We filter out some items that are not connected to each other and thus 134 items are kept out of 149. As for the connection line, we adopt the full counting method that means each co-authorship has the same weight no matter how many institutions are involved in one article.Footnote4 The thicker the line between the two items, the more often they co-authored. The colour of the items represents the year when the institution entered the field, indicated by the bottom legend ranging from 2005 to 2020, that is automatically generated according to the network data.
Figure 6. Institutional cooperation network.
Source: Authors.
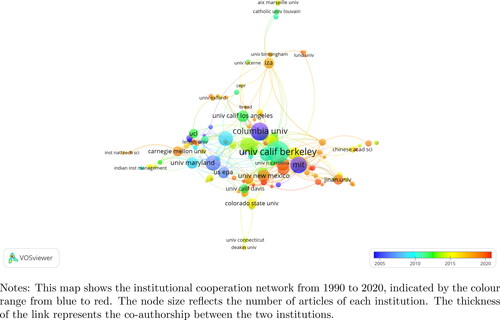
It can be shown that most of the publications and cooperation mainly appear after 2010, which is also consistent with the trend displayed in . The first batch of institutions that started the major research are Columbia University, University of Colorado, world bank and United States Environmental Protection Agency. In addition, it is University of California-Berkeley that published the most documents in the air pollution-health area (the number is 33), followed by Columbia University (the number is 25), and then Massachusetts Institute of Technology (the number is 22). Besides, it is not surprising that University of California-Berkeley also has the strongest total link strength, whose most frequent collaborators contain Cornell University, University of Chicago, and Columbia University.
PR. China is the country that published the second most documents shown in , where Tsinghua University, Peking University, Renmin University of China, and Jinan University are the most active ones in recent years, especially since 2015. In addition to their mutual cooperation, they also connect with other domestic institutions such as Shanghai University of Finance and Economics, Beijing Normal University, and Southwestern University of Finance and Economics. Besides, the foreign institutions with which they cooperate closely include Duke University, University of California-Berkeley, University of Minnesota, National University of Singapore, and International Food Policy Research Institute.
4.2.3. Author cooperation network
The way we construct the author cooperation network is identical to that used for the institutional network above, except for presenting the overall picture additionally. In , all the authors who have published two or more articles are shown in panel (a).Footnote5 It can be seen that there is a certain scale of economic authors in air pollution-health area. Note that there exist many isolated authors having few connection lines with others, most of which are labelled in red. Thus, it can be inferred that many new authors entered this research field and have not yet extended their cooperative network. However, we also find several collaborative groups from the relatively big clusters, suggesting that a couple of stable leading author teams have been formed in this field.
Figure 7. Author cooperation network.
Source: Authors.
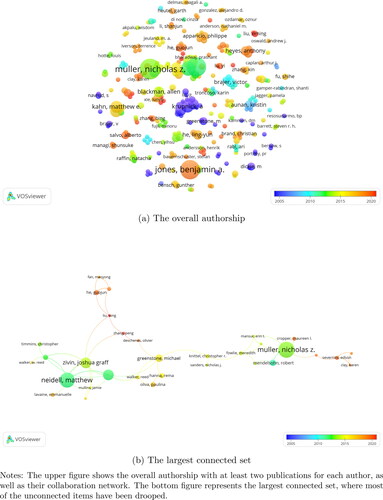
Furthermore, we present the largest set of connected items in Panel (b) that consists of 32 authors. Among them, Neidell M, Currie J, Zivin JG, Muller NZ, Greenstone M and Chay KY have developed the most influential academic teams in air pollution-health area. Besides, there are also some other obvious cooperative relationships, such as those with Muller NZ as the core, Neidell M as the core, Zivin JG as the core, Greenstone M and He GJ as the core.
In this section, we have explained the cooperation network of air pollution-health publications at national, institutional and author levels, respectively. The following section moves on to study the keywords co-occurrence network, that helps to comprehensively understand the main research hotspots, frontiers and trends in this field.
4.3. Keywords co-occurrence network analysis
4.3.1. Keywords co-occurrence network over the three decades
Keywords co-occurrence network is processed through CiteSpace software. After importing the bibliographic data, we set the time span from 1990 to 2020 (slice length = 1), choose the “Keyword” as node type, and decide the selection criteria as “Top 50” (select top 50 of most occurred items from each slice). We also prune the sliced network using the way of Pathfinder so as to avoid the overly scattered branches in the network. In , there are 226 nodes in total with 1597 connections among them. The clustered labels are shown by the log-likelihood ratios algorithm (LLR), which helps to obtain the clusters, especially for those with high intra-class similarity and low inter-class similarity (Lin & Su, Citation2020; Olawumi & Chan, Citation2018). The order of the cluster labels is arranged according to their size, the relative large clusters include wildfire smoke exposure (#0), integrated bioeconomic-health model (#1), North India (#2), external cost (#3), multitasking local bureaucrat (#4), and economic growth (#5).
Figure 8. Keyword co-occurrence network.
Source: Authors.
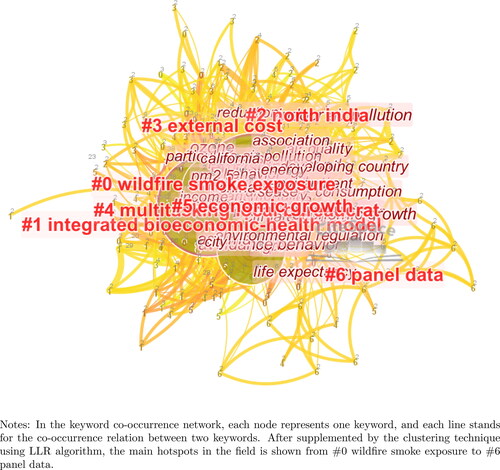
In order to get more information related to those core keywords, we list the mean years and the relevant top terms in . It can be seen from the table that the largest cluster is active around 2010, mainly discussing the topics such as public health, clean air act, pollution dispersion, and emission control, which are also linked to the health effect on birth weight. The second-largest cluster focuses on the use of household energy and analyse the energy policy to help reduce indoor air pollution. The other clusters extend the topics to environmental quality and economic development, as well as sustainability and defensive behaviors.
Table 2. Keywords clusters and top terms.
4.3.2. The timeline network and keywords bursts in recent ten years
The analysis above is based on the entire time period from 1990 to 2020. Considering that there has been a rapid growth in the recent decade and it is more interesting to know the current research frontiers, we construct the timeline network in , addressing the hot topics from 2011 to 2020 Panel (a) demonstrates the six clusters and displays the growing trend of the relevant top terms. It is worth noting that the studies on the integrated bioeconomic-health model, which focuses on the connections among the environmental, social, and ecological flows, have the largest size, that is also consistent with the discussion of that over the whole time period. Besides, the external cost is also one of the most important topics, especially when linking to forest fire and emission exposure mortality. In addition, the indoor pollution issue in North India generated by biomass fuel combustion (like wood, agriculture waste, and dung) has gradually aroused people’s attention. The negative health impact of the cooking stove and the benefit of technology adoption have been largely analysed. Moreover, the most studied diseases associated with air pollution include lung cancer, respiratory diseases, cardiovascular diseases, and infant health problems (like low birth weight, and mortality).
Figure 9. Keyword co-occurrence network in the past ten years.
Source: Authors.
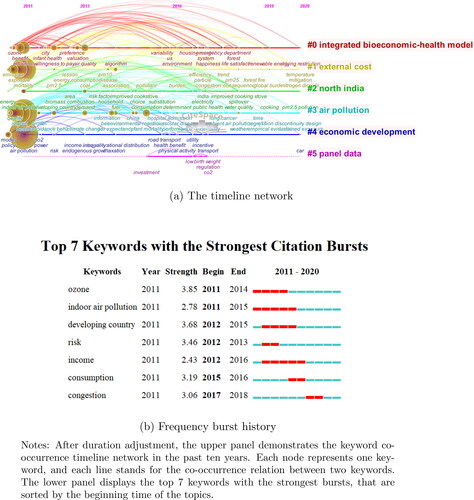
We further extract the top 7 keywords with the strongest bursts in Panel (b), which lists the hottest issues studied in the recent decade. Note that the table is sorted by the beginning time of the topics and the sixth column displays the progress bar of their popularity status. Before 2015, the articles are mainly around the issues in developing countries, and focus on the health risk of ozone and indoor air pollution, attempting to evaluate the health risk of the household. Since 2015, the focal object of the studies has begun shifting to the human impact, like the effect of air pollution on income and consumption. Moreover, the issue of vehicle exhaust emissions due to congestion has become more active recently.
4.4. Co-citation analysis
The fundamental logic underlying the co-citation analysis is that when two objects (documents or authors) are cited by the third document at the same time, it can be considered that the two objects have a co-citation relationship. The more two objects are cited simultaneously, the closer their “distance” is. It can also be inferred that those groups composed of a series of closely related objects tend to have certain common characteristics (Chen, Citation2006). In CiteSpace, after operating the clustering technique according to their keywords, we can visually identify the scientific community under different topics in this field.
4.4.1. Document co-citation analysis
Document co-citation analysis is based on the co-cited connections among documents, that helps to detect the hotspots in air pollution-health area. Besides, the network analysis also enables the scholars to quickly figure out the highly cited references according to their points of interest. In the use of CiteSpace, we select the mode of DCA-Document Co-citation Analysis. Except that we set the node type as a reference, other options and parameters are kept the same as that for the keyword co-occurrence network.
presents the visualization network that is clustered through the LLR algorithm based on the keywords of the reference data. Overall, there are 13 clusters shown in the network, along with the two most cited references per cluster. It is worth emphasizing that the citation bursts are indicated by those red points embedded in the nodes that provide suggestive evidence that the topics are active around infant health, cooking stoves and human health. Moreover, details the cluster information by listing the relative top terms and three most cited papers. It can be seen that the first cluster with the largest size is mainly concerned with the infant risk of air pollution, assessing infant mortality, and respiratory health, as well as the vehicle emissions policy and avoidance behavior. The related references include Currie (Citation2009), Currie and Neidell (Citation2005), and Currie and Walker (Citation2011). The health risk of outdoor air pollution and household indoor pollution is again highlighted in cluster #1 and cluster #2, which can refer to the articles such as He et al. (Citation2016), Bensch et al. (Citation2015) and Bielecki and Wingenbach (Citation2014). Studies on CGE modelling for regulatory analysis become more active recently, like Muller et al. (Citation2011) and Muller and Mendelsohn (Citation2009). Other topics like electricity policy insight, emission reduction, human health, and life satisfaction are also widely studied in the air pollution-health area, which will be explained in detail in the remainder of .
Figure 10. Document co-citation network.
Source: Authors.
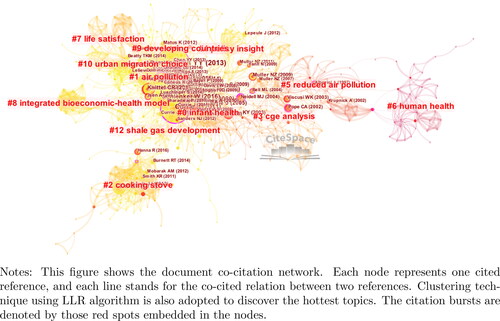
Table 3. Document cluster information and cited references.
4.4.2. Author co-citation analysis
Here, the author co-citation timeline network is constructed through the similar procedure with that above. The mode of ACA-Author Co-citation Analysis in CiteSpace is configured, and the node type is again reset to the author. In , it is clear to find that there are night parallel time axes, corresponding to the different clusters, such as statistical life, air pollution, air pollution damage, environmental Kuznets curve, household air pollution, life satisfaction, economic development, intertemporal avoidance behavior, and integrated approach. Each node on the timeline represents one author in that cluster, and the connection line stands for the co-cited relationship. When looking at the distribution trend of authors under different topics, we find that the field of estimating the value of statistical life has more key authors, whose studies mainly start from 1995, such as Schwartz J, Viscusi WK, Alberini A, and Smith VK, while more influential authors who focus on infant health have appeared and be followed since 2004, such as Chay KY, Currie J, Zivin JG, Greenstone M.
Figure 11. Author co-citation network.
Source: Authors.
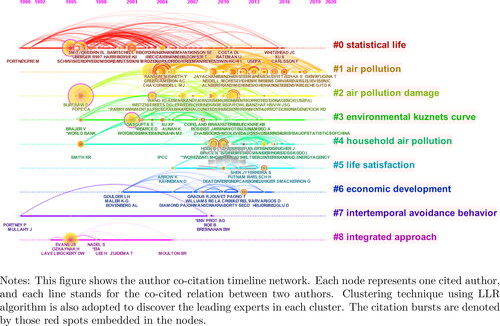
is supplemented to list the relative top terms and highly cited authors under each cluster, as well as the key citing papers that cover most of the leading authors in their reference. Therefore, the scholars can follow the leading experts displayed under the various topics and quickly get familiar with the whole field.
Table 4. Key citing papers and highly cited authors in each cluster.
4.5. Comparison between categories
Till now, the whole bibliometric analysis above has provided comprehensive knowledge of the structure and features of the economic literature in the air pollution-health area. In this section, we review the authors’ keywords of the reference data, and draw the topic dendrogram using Bibliometrix tool operated in R. It can be seen from Panel (a) of , the research frame consists of two parts, one with small part focuses on the loss of life satisfaction and happiness due to air pollution, while the majority of studies are still concerned with the physical risk, especially for infant health. The air pollutants that have mainly been studied are particulate matters, PM2.5 and ozone. Besides that, asthma, cardiovascular disease, and life expectancy, physical activity are the major aspects of the health impact in this field.
Figure 12. Author cooperation network.
Notes: The upper panel shows the topic dendrogram of air pollution-health literature in economics. The lower panel demonstrates the topic dendrogram in environmental science, based on the bibliographic data collected using the identical search query as we set for economics.
Source: Authors.
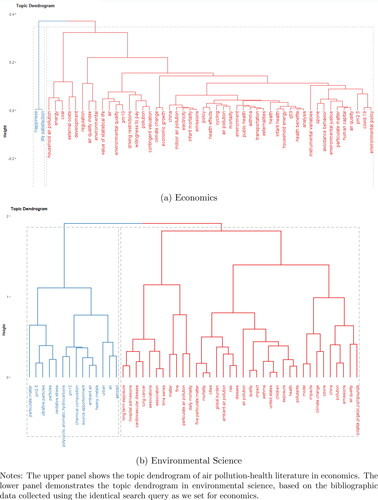
The topic related to air pollution and health is not only discussed in the economic field, but has also received the most extensive attention and discussion in the field of environmental science. Moreover, despite the existence of disciplinary differences, the studies in environmental science could still provide the scientific basis for the related research in the field of economics. Therefore, what is more interesting is comparing between the research frameworks of those two categories and seeking the potential direction for the development in economics.
We re-collect the bibliographic records under the identical settings except replacing the economics category with environmental science, and then re-draw the topic dendrogram in Panel (b). The structure is composed of two parts, one for the list of the target pollutant, that is PM2.5, and the other branch mainly for the types of health risk and the affected groups. Compared with that in economics, environmental science has investigated a wider coverage of air pollutants, including particulate matter, PM2.5, ultra-fine particles, polycyclic aromatic hydrocarbon, PM10, chemical composition, heavy metals, aerosol, and volatile organic compounds. In addition, besides asthma and cardiovascular disease discussed in economics, lung cancer, and daily mortality have also been extensively studied.
5. Conclusion
In this paper, we adopt a novel way, namely bibliometric analysis, to explore the research patterns and features in the economic literature on air pollution and health over the last three decades. A total of 844 English articles and their full records are obtained through WOS core collection. The entire study procedure consists of numerical analysis, cooperation network, keyword co-occurrence network, co-citation network, and topic dendrogram between categories. HistCite, CiteSpace, VOSviewer, and Bibliometrix toolkit in R are involved to visualize the structures and connections.
The main contribution of this paper is to map the knowledge structure and features of the entire air pollution-health area in economics, exploring the research topics, hotspots and frontiers in the existing articles. The major points are concluded in the following:
The overall trend of economic publications on air pollution and health is upward, and has experienced three stages, including early-stage (1990 to 2002), steady development (2003 to 2016), and high growth (2017 to present).
Energy Policy published the most literature (135 publications), followed by Journal of Environmental Economics and Management (57 publications), Ecological Economics (57 publications), and Environmental and Resource Economics (48 publications). Moreover, Energy Policy also has the largest TGCS, while Journal of Environmental Economics and Management has the largest TLCS.
United States has played a core role in this field, with both the largest number of publications and the largest TLCS and TGCS. PR. China ranks second in terms of number and citations, followed by United Kingdom, Germany, and Canada.
Three-fields plot clearly displays the hottest topics and the related authors, as well as the highly-cited documents in each topic. The main topics include “China”, “mortality”, “infant health”, “particulate matter”, “environmental policy”, “human capital”, “externalities” and “indoor air pollution”, representing the hottest topics in this area, which are also the major concerns in economics. Chay and Greenstone (Citation2003) and Currie and Neidell (Citation2005) are the two most cited literatures in air pollution-health area.
United States has the most extensive collaboration networks with other countries, who cooperates most closely with PR. China, Canada and United Kingdom. University of California-Berkeley has published the most work, whose most frequent collaborators contain Cornell University and University of Chicago.
There has formed several relatively influential collaborations in air pollution-health area. Muller NZ, Neidell M, Zivin JG, Greenstone M, and He GJ have established the most influential academic teams.
In terms of keyword co-occurrence network, keywords are clustered at the following terms, including wildfire smoke exposure, integrated bioeconomic-health model, indoor air pollution in North India, external cost, multitasking local bureaucrat, economic growth. In recent ten years, more keywords related to human impact become active, like life satisfaction, happiness, forest fire, cooking stove, income, consumption, and congestion.
Document co-citations are clustered at the following terms, including infant health, agriculture fire, cooking stove, CGE analysis, electricity policy, emissions reduction, integrated model, and life satisfaction.
Compared to the economic field, environmental science has investigated a wider coverage of air pollutants, including ultra-fine particles, polycyclic aromatic hydrocarbon, PM10, chemical composition, heavy metals, aerosol, and volatile organic compounds, and has also studied broader health effects, like lung cancer and daily mortality.
Provided that the analysis is largely affected by the choice of keywords searched in WOS, our work could have two limitations. Firstly, keywords should be more comprehensive, and it is expected to include more related keywords and study the literature network over a larger time period. Secondly, “air pollution” and “health” should be further refined to the types of pollutants and diseases. It is worth conducting a more detail analysis, quantitatively summarizing and comparing the effects of various air pollutants on various diseases.
Disclosure statement
No potential conflict of interest was reported by the authors.
Additional information
Funding
Notes
1 Introduction to WOS core collection: https://clarivate.com/webofsciencegroup/solutions/web-of-science-core-collection/
2 Keywords are directed provided by the authors, and keywords plus are culled from the titles of the article’s references using automatic algorithm (Zhang et al., Citation2016).
3 The wildcard symbol * after “pollut” helps to search for the related keywords phrased differently, such as pollution, polluting, pollutant, and pollutants. The “NEAR/5” operator means the space between those two words is no more than 5 words.
4 Full counting method is different from fractional counting, which means that the weight of the link is factionalized among all the participating institutions.
5 Of the 1701 authors, 237 meet the threshold.
References
- Ambrey, C. L., Fleming, C. M., & Chan, A. Y.-C. (2014). Estimating the cost of air pollution in South East Queensland: An application of the life satisfaction non-market valuation approach. Ecological Economics, 97, 172–181. https://doi.org/10.1016/j.ecolecon.2013.11.007
- Aria, M., & Cuccurullo, C. (2017). Bibliometrix: An R-tool for comprehensive science mapping analysis. Journal of Informetrics, 11(4), 959–975. https://doi.org/10.1016/j.joi.2017.08.007
- Aunan, K., Fang, J., Vennemo, H., Oye, K., & Seip, H. M. (2004). Co-benefits of climate policy—lessons learned from a study in Shanxi, China. Energy Policy, 32(4), 567–581. https://doi.org/10.1016/S0301-4215(03)00156-3
- Benavides-Velasco, C. A., Quintana-García, C., & Guzmán-Parra, V. F. (2013). Trends in family business research. Small Business Economics, 40(1), 41–57. https://doi.org/10.1007/s11187-011-9362-3
- Bensch, G., Grimm, M., & Peters, J. (2015). Why do households forego high returns from technology adoption? Evidence from improved cooking stoves in Burkina Faso. Journal of Economic Behavior & Organization, 116, 187–205. https://doi.org/10.1016/j.jebo.2015.04.023
- Bensch, G., & Peters, J. (2015). The intensive margin of technology adoption–Experimental evidence on improved cooking stoves in rural Senegal. Journal of Health Economics, 42, 44–63.
- Bielecki, C., & Wingenbach, G. (2014). Rethinking improved cookstove diffusion programs: A case study of social perceptions and cooking choices in rural Guatemala. Energy Policy, 66, 350–358. https://doi.org/10.1016/j.enpol.2013.10.082
- Burtraw, D., Krupnick, A., Palmer, K., Paul, A., Toman, M., & Bloyd, C. (2003). Ancillary benefits of reduced air pollution in the US from moderate greenhouse gas mitigation policies in the electricity sector. Journal of Environmental Economics and Management, 45(3), 650–673. https://doi.org/10.1016/S0095-0696(02)00022-0
- Chang, T., Graff Zivin, J., Gross, T., & Neidell, M. (2016). Particulate pollution and the productivity of pear packers. American Economic Journal: Economic Policy, 8(3), 141–169. https://doi.org/10.1257/pol.20150085
- Chay, K. Y., & Greenstone, M. (2003). The impact of air pollution on infant mortality: Evidence from geographic variation in pollution shocks induced by a recession. The Quarterly Journal of Economics, 118(3), 1121–1167. https://doi.org/10.1162/00335530360698513
- Chay, K. Y., & Greenstone, M. (2005). Does air quality matter? Evidence from the housing market. Journal of Political Economy, 113(2), 376–424. https://doi.org/10.1086/427462
- Chen, C. (2006). CiteSpace II: Detecting and visualizing emerging trends and transient patterns in scientific literature. Journal of the American Society for Information Science and Technology, 57(3), 359–377. https://doi.org/10.1002/asi.20317
- Chen, Y., Ebenstein, A., Greenstone, M., & Li, H. (2013). Evidence on the impact of sustained exposure to air pollution on life expectancy from China's Huai River policy. Proceedings of the National Academy of Sciences of the United States of America, 110(32), 12936–12941. https://doi.org/10.1073/pnas.1300018110
- Chen, H., Jiang, W., Yang, Y., Yang, Y., & Man, X. (2017). State of the art on food waste research: A bibliometrics study from 1997 to 2014. Journal of Cleaner Production, 140, 840–846. https://doi.org/10.1016/j.jclepro.2015.11.085
- Chestnut, L. G., Ostro, B. D., & Vichit-Vadakan, N. (1997). Transferability of air pollution control health benefits estimates from the United States to developing countries: Evidence from the Bangkok study. American Journal of Agricultural Economics, 79(5), 1630–1635. https://doi.org/10.2307/1244394
- Costa, D. F., Carvalho, F. d M., & Moreira, B. C. d M. (2019). Behavioral economics and behavioral finance: A bibliometric analysis of the scientific fields. Journal of Economic Surveys, 33(1), 3–24. https://doi.org/10.1111/joes.12262
- Currie, J. (2009). Healthy, wealthy, and wise: Socioeconomic status, poor health in childhood, and human capital development. Journal of EconomIc Literature, 47(1), 87–122. https://doi.org/10.1257/jel.47.1.87
- Currie, J. (2011). Inequality at birth: Some causes and consequences. American Economic Review, 101(3), 1–22. https://doi.org/10.1257/aer.101.3.1
- Currie, J., & Neidell, M. (2005). Air pollution and infant health: What can we learn from California’s recent experience? Quarterly Journal of Economics, 120(3), 1003–1030. https://doi.org/10.1162/003355305774268219
- Currie, J., Neidell, M., & Schmieder, J. F. (2009). Air pollution and infant health: Lessons from New Jersey. Journal of Health Economics, 28(3), 688–703. https://doi.org/10.1016/j.jhealeco.2009.02.001
- Currie, J., & Walker, R. (2011). Traffic congestion and infant health: Evidence from E-ZPass. American Economic Journal: Applied Economics, 3(1), 65–90. https://doi.org/10.1257/app.3.1.65
- Currie, J., Zivin, J. G., Mullins, J., & Neidell, M. (2014). What do we know about short-and long-term effects of early-life exposure to pollution? Annual Review of Resource Economics, 6(1), 217–247. https://doi.org/10.1146/annurev-resource-100913-012610
- Dasgupta, S., Laplante, B., Wang, H., & Wheeler, D. (2002). Confronting the environmental Kuznets curve. Journal of Economic Perspectives, 16(1), 147–168. https://doi.org/10.1257/0895330027157
- Davis, L. W. (2008). The effect of driving restrictions on air quality in Mexico City. Journal of Political Economy, 116(1), 38–81. https://doi.org/10.1086/529398
- Ebenstein, A., Lavy, V., & Roth, S. (2016). The long-run economic consequences of high-stakes examinations: Evidence from transitory variation in pollution. American Economic Journal: Applied Economics, 8(4), 36–65. https://doi.org/10.1257/app.20150213
- Götschi, T., Heinrich, J., Sunyer, J., & Künzli, N. (2008). Long-term effects of ambient air pollution on lung function: A review. Epidemiology (Cambridge, Mass.), 19(5), 690–701. https://doi.org/10.1097/EDE.0b013e318181650f
- Graff Zivin, J., & Neidell, M. (2012). The impact of pollution on worker productivity. The American Economic Review, 102(7), 3652–3673. https://doi.org/10.1257/aer.102.7.3652
- Greenstone, M., & Hanna, R. (2014). Environmental regulations, air and water pollution, and infant mortality in India. American Economic Review, 104(10), 3038–3072. https://doi.org/10.1257/aer.104.10.3038
- Greenstone, M., & Jack, B. K. (2015). Envirodevonomics: A research agenda for an emerging field. Journal of Economic Literature, 53(1), 5–42. https://doi.org/10.1257/jel.53.1.5
- Grieshop, A. P., Marshall, J. D., & Kandlikar, M. (2011). Health and climate benefits of cookstove replacement options. Energy Policy, 39(12), 7530–7542. https://doi.org/10.1016/j.enpol.2011.03.024
- Hammitt, J. K., & Zhou, Y. (2006). The economic value of air-pollution-related health risks in China: A contingent valuation study. Environmental & Resource Economics, 33(3), 399–423. https://doi.org/10.1007/s10640-005-3606-0
- Hanna, R., & Oliva, P. (2015). The effect of pollution on labor supply: Evidence from a natural experiment in Mexico City. Journal of Public Economics, 122, 68–79. https://doi.org/10.1016/j.jpubeco.2014.10.004
- He, G., Fan, M., & Zhou, M. (2016). The effect of air pollution on mortality in China: Evidence from the 2008 Beijing Olympic Games. Journal of Environmental Economics and Management, 79, 18–39. https://doi.org/10.1016/j.jeem.2016.04.004
- Holland, S. P., Mansur, E. T., Muller, N. Z., & Yates, A. J. (2016). Are there environmental benefits from driving electric vehicles? The importance of local factors. American Economic Review, 106(12), 3700–3729. https://doi.org/10.1257/aer.20150897
- Horne, B. D., Joy, E. A., Hofmann, M. G., Gesteland, P. H., Cannon, J. B., Lefler, J. S., Blagev, D. P., Korgenski, E. K., Torosyan, N., Hansen, G. I., Kartchner, D., & Pope, C. A. (2018). Short-term elevation of fine particulate matter air pollution and acute lower respiratory infection. American Journal of Respiratory and Critical Care Medicine, 198(6), 759–766. https://doi.org/10.1164/rccm.201709-1883OC
- Iavicoli, I., Fontana, L., & Bergamaschi, A. (2009). The effects of metals as endocrine disruptors. Journal of Toxicology and Environmental Health. Part B, Critical Reviews, 12(3), 206–223. https://doi.org/10.1080/10937400902902062
- Jeuland, M., Bhojvaid, V., Kar, A., Lewis, J., Patange, O., Pattanayak, S., Ramanathan, N., Rehman, I., Soo, J. T., & Ramanathan, V. (2015a). Preferences for improved cook stoves: Evidence from rural villages in north India. Energy Economics, 52, 287–298. https://doi.org/10.1016/j.eneco.2015.11.010
- Jeuland, M., Pattanayak, S. K., & Bluffstone, R. (2015b). The economics of household air pollution. Annual Review of Resource Economics, 7(1), 81–108. https://doi.org/10.1146/annurev-resource-100814-125048
- Levinson, A. (2012). Valuing public goods using happiness data: The case of air quality. Journal of Public Economics, 96(9-10), 869–880. https://doi.org/10.1016/j.jpubeco.2012.06.007
- Li, Z., Folmer, H., & Xue, J. (2014). To what extent does air pollution affect happiness? The case of the Jinchuan mining area. Ecological Economics, 99, 88–99. https://doi.org/10.1016/j.ecolecon.2013.12.014
- Lin, B., & Su, T. (2020). Mapping the oil price-stock market nexus researches: A scientometric review. International Review of Economics & Finance, 67, 133–147. https://doi.org/10.1016/j.iref.2020.01.007
- Lucio-Arias, D., & Leydesdorff, L. (2008). Main-path analysis and path-dependent transitions in HistCiteTM-based historiograms. Journal of the American Society for Information Science and Technology, 59(12), 1948–1962.
- Mariani, F., Pérez-Barahona, A., & Raffin, N. (2010). Life expectancy and the environment. Journal of Economic Dynamics and Control, 34(4), 798–815. https://doi.org/10.1016/j.jedc.2009.11.007
- Mohallem, S. V., de Araujo Lobo, D. J., Pesquero, C. R., Assuncao, J. V., de Andre, P. A., Saldiva, P. H. N., & Dolhnikoff, M. (2005). Decreased fertility in mice exposed to environmental air pollution in the city of Sao Paulo. Environmental Research, 98(2), 196–202. https://doi.org/10.1016/j.envres.2004.08.007
- Muller, N. Z., & Mendelsohn, R. (2007). Measuring the damages of air pollution in the United States. Journal of Environmental Economics and Management, 54(1), 1–14. https://doi.org/10.1016/j.jeem.2006.12.002
- Muller, N. Z., & Mendelsohn, R. (2009). Efficient pollution regulation: Getting the prices right. American Economic Review, 99(5), 1714–1739. https://doi.org/10.1257/aer.99.5.1714
- Muller, N. Z., Mendelsohn, R., & Nordhaus, W. (2011). Environmental accounting for pollution in the United States economy. American Economic Review, 101(5), 1649–1675. https://doi.org/10.1257/aer.101.5.1649
- Nam, K.-M., Selin, N. E., Reilly, J. M., & Paltsev, S. (2010). Measuring welfare loss caused by air pollution in Europe: A CGE analysis. Energy Policy, 38(9), 5059–5071. https://doi.org/10.1016/j.enpol.2010.04.034
- Neidell, M. (2009). Information, avoidance behavior, and health the effect of ozone on asthma hospitalizations. Journal of Human Resources, 44(2), 450–478. https://doi.org/10.1353/jhr.2009.0018
- Neidell, M. J. (2004). Air pollution, health, and socio-economic status: The effect of outdoor air quality on childhood asthma. Journal of Health Economics, 23(6), 1209–1236. https://doi.org/10.1016/j.jhealeco.2004.05.002
- Olawumi, T. O., & Chan, D. W. (2018). A scientometric review of global research on sustainability and sustainable development. Journal of Cleaner Production, 183, 231–250. https://doi.org/10.1016/j.jclepro.2018.02.162
- Pan, X., Yan, E., Cui, M., & Hua, W. (2018). Examining the usage, citation, and diffusion patterns of bibliometric mapping software: A comparative study of three tools. Journal of Informetrics, 12(2), 481–493. https://doi.org/10.1016/j.joi.2018.03.005
- Pearce, D. (1996). Economic valuation and health damage from air pollution in the developing world. Energy Policy, 24(7), 627–630. https://doi.org/10.1016/0301-4215(96)00051-1
- Pearce, D., & Crowards, T. (1996). Particulate matter and human health in the United Kingdom. Energy Policy, 24(7), 609–619. https://doi.org/10.1016/0301-4215(96)00048-1
- Rabl, A., & De Nazelle, A. (2012). Benefits of shift from car to active transport. Transport Policy, 19(1), 121–131. https://doi.org/10.1016/j.tranpol.2011.09.008
- Rajagopalan, S., Al-Kindi, S. G., & Brook, R. D. (2018). Air pollution and cardiovascular disease: JACC state-of-the-art review. Journal of the American College of Cardiology, 72(17), 2054–2070. https://doi.org/10.1016/j.jacc.2018.07.099
- Randolph, J. (2009). A guide to writing the dissertation literature review. Practical Assessment, Research, and Evaluation, 14(1), 13.
- Schlenker, W., & Walker, W. R. (2016). Airports, air pollution, and contemporaneous health. The Review of Economic Studies, 83(2), 768–809. https://doi.org/10.1093/restud/rdv043
- Schreifels, J. J., Fu, Y., & Wilson, E. J. (2012). Sulfur dioxide control in China: Policy evolution during the 10th and 11th Five-year Plans and lessons for the future. Energy Policy, 48, 779–789. https://doi.org/10.1016/j.enpol.2012.06.015
- Sun, C., Kahn, M. E., & Zheng, S. (2017). Self-protection investment exacerbates air pollution exposure inequality in urban China. Ecological Economics, 131, 468–474. https://doi.org/10.1016/j.ecolecon.2016.06.030
- Xie, J., Hu, K., Zhu, M., & Guo, Y. (2020). Data-driven analysis of global research trends in bioacoustics and ecoacoustics from 1991 to 2018. Ecological Informatics, 57, 101068. https://doi.org/10.1016/j.ecoinf.2020.101068
- Yuan, L., Shin, K., & Managi, S. (2018). Subjective well-being and environmental quality: The impact of air pollution and green coverage in China. Ecological Economics, 153, 124–138. https://doi.org/10.1016/j.ecolecon.2018.04.033
- Zhang, J., Yu, Q., Zheng, F., Long, C., Lu, Z., & Duan, Z. (2016). Comparing keywords plus of WOS and author keywords: A case study of patient adherence research. Journal of the Association for Information Science and Technology, 67(4), 967–972. https://doi.org/10.1002/asi.23437
- Zhang, X., Zhang, X., & Chen, X. (2017). Happiness in the air: How does a dirty sky affect mental health and subjective well-being? Journal of Environmental Economics and Management, 85, 81–94. https://doi.org/10.1016/j.jeem.2017.04.001
- Zivin, J. G., & Neidell, M. (2009). Days of haze: Environmental information disclosure and intertemporal avoidance behavior. Journal of Environmental Economics and Management, 58(2), 119–128. https://doi.org/10.1016/j.jeem.2009.03.001