
 ?Mathematical formulae have been encoded as MathML and are displayed in this HTML version using MathJax in order to improve their display. Uncheck the box to turn MathJax off. This feature requires Javascript. Click on a formula to zoom.
Abstract
Coordinating and managing the contradictions among the environment, resources and economy is an urgent problem in China. Based on the panel data of 30 provinces and cities in China from 2004 to 2017, this paper empirically studies the impact of environmental regulation on China's high-quality economic development and the mediating effect mechanism through the spatial Durbin model and threshold model. The results show that China's high-quality economic development shows a fluctuating upward trend, and the east is higher than the middle and west. Environmental regulation significantly inhibits high-quality economic development, but its impact is moderated by accelerating industrial upgrading, promoting technological innovation, and enhancing foreign direct investment. As the primary driving force, technological innovation has a significant spatial spillover effect. The results show that industrial upgrading has no threshold effect, and technological innovation and foreign direct investment have the characteristics of a ‘U’ single threshold.
1. Introduction
China has made remarkable achievements in industrialization, but for a long time, the industrial process has not been able to break free from middle and low-end constraints. The fundamental reasons for these constraints can be attributed to the slow transformation and upgrading of the industrial structure and the lack of follow-up power for the conversion of new and old kinetic energy (Ielasi et al., Citation2018). The extensive development driven mainly by investment and other factors has directly led to serious environmental pollution and resource waste (Zhang et al., Citation2019). According to a report released by the WHO in 2017, 6 out of the 30 most polluted cities in the world are in China. The realization of a refined green economic development model brooks no delay (Ji et al., 2021; Tao et al., Citation2022). How to use reasonable policies to improve high-quality economic development and thereby alleviate the contradiction between the environment and economic development is a key issue that China urgently needs to solve (Umar et al., Citation2021).
Environmental regulation is a key measure to solve environmental pollution and improve resource utilization (Rizvi et al., Citation2021). In the context of changes in international economic and trade patterns and domestic economic development strategies and direction adjustments, potential restraints are used to directly affect the transaction costs, benefits, and management of economic entities. Efficiency in turn promotes changes in high-quality economic development (Cai & Zhou, Citation2017). However, in practice, in the underdeveloped central and western regions, local governments will deregulate and devote themselves to creating ‘policy depressions’ to increase the attraction of external investment, to encourage the transfer of industries from foreign or eastern coastal areas, thereby leading to increasing local environmental pollution. Pollution and industrial spatial transfer caused by environmental regulatory gradients are an important reason for not only the healthy ecological environment in some areas of China but also the uneven distribution of overall quality. Therefore, does environmental regulation policy have a significant impact on high-quality economic development? If so, what is the mechanism of environmental regulation policies affecting green productivity? Are there any regional differences? Is there a threshold effect? Based on these questions, this article uses the intermediary effect as the starting point to investigate the impact of environmental regulations on the high-quality development of the regional economy and its mediating effect mechanism, as well as spatial spillover effects and threshold characteristics. Effective governance has important research significance.
2. Related literature
For the relationship attribute and influence mechanism between environmental regulation and high-quality economic development, the main viewpoints are as follows: Porter hypothesis theory believes that there is an explicit positive relationship between them, and the ‘forced; effect is an important mechanism. He, (Citation2018) supports this conclusion. They constructed China's economic growth quality system based on China's provincial panel data and empirically studied the relationship between environmental regulation and economic growth. The results show that environmental regulation significantly promoted economic development and social welfare levels overall but also indirectly led to the expansion of the income gap. Qi et al. (Citation2016) points out, based on data of 113 key environmental protection cities, that the ‘emission reduction’ effect of environmental regulation is conducive to economic development, and a good institutional environment will amplify the positive effect and slow down the distortion effect of regulatory policies to realize the ‘win–win’ of environment and economy. Hamamoto (Citation2006) studied the Japanese manufacturing industry and found that the increase in R&D investment stimulated by strict regulation has a significant positive impact on the growth rate of total factor production. Yang et al. (Citation2012) show that environmental regulation not only improves the production cost of enterprises but also promotes technological innovation. In the long run, the benefits brought by innovation will greatly offset the increased cost, improve the productivity of enterprises and form a competitive advantage.
The ‘cost compliance’ hypothesis holds that there is a linear inverse relationship between environmental regulation and high economic quality. The ‘cost’ effect is the realization mechanism, and regulatory policy has characteristics of lag, which not only inhibits high-quality economic development and growth but also induces enterprises to accelerate polluting behaviors to increase economic output as a means of compensating for the cost of emission reduction, which results in environmental deterioration (Lobato et al., Citation2021). Ling et al. (Citation2013), based on the input–output data of 36 industrial industries in China, showed that China's industrial green total factor productivity regressed from 2001 to 2010, resulting in a reduction or even negative contribution rate to the industrial economy, creating a threshold effect. Based on the data of 27 manufacturing industries, Yinea al. (2012) found that the overall level of environmental regulation intensity and green total factor productivity of the manufacturing industry conform to a U-shaped relationship, and there is heterogeneity between clean sectors and pollution-intensive sectors. Ling and Tao (Citation2012) calculated the environmental regulation and green total factor productivity of 28 manufacturing sectors and found that the intensity of environmental regulation in heavily polluting industries is relatively reasonable and significantly promotes the green total factor productivity of industries, while the relationship between moderately polluting and slightly polluting industries is ‘U’.
In addition, some scholars believe that there is a nonlinear relationship between environmental regulation and high economic quality. The economic effect of environmental regulation depends on whether the ‘forced effect’ or ‘cost effect’ is more dominant. The relationship between environmental regulation and high-quality economic development may have a U-shaped relationship (He, Citation2018; Xiong, Citation2011) or an inverted U-shaped relationship (Cha, Citation2015; Liu et al., Citation2016). Wang and Lu (Citation2018) and others also concluded that environmental regulation has a significant inhibitory effect on the quantity of economic growth, but it has significantly improved the quality of economic growth and regional heterogeneity, especially in the central and western regions.
In summary, although sufficient research has shown that reasonable environmental regulations can promote high-quality economic development, opposing views still exist (Naqvi et al., Citation2021). The reason for opposing views can be attributed to ‘regional differences’, ‘threshold effect’ and so on. In addition, most studies focus on a single analysis of the impact of environmental regulations on high-quality economic development without delving into the specific impact mechanism. Based on this, this paper studies the impact mechanism of environmental regulation on green total factor productivity and regional differences at three levels: industrial upgrading, technological innovation and foreign direct investment. By constructing a spatial Durbin model and a panel threshold model, we will empirically test environmental regulations. The mediating effect mechanism and spatial spillover and threshold effect affect high-quality economic development.
3. Analysis of the mediating effect mechanism
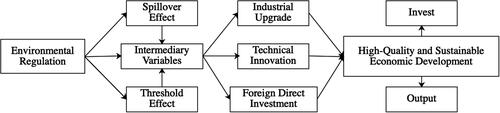
As shown in , environmental regulation policy is the key factor that affects the sustainable development of the green economy. In addition to its formulation and implementation, it can also have a far-reaching impact on high-quality economic development, such as industrial upgrading, technological innovation and foreign direct investment.
Figure 1. Analysis diagram of the intermediary effect mechanism.
3.1. Industrial upgrading effect
Industrial structure is not only an important carrier impacting economic activities but also an important factor affecting the ecological environment. It has the dual functions of ‘resource converter’ and ‘environmental regulator’ (Yu, Citation2020). At present, the transformation and upgrading of China's industrial structure is characterized by a strong planned economy and a lack of intrinsic incentives. Nonmarket intervention regulatory policies are a government-led means for effectively solving the externalities of environmental pollution compensates for this incentive. Scientific environmental policies force industries with high pollution and high energy consumption, such as resource-based industries, to eliminate backward production capacity, increase green management and green improvement, and transform them into green and clean industries to realize the high-end rise of the industrial value chain (Xiao & Liu, Citation2014). However, the tightening of regulatory policies amplifies the ‘cost compliance effect’ in areas dominated by pollution-intensive manufacturing industries, and pollution emissions increase with the increase of regulatory intensity. It is inefficient or even ineffective to reduce green productivity through environmental regulations.
3.2. Technological innovation effect
Technology, as an intermediary variable, acts on environmental regulation to influence high-quality economic development. There may be two effects. First, the ‘innovation compensation effect’, that is, reasonable environmental regulation, can encourage enterprises to internally digest the regulation cost, and the government encourages enterprises to increase R&D investment and carry out technological innovation activities through policy subsidies and actively introduce or develop green technologies and advanced management tools, which can effectively offset or even surpass the environmental compliance cost caused by the formulation of regulatory policies and ultimately promote high-quality economic development. (Boyd & Curtis, Citation2014). Second, the ‘cost effect’, that is, the implementation of environmental regulation policies, can lead to an increase in the external environmental costs and pollution control costs of enterprises. In pursuit of income optimization, enterprises can increase the number of products to compensate for the additional production costs, resulting in increased pollution emissions, which seriously restricts the development of technological innovation of enterprises.
3.3. Foreign direct investment effect
To attract more foreign direct investment to promote local economic growth, local governments have implemented blind and disorderly ‘bottom-to-bottom competition’ behavior, resulting in some symbolic or passive implementation of regulatory policies. Trade-induced investment often ignores the quality of foreign direct investment and easily leads to low-quality investment dominated by pollution-intensive enterprises, which makes the region a ‘pollution paradise’ of developed countries and regions, so foreign direct investment may worsen the development of high-quality economic development. However, some scholars believe that high-quality foreign direct investment provides the host country with excellent management tools, environmentally friendly production standards, green technologies, and sufficient funds. Through the spatial correlation effect and demonstration effect, it can effectively encourage enterprises to invest in R&D and technological innovation spillover, further promote clean technologies, improve resource utilization and reduce pollutant emissions (Kim et al., Citation2015).
4. Model setting and variable selection
4.1. Parameter design
Suppose and
represent provinces and cities and observation years, respectively.
indicates the intercept item,
,
indicates the estimation coefficient,
indicates the control variable, and
indicates the error term. Referring to the research of Wu and He (Citation2017),
(
represents the actual distance of the straight line between the centers of the two provincial capitals). Second, the adjacent weight matrix is established by using the adjacent method, that is, the adjacent distance is 1 and the nonadjacent distance is 0. Other parameters are shown in :
Table 1. Parameter design.
4.2. Model setting
This paper focuses on the impact of local and surrounding areas and their mediating effect mechanism on green total productivity. According to Elhorst (Citation2014), the direct effect is the influence of the explanatory variables in the region on their own explanatory variables, and the indirect effect is the influence of each pair of explanatory variables in the region on the explanatory variables in adjacent areas. Total area is the sum of the direct effect and spatial spillover, that is, the impact of explanatory variables on the explained variables is analyzed at the overall level. New economic geography holds that spatial distance is an important factor affecting regional economic ties. Similarly, and
may have spatial spillover effects because they are adjacent to each other, so adding spatial factors to the original basis will effectively reduce the regression deviation. There are three commonly used spatial econometric models: the spatial autocorrelation model (SAR), spatial error model (SEM) and spatial Durbin model (SDM). Therefore, the measurement models available for inspection are established as follows.
(1)
(1)
EquationEq. (1)(1)
(1) represents the basic regression model.
(2)
(2)
(3)
(3)
(4)
(4)
EquationEqs. (1) (3)(3)
(3) and Equation(4)
(4)
(4) represent SAR, SEM and SDM, respectively.
(5)
(5)
EquationEq. (5)(5)
(5) represents the mediating variable model constructed to further explore the intermediary effect influence mechanism of environmental regulation and high-quality economic development.
represents the mediating variable (
).
Finally, referring to the test procedure of Preacher and Hayes (Citation2008), the mediating variable is used as the explained variable to verify the mediating effect based on on
and
A regression model is constructed which includes explanatory variables, intermediate variables and explained variables, as shown in EquationEq. (6)
(6)
(6) :
(6)
(6)
4.3. Data source and characteristic analysis
The data selected in this paper are the research data of 30 provinces and cities in China (except Tibet) from 2004 to 2017, which are mainly from the China Statistical Yearbook, provincial statistical yearbook, Tai'an database, wind database and National Bureau of Statistics. For some missing data, the linear interpolation method is used to supplement the complete data.
4.3.1. Explained variable
Referring to the research of Cai and Zhou (Citation2017), this paper uses MAXDEA to calculate Suppose there are
inputs
and
outputs
in decision-making units, namely, provinces
γ* represents the optimal efficiency value,
represents the weight of the input element
represents the radial efficiency value.
represents the relaxation variable corresponding to the input element
represents the parameter integrating radial
and nonradial relaxation variables,
and
respectively represent the relative importance of input, output and reference decision-making unit,
and
Then, the EBM directional distance function is constructed as follows.
(7)
(7)
(8)
(8)
(9)
(9)
Then, the GML index expression is constructed as shown in EquationEq. (10)(10)
(10) .
(10)
(10)
In EquationEq. (10)(10)
(10) ,
and
represent the unexpected output of the
and
periods, respectively. Then, the directional distance function EquationEq. (11)
(11)
(11) can be deduced:
(11)
(11)
Since the GML index refers to the green total factor growth rate rather than itself, it is assumed that 2004 is 1, 2005
is 2004 multiplied by the GML index in 2005, and so on.
As mentioned above, is divided into two parts: input and output. The indicators selected in this paper are shown in . Referring to Zhang et al. (Citation2004), using 2000 as the base period, the annual depreciation rate is 9.6%, and the perpetual inventory method is used to calculate the capital stock
of each province, as shown in EquationEq. (12)
(12)
(12) .
(12)
(12)
Table 2. Green total factor production measurement index.
The calculation results of regional green total factor productivity are shown in . Overall, China's green total factor productivity fluctuated greatly, but it increased significantly after 15 years. The eastern region is in a leading position with obvious advantages. The midlands are the lowest, which may be related to taking on many industries with high pollution and high energy consumption. The west is in the middle reaches, but the green total factor productivity is slowly rising due to the tightening of policies.
Table 3. Regional green total factor productivity.
4.3.2. Core explanatory variable
Since this paper focuses on the investment in environmental pollution control, it is expressed by the ratio of the total investment in the treatment of pollutants such as wastewater, waste gas, solid pollutants, and noise in each province to the provincial GDP for reference Dong et al. (Citation2011) and Yu and Sun (Citation2017).
4.3.3. Mediating variable
With reference to Gan et al. (Citation2011), is expressed by the ratio of tertiary industry GDP to secondary industry GDP. The proportion of technology market turnover in the GDP of each province is taken as
It is expressed by the ratio of utilized foreign direct investment to GDP in each province
4.3.4. Control variable
is expressed as the proportion of the urban population to the total population.
is expressed as the ratio of total investment in fixed assets to GDP.
is expressed as the ratio of the total import and export of goods to GDP by the location of the business unit.
is expressed by the proportion of government consumption expenditure to GDP. The characteristics of the main variables are shown in .
Table 4. characteristics of main variables.
4.4. Spatial autocorrelation test
Spatial dependence is the premise of a spatial econometric model. In this paper, the Moran index is introduced to test for spatial autocorrelation. The results are shown in . The Moran index
basically passes the 10% significance test, indicating that there are obvious spatial agglomeration characteristics in the high-quality economic development of provinces and cities; that is, the spatial measurement method is applicable in this paper.
Table 5. Moran index of high-quality economic development from 2004 to 2017.
5. Empirical analyses
5.1. Spatial panel model identification and verification
First, the SAR, SDM and SEMs are identified and tested, and the results are shown in . LR tests significantly reject the original hypothesis. SDM cannot be simplified into SAR and SEM, and the log-l value of double fixed SDM is 521.93, which is the highest compared with SAR and SEM, indicating that SDM is optimal. The Hausman test of fixed effects and random effects shows that the value of −22.25 is negative, indicating that the fixed effect is better. In addition, in the LR test of the double fixation effect, individual fixation effect and time fixation effect, the original hypothesis is significantly rejected, so the double fixation effect is better. Therefore, this paper selects the double fixed space durbin model for empirical analysis.
Table 6. Calculation results of the spatial econometric model.
5.2. Mediating variable regression analysis
To verify the significance of the impact of on mediating variables, regression analysis is carried out on Model (5) according to the intermediary effect, and the results are shown in . Obviously, the estimated coefficients of
to
and
are significantly positive and to
is significantly negative, which indicates that Er can accelerate
and promote
but inhibit
A possible reason for this is that the tightening of regulatory policies will force enterprises to develop green technology and cultivate green demand, realize the greening of industrial structure, and then promote
and
At the same time, strict policies will raise the market access threshold and pollution discharge standards, form environmental barriers, block low-quality
increase the environmental governance costs of existing foreign-funded enterprises and occupy the R&D and management costs to inhibit
Table 7. Analysis of and its index decomposition results.
5.3. Mediating effect regression analysis
5.3.1. Analysis of total regional mediating effect
As shown in , in the benchmark regression model, the total effect and direct effect estimation coefficients of the environmental estimation coefficients are significantly negative, indicating that has a significant inhibitory effect on
and local economic growth, and the spatial spillover effect is not obvious. This is consistent with the research conclusions of Lanoie et al. (Citation2011) and Wang and Lu (Citation2018); that is,
will increase the cost of corporate environmental governance and reduce the profit space, thus crowding out green innovation and productive investment and inhibiting the growth of high-quality economic development. In the mediating effect model, the
coefficient is effectively reduced, indicating that the negative effect on
is effectively alleviated after adding mediating variables. The direct effect estimation coefficients of
and
are significantly positive. By optimizing resource allocation, industrial transfer, and other measures to promote production factors from nonclean industries with low productivity to clean industries with high productivity, the value chain can be effectively climbed (Umar et al., Citation2021). Through financial subsidies and other measures, enterprises are encouraged to carry out technology R&D and realize green innovation, which can effectively improve production efficiency. At the same time, reasonable preferential policies and strict
can avoid the low-end
of high pollution on the one hand and attract high-quality
with advanced production technology and management means on the other hand to provide experience for China's sustainable development, occupy domestic enterprises with high pollution and realize healthy economic development. The spatial spillover and total effect of
are negative at the 10% level. A possible reason for this is that the radical tightening policy will force resource-based industries to transfer to surrounding areas with a backward economy or loose regulation policies, which has a diffusion effect. The spatial spillover and total effect of
are significantly positive at the levels of 5% and 1%, respectively, which is undoubtedly related to the spatial demonstration effect and diffusion effect caused by the improvement of technical capacity. The spatial spillover and total effect of
are not significant. A possible reason for this is that it has almost no diffusion effect and cannot be copied.
Table 8. Analysis of the influence mechanism of the mediating effect.
5.3.2. Analysis of subregional mediating effect
In this section, 30 provinces and cities in China are divided into three regions: East, Midlands, and West for empirical analysis. The results are shown in .
Table 9. Analysis of the results of the subregional mediating effect mechanism.
In the east, has no mediating effect, and the direct effect, spatial spillover, and total effect of
are significantly positive, indicating that
can effectively promote
and then increase
in this region, adjacent regions and total regions.
only shows a positive direct effect at the 10% level, indicating that
plays only an intermediary role in this region. A reason for this may be that fierce market competition in the eastern region urges enterprises to actively invest in technological innovation and improve management means. At the same time, the agglomeration of high-quality capital, labor and other factors can support the government's policies to improve emission standards and can also effectively screen out high-quality
In Midlands, the direct effect, spatial spillover, and total effect of and
are significantly positive, the direct effect of
is significantly positive, and the spatial spillover and total effect are negative at the 10% level. A possible reason for this is that the midlands have strong external constraints on the environment and resources. As part of the strict regulation strategy, the local government will implement appropriate policy dividends as internal incentives to encourage enterprises to actively update green technology and upgrade production equipment to improve green efficiency. In addition, the economic development level of central China is similar, and there is no industrial transfer. Under Chinese-scale competition, the competitive regions adhering to the maximization of interests will imitate the optimized regulation strategies and industrial policies of the region, which will drive the strategic interaction of adjacent regions, thereby spreading these strategies throughout the whole region. There is both competition and cooperation among enterprises, and technology sharing and exchange are the norms. At the same time, the advantages created by perfect transportation infrastructure and strong industrial scale will attract many investors. However, to meet the needs of political promotion competition and economic development, the initiative of neighboring local governments may lead to low quality
In the west, and
have no intermediary effect, and the estimation coefficients of the direct effect, spatial spillover and total effect of
are significantly negative, which is inconsistent with expectations. A possible reason for this is that the overall economic strength of the western region is weak, and the tightening of regulatory policies leads to increased environmental compliance costs and weak policy dividends. Due to the lag of regulatory policies and innovation effects, resource-based industries must make up for environmental governance investment by increasing economic output in the short term which increases the burden of pollution. The overall industrial infrastructure is not perfect, so it is difficult to attract high-quality
5.3.3. Robustness check
As shown in , to ensure the validity of the conclusions, this paper tests the robustness of the empirical results from three aspects. First, the adjacency weight matrix is replaced for regression, and the adjacency weight matrix is replaced by the geographic distance weight matrix for empirical analysis. Second, we change the explained variables and use the per capita real GDP of provinces and cities instead of green total factor productivity as the variable to measure the for regression analysis. Finally, the measurement method of the explained variables was changed. This paper calculates the green total factor productivity based on the EBM-GML model. Yu et al. (Citation2019) changed the measurement method of green total factor productivity based on unchanged original data and used the SBM-ML model for calculation.
and
still play a significant role in strengthening
and
The empirical results are more consistent with the original conclusions, but there are differences in the regression coefficients of explanatory variables. Therefore, the empirical results are basically stable.
Table 10. Robustness test.
5.3.4. Analysis of panel threshold effect
The above shows that has a significant negative impact on
This impact will produce structural changes due to three mediating effect mechanisms:
and
which may have a nonlinear relationship. To further verify this relationship, referring to Yu and Sun (Citation2017), this paper selects three mediating variables as threshold variables to analyze the threshold effect of
on
where
is the threshold and
is the threshold variable, that is,
and
is a random interference term. The structure of the panel threshold model is shown in EquationEq. (13)
(13)
(13) .
(13)
(13)
The results are shown in . This paper uses the bootstrap self-help sampling method to generate 300 samples to determine the threshold value and threshold number of threshold variables. Among them, the single threshold, double threshold, and triple threshold effects of are not significant, and the single threshold effects of
are significant at the level of 10%, with thresholds of 0.503 and 1.362, respectively. The double threshold and triple threshold effects of both are not significant. There is no threshold effect in
and there is a single threshold effect in
and
.
Table 11. threshold effect test results.
5.3.5. Analysis of panel threshold effect
The threshold regression results are shown in . The results show that with the rise of and
the relationship between and presents the characteristics of the ‘V’ threshold, which decreases first and then increases. When
is lower than 0.503,
significantly inhibits the improvement of
and Er follows the ‘cost effect’; that is, enterprises face problems such as lack of innovation incentives, lack of R&D stamina, and lack of funds. The tightening of
has led to a rise in external environmental costs and a high-cost burden, forcing enterprises to improve product output and continue to accelerate the emission of pollutants, forming a vicious circle. When
is higher than 0.503, the implementation of
significantly promotes
which follows the ‘Porter Hypothesis’. With the improvement of the
level, the positive effect of
on green development gradually appears. With the application of high and new technologies such as big data and artificial intelligence, resource allocation optimization and resource utilization improvement, the ‘innovation compensation effect’ improves the efficiency of the industrial chain and supply chain and finally improves green efficiency. When
is lower than 1.362,
significantly reduces
At this time, the local government pays too much attention to the GDP first, focusing on the economy to improve performance, and takes on excesses levels of low-tech intensive industries transferred from developed countries and regions, resulting in the region becoming a ‘pollution refuge’ for developed countries and regions. When Fdi is higher than 1.362,
has a significant positive effect on
At this time, the tightening of the
standard attracts rich capital and technology spillovers for local enterprises and promote the development of a green economy.
Table 12. Threshold regression results.
6. Conclusion and enlightenment
Based on the panel data of 30 provinces and cities in China from 2004 to 2017, this paper empirically studies the impact of on
in China and the intermediary effect mechanism through the spatial durbin model and threshold model. The results show that (1)
shows a fluctuating upward trend. The eastern region is higher than the national average. The midlands and west grew slowly before 2008 and showed a steady upward trend after 2008. (2)
significantly inhibits
but accelerating
promoting lnn and improving Fdi will effectively ease the relationship between
and local
Among them,
is the primary driving force, with a significant spatial spillover effect.
has negative space overflow, and Fdi has no space overflow. (3) To further explore whether there is a nonlinear relationship between
and
the intermediary variable is used as the threshold variable to construct the threshold model. The analysis shows that
has no threshold effect, and
and
have the characteristics of a U-shaped single threshold. When the levels of
and Fdi are low,
is strengthened and economic development is hindered. With the increase in
and
levels,
can significantly mitigate the negative impact on
The conclusions of this paper provide the following useful enlightenment.
The formulation and implementation of scientific and differentiated environmental regulation policies. The government should set appropriate environmental regulation standards according to local conditions, maintain the existing environmental regulation intensity for the eastern region, and pay attention to the incentive effect of environmental regulation forms on green transformation. For the central and western regions with high intensities of environmental regulation, we should appropriately reduce the standard of environmental regulation. Excessive environmental regulation will increase not only the burden on enterprises but also the restrictive effect of the cost effect on the forced effect.
The formulation of environmental regulation policies should be guided by the green adjustment of industrial structure. A reasonable intensity of environmental regulation should further stimulate the adjustment of industrial structure, increase government subsidies for the R&D enterprises and innovation environment, encourage pursuit of green product structure by enterprises, improve production of technology and investment in advanced pollution control equipment, and resolutely abandon the traditional practice of ‘pollution first and treatment later’ to change the environmental pollution control mode from ‘end treatment’ to ‘source control’ and drive the upgrading of regional industrial structure.
Green technological progress is the driving force for improving high-quality economic development. Local governments should strengthen financial subsidies and preferential dividends of tax reduction and exemption for enterprises' technological innovation strategies, encourage enterprises and R&D institutions to increase innovation investment and R&D, promote the joint participation of industry, universities and research between provinces and even urban areas in innovation activities, make use of the digital economy and internet cloud platform, accelerate green technology innovation, realize regional spillover, and improve the overall green economic development capacity.
The central government should control the pace of environmental policies and guide foreign investment to create healthy interactions. On the one hand, the central government should appropriately reduce local government discretion in the implementation of environmental regulations, actively guide the orderly competition of environmental regulations, and avoid the pollution paradise effect that may be caused by incomplete implementation. In addition, we should also encourage environmentally-friendly foreign-funded enterprises to settle locally, learn from and absorb the advanced green technology spillover experience of foreign-funded enterprises, and drive local enterprises to incubate and develop cleaner production enterprises to improve the coupling between foreign investment and the green transformation of China's industrial structure.
Disclosure statement
No potential conflict of interest was reported by the authors.
References
- Boyd, G. A., & Curtis, E. M. (2014). Evidence of an ‘energy-management gap’ in U.S. manufacturing: Spillovers from firm management practices to energy efficiency. Journal of Environmental Economics and Management, 68(3), 463–479. https://doi.org/10.1016/j.jeem.2014.09.004
- Cai, W. G., & Zhou, X. L. (2017). Dual effect of Chinese environmental regulation on green total factor productivity. Economist, 9, 27–35.
- Cha, J. P. (2015). Empirical study of environmental regulation and industrial economic growth pattern: An economic growth decomposition perspective. Industrial Economics Research, 3, 92–101. (In Chinese.)
- Dong, M. J., Liang, Y. M., & Li, G. (2011). Impact of environmental regulation on China’s export competitiveness – Based on the input-output model. China Industrial Economics, 3, 57–67. (In Chinese.)
- Elhorst, J. (2014). Spatial econometrics. From Cross-Sectional Data to Spatial Panels. https://doi.org/10.1007/978-3-642-40340-8.
- Gan, C. H., Zheng, R. G., & Yu, D. F. (2011). An empirical study on the effects of industrial structure on economic growth and fluctuations in China. Economic Research Journal, 46, 4–16. (In Chinese.)
- Hamamoto, M. (2006). Environmental regulation and the productivity of Japanese manufacturing industries. Resource and Energy Economics, 28(4), 299–312. https://doi.org/10.1016/j.reseneeco.2005.11.001
- He, X. B. (2018). Environmental regulation and China’s economic growth quality – An empirical analysis based on provincial panel data. Modern Economic Science, 40, 1–10. (In Chinese.)
- Ielasi, F., Rossolini, M., & Limberti, S. (2018). Sustainability-themed mutual funds: An empirical examination of risk and performance. The Journal of Risk Finance, 19(3), 247–261. https://doi.org/10.1108/JRF-12-2016-0159
- Ji, X., Zhang, Y., Mirza, N., Umar, M., & Rizvi, S. K. A. (2021). The impact of carbon neutrality on the investment performance: Evidence from the equity mutual funds in BRICS. Journal of Environmental Management, 297, 113228. https://doi.org/10.1016/j.jenvman.2021.113228
- Kim, H. H., Lee, H., & Lee, J. (2015). Technology diffusion and host–country productivity in South-South FDI flows. Japan and the World Economy, 33, 1–10. https://doi.org/10.1016/j.japwor.2014.11.001
- Lanoie, P., Laurent-Lucchetti, J., Johnstone, N., & Ambec, S. (2011). Environmental policy, innovation and performance: New insights on the porter hypothesis. Journal of Economics & Management Strategy, 20(3), 803–842. (In Chinese.) https://doi.org/10.1111/j.1530-9134.2011.00301.x
- Ling, L., & Tao, F. (2012). Selection of optimal environmental regulation intensity for Chinese Manufacturing Industry—Based on the Green TFP Perspective. China Industrial Economics, 5, 70–82. (In Chinese.)
- Ling, L., Tao, F., & Yang, Y. (2013). The research on growth quality difference of China’s regional industry—based on convergence analysis of green total factor productivity. Economic Survey, 2013(4), 10–15. (In Chinese.)
- Liu, H. W., Zheng, S. L., & Zuo, W. L. (2016). The influence mechanism of environmental regulation on TFP of enterprises. Science Research Management, 37, 33–41. (In Chinese.)
- Lobato, M., Rodríguez, J., & Romero, H. (2021). A volatility-match approach to measure performance: The case of socially responsible exchange traded funds (ETFs). The Journal of Risk Finance, 22(1), 34–43. https://doi.org/10.1108/JRF-04-2020-0066
- Naqvi, B., Mirza, N., Rizvi, S. K. A., Porada-Rochoń, M., & Itani, R. (2021). Is there a green fund premium? Evidence from twenty seven emerging markets. Global Finance Journal, 50, https://doi.org/10.1016/j.gfj.2021.100656
- Preacher, K. J., & Hayes, A. F. (2008). Asymptotic and resampling strategies for assessing and comparing indirect effects in multiple mediator models. Behavior Research Methods, 40(3), 879–891. https://doi.org/10.3758/BRM.40.3.879
- Qi, Y., Lu, H. Y., & Zhang, N. C. (2016). Can environmental regulation achieve Win-Win of ‘reducing pollution’ and ‘increasing performance’? Evidence from key environmental protection cities with ‘compliance’ and ‘non-compliance’ quasi-experimental. Finance & Trade Economics, 37, 126–143. (In Chinese.)
- Rizvi, S. K. A., Naqvi, B., & Mirza, N. (2021). Is green investment different from grey? Return and volatility spillovers between green and grey energy ETFs. Annals of Operations Research, 305, 1–30. https://doi.org/10.1007/s10479-021-04367-8
- Tao, R., Su, C.-W., Naqvi, B., & Rizvi, S. K. A. (2022). Can Fintech development pave the way for a transition towards low-carbon economy: A global perspective. Technological Forecasting and Social Change, 174. https://doi.org/10.1016/j.techfore.2021.121278
- Umar, M., Ji, X., Mirza, N., & Rahat, B. (2021). The impact of resource curse on banking efficiency: Evidence from twelve oil producing countries. Resources Policy, 72, 102080. https://doi.org/10.1016/j.resourpol.2021.102080
- Umar, M., Rizvi, S. K. A., & Naqvi, B. (2021). Dance with the devil? The nexus of fourth industrial revolution, technological financial products and volatility spillovers in global financial system. Technological Forecasting and Social Change, 163, 120450. https://doi.org/10.1016/j.techfore.2020.120450
- Wang, Q. Y., & Lu, F. Z. (2018). Can environmental regulation boost China's high-quality economic development – Empirical test based on inter provincial panel data. Journal of Zhengzhou University (Philosophy and Social Sciences Edition), 51, 64–70. (In Chinese.)
- Wu, W. P., & He, Q. (2017). Forced pollution ‘reduction’ or ‘regressive’? Threshold characteristic and spatial spillover of pollution reduction effect from environmental regulation. Business Management Journal, 39, 20–34. (In Chinese.)
- Xiao, T., & Liu, H. (2014). Empirical study on industrial structure adjustment and energy conservation. Economist, 26(9), 58–68. (In Chinese.)
- Xiong, Y. (2011). Research on the relationship between environmental regulation and economic growth based on the provincial data in China. China Population. Resources and Environment, 21, 126–131. (In Chinese.)
- Yang, C. H., Tseng, Y. H., & Chen, C. P. (2012). Environmental regulations, induced R&D, and productivity: Evidence from Taiwan’s manufacturing industries. Resource and Energy Economics, 34(4), 514–532. https://doi.org/10.1016/j.reseneeco.2012.05.001
- Yu, D. H., & Sun, T. (2017). Environmental regulation, skill premium and international competitiveness of manufacturing industry. China Industrial Economics, 5, 35–53. (In Chinese.)
- Yu, Y. Z., Yang, X. Z., & Zhang, S. H. (2019). Research on the characteristics of time and space conversion of China’s economy from high-speed growth to high-quality development. The Journal of Quantitative & Technical Economics, 36, 3–21. (In Chinese.)
- Yu, B. (2020). Industrial structure, technological innovation, and total-factor energy efficiency in China. Environmental Science and Pollution Research International, 27(8), 8371–8385. https://doi.org/10.1007/s11356-019-07363-5
- Zhang, J., Wu, G., & Zhang, J. (2004). The Estimation of China’s provincial capital stock: 1952–2000. Economic Research Journal, 2004(10), 35–44. (In Chinese.)
- Zhang, Y., Ma, F., & Wang, Y. (2019). Forecasting crude oil prices with a large set of predictors: Can LASSO select powerful predictors? Journal of Empirical Finance, 54, 97–117. https://doi.org/10.1016/j.jempfin.2019.08.007