
 ?Mathematical formulae have been encoded as MathML and are displayed in this HTML version using MathJax in order to improve their display. Uncheck the box to turn MathJax off. This feature requires Javascript. Click on a formula to zoom.
Abstract
This study constructs an oligopoly model in public utilities sector to explore the optimal privatisation policy and the factors affecting equilibrium outcomes and explores the optimal proportion of state-owned shares. We also offer empirical evidence of China’s public utilities from 1985 to 2019 to prove the applicability of model results. The results show that, depending on product differentiation, cost variance, technical level, nationalisation, partial or full privatisation can be optimal. Improving capital efficiency increases social welfare in Model PP, but not in Model PS. Product differentiation improves social welfare at the expense of profits in SS model. In Model PM, technical improvements boost private enterprise profits but induce a decrement in social welfare. A high proportion of state-owned shares fail to improve social welfare in Model SM. In a word, the value range of parameters and competition modes in public utilities sector affect market players’ welfare distribution, which identifies with the empirical analysis of China’s public utilities development.
1. Introduction
Since the 1970s, a wave of privatisation has occurred in the public utilities market worldwide (e.g., Bulow et al., Citation1983; Stigler, Citation1971). The target utility sectors are expanded from transportations (e.g., airlines and railways) to energy industries (e.g., water, electricity, and natural gas), postal service, higher education, and so on. Nevertheless, state-owned enterprisesFootnote1 (SOEs) are still significant market participants in competition which play a key role in global economic arena. In general, the public utility reform in China contains four stages: full nationalisation, preliminary privatisation, comprehensive privatisation, and renationalisation. Privatisation indeed makes great achievements in relieving financial pressures, meeting the demands of rapid urbanisation and industrialisation, and enhancing efficiency in the beginning. However, because of the blurred boundaries between government and market, several countries face a series of developing problems, such as the contradiction of economic efficiency and social accountability, private monopoly, and democracy deprivation. The shift from over-reliance on the government to overemphasising market leads to the stagnation of public utility reform. Therefore, this study aims to untangle the boundary between the government and the market and solves the trade-off between economic efficiency and social goal under different oligopolistic competitions.
Public utility is responsible for maintaining public infrastructures and providing public services to citizens and service users, which affects the national livelihood and social stability. Considering the special characteristics (e.g., natural monopoly, fundamentality, and political sensitivity) and avoiding free-riding, the public utilities supply is undertaken by the authority generally. But the rapid growth in public utilities demand results in financial deficit and insufficient supply. And many countries carry out market-oriented reforms to public utilities to weaken the government’s role.
However, some critics argue that privatisation may lead to economic instability, aggravating the exploitation of minority shareholders by large shareholders and damaging state-owned assets (e.g., Tan et al., Citation2020). The fundamental difference between private enterprises and SOEs is their goals. The former pursues maximum profit, whereas the latter pursues maximum social welfare. The former is generally believed to be more efficient. Thus, can mixed-ownership be an effective way of reform? If so, what is the optimal proportion of state-owned shares? Furthermore, what are the factors influencing privatisation? Based on the above intensive academic debate, our analysis attempts to determine the optimal state-owned shares in public utilities privatisation reform.
The main contributions of this study are as follows: First, few studies focus on the privatisation reform of public utilities. This article takes public utilities as a study object to supplement the existing literature. Second, we build two-stage theoretical models under symmetric and asymmetric differentiated duopolies with different ownership structures, compensating for the lack of different competition modes and ownership arrangements. Third, this study considers the case of increasing returns to scale and capital efficiency variance. Moreover, the model internalises product differentiation, cost efficiency, and production technology in a dynamic game. We find that, depending on product differentiation, cost efficiency, and technical level among enterprises, nationalisation and partial or full privatisation can be optimal. Social welfare increases with product differentiation and capital efficiency in the pure private enterprises (PP) model but fails to increase in the private and state-owned enterprises (PS) model. A high proportion of state-owned shares cannot improve social welfare under the state-owned and mixed-ownership enterprises (SM) model. The profit in the PP model is always higher than that of the pure state-owned enterprises (SS) model, regardless of the value range of parameters. Therefore, ownership arrangements and market structure dramatically affect the welfare distributions among players, which are crucial in choosing the optimal privatisation policy.
The remainder of this paper is organised as follows. Section 2 briefly reviews the related literature. Section 3 introduces the methodology and sets up the oligopoly model, and the models results are then provided in Section 4. Section 5 compares the equilibrium outcomes in the six scenarios. Section 6 extends the research by exploring the optimal proportion of state-owned shares. Section 7 offers the empirical analysis of China’s public utilities development and discusses the theoretical and practical results. The conclusions and future direction are presented in Section 8.
2. Literature review
So far, the academic debate on public utilities governance is still dominated by the controversy about the influences of private sector participation on efficiency and equity. (e.g., Bajra et al., Citation2021; Corneo & Jeanne, Citation1994; Pal & White, Citation1998). There is still no consensus on which mode of public utility reform is the most effective. Research on ownership structure (national, private, or mixed) in public utilities (e.g., Bel et al., Citation2010; Boardman & Vining, Citation1989; Rodrigues & Tavares, Citation2017) aims to examine whether privatisation can improve utility performance (e.g., Guerrini et al., Citation2018; Monteduro, Citation2014). However, some sampled countries disclose the failure of privatisation (e.g., Mayne & Vigoda-Gadot, Citation2018; Warner & Aldag, Citation2021; Warner & Hefetz, Citation2008). Meanwhile, the empirical outcomes have not obtained corner or interior solutions regarding the relationship between ownership structure and efficiency (e.g., Peters et al., Citation2014; Voorn et al., Citation2017). The practical results show that neither exclusive nationalisation nor exclusive privatisation in public utilities is ideal. Therefore, local administrations attempt to adopt mixed forms of public utilities to enjoy the flexibility of private ownership without lacking government’s supervision (e.g., Da Cruz & Marques, Citation2012).
Some scholars maintain that the government-leading mode would bring inefficiency owing to political goals. The management of state-owned assets is restricted by government agents which are liable to cause profit shrinkage (e.g., Megginson & Netter, Citation2001) and erosion of state assets (e.g., Shleifer & Vishny, Citation1994). The SOEs’ performance and mixed market efficiency are inferior to those of a pure private situation (e.g., De Fraja & Delbono, Citation1989; Citation1990). Furthermore, Matsumura (Citation1998) finds that full privatisation can be optimal under moderate conditions. Thus, privatising SOEs is necessary to improve SOEs’ performance (e.g., Boycko et al., Citation1994; Shleifer, Citation1998; Vining & Boardman, Citation1992). Other scholars suggest that partial privatisation or full nationalisation is optimal (e.g., Jain & Pal, Citation2012). Under dynamic economic conditions (e.g., Bárcena-Ruiz, Citation2012; Bárcena-Ruiz & Garzón, Citation2020; Lee & Wang, Citation2018; Matsumura et al., Citation2009; Sato & Matsumura, Citation2019), privatisation may not always improve social welfare (e.g., Anderson et al., Citation1997; Fujiwara, Citation2007). Consequently, different economic contexts contribute to different outcomes, indicating that ownership structure alone cannot explain economic efficiency and enterprise performance.
Many scholars take the perspective of enterprises in utilities market or local government exclusively. Thus, it is necessary to expand the perspective of public utility reform. In this respect, some experts (e.g., Casadevall, Citation2016) believe that the balance between economic and political goals needs a shift from the previous state-centric or market-oriented patterns to pluralism governance mode, where all players (governments, related utilities, non-governmental institutions, and citizens) can participate with their roles through the competition mechanism. Moreover, many studies investigate privatisation by building the oligopoly model (e.g., Correia-da-Silva & Pinho, Citation2018; Nie, Citation2014; Tao et al., Citation2018; Wang et al., Citation2019), but fail to take more competitive modes into account. Despite its explanatory power and applicability, the oligopoly model has few applications in utility reform in existing studies. Inspired by this, our analysis sets six types of oligopolistic competitions (PP, SS, MM, PS, PM, and SM) in the public utilities market. Furthermore, to enhance the reliability and robustness of the outcomes, we consider the product differentiation, cost variance, and technology level.
3. Methodology and model
Oligopoly model provides mathematical tools and models for exploring multiperson strategic decision making, where the players compete for limited resources in the market. It allows for modeling conflicting situations and for predicting the probable behaviours of participants. Therefore, the oligopoly model is established in the paper to explore different privatisation policies of public utilities sector under various competitive contexts.
Consider a public utilities market with two enterprises (Enterprise 1 and Enterprise2). Assume there are three forms of ownership, private, state-owned, and mixed-ownership, which comprise three types of symmetric market models: pure private enterprises (PP), pure state-owned enterprises (SS), and mixed-ownership enterprises (MM), and three types of asymmetric market models: private and state-owned enterprises (PS), private and mixed-ownership enterprises (PM), and state-owned and mixed-ownership enterprises (SM).
The public utilities market is dominated by the government, and its products are almost homogeneous. To explore the impact of product differentiation on privatisation policy, the inverse demand function is (e.g., Chen et al., Citation2020; Spence, Citation1976; Wang et al., Citation2019), where
is the output and
is a positive constant;
is the product homogeneity (the greater
is, the smaller the product differentiation);
and
The goals of private, state-owned, and mixed-ownership enterprises are set as maximising profits, social welfare, and respectively.
is social welfare, and
is the proportion of state-owned shares. The assumption of increasing returns to scale in utilities sector contrasts with the conventional method. Thus, we denote the cost functions of the three types of enterprises as
and
where
is the technical level, and
and
are the marginal costs of private and SOEs. To reflect the advantages of efficient private capital, we assume
indicating a lower efficiency of SOEs. Otherwise, it would be meaningless to introduce private capital into public utilities sector. Furthermore, the enterprise’s profits can be described as
and the social welfare function is
(e.g., Chen, Tang et al., Citation2019; Chen, Wang et al., Citation2019; Chen et al., Citation2022), where
is consumer surplus (e.g., Fanti, Citation2016; Hackner, Citation2000; Singh & Vives, Citation1984).
Based on the above hypotheses, backward induction is used to analyse the equilibrium results in six duopoly models and investigate the impacts of product differentiation, capital efficiency, technical level, and the optimal proportion of state-owned shares.
4. Results
4.1. The model PP
In Model PP, the two private enterprises determine their outputs for profit maximisation. From the equilibrium quantities are derived as:
(1)
(1)
To satisfy and
we obtain
when
and
and
when
Proposition 1 can be obtained by analysing how the values of
and
affect the equilibrium results.
Proposition 1.
In Model PP, the values of
and
have the following effects on the equilibrium outcomes.
Effect of
Effect of
Effect of
Proof.
See Supplementary Materials A
As shown in Proposition 1, both and
are negatively related to
and
indicating that reducing production costs and providing differentiated products will improve the welfare of producers and consumers. When the products are heterogeneous, enterprises can obtain the maximum profits. Furthermore, if the technical level is sufficiently strong, the equilibrium profit and social welfare will be enhanced. In summary, product differentiation, cost efficiency, and technical level are all monotone with the equilibrium results. Therefore, enterprises should be encouraged to improve their technical levels through technological innovation. It is wise to adopt a product differentiation strategy to gain a higher market share, which can ultimately increase profits and improve social welfare.
4.2. The model SS
Standard calculation for gives
(2)
(2)
From
is obtained. Then Proposition 2 is presented as follows.
Proposition 2.
In Model SS, when , the values of
and
have the following effects on the equilibrium outcomes.
Effect of
Effect of
Effect of
Proof.
See Supplementary Materials B
The intuitions of Proposition 2 are as follows. As the product differentiation level decreases, the profits of SOEs increase, but it is harmful to consumers and society. Growth at the technical level will improve consumer surplus, which compensates for the decrease in profits. Thus, social welfare finally increases. Furthermore, the profit under SS model is negative, indicating that government subsidies are required to maintain the normal operation. A decrease in product differentiation can increase profits, relieving financial support from government.
Compared with Proposition 1, the effects of
and
on profits are different. These changes mean that ownership structure directly affects the relationship between the enterprise performance and welfare distribution. Overall, only cost efficiency is always positive with equilibria. Therefore, SOEs, as the major supplier in public utilities sector, should consider the trade-off between fiscal subsidies and social welfare. If the government chooses to reduce the financial burden, SOEs should be stimulated to produce homogeneous products.
4.3. The model MM
After the standard calculation, Proposition 3 is formed as follows.
Proposition 3.
In Model MM, when , the values of
and
have the following effects on the equilibrium outcomes.
Effect of
Effect of
Effect of
Effect of
Effect of
If then
if
then
If then
if
then
If then
if
then
Proof.
See Supplementary Materials C
Proposition 3 implies that if the capital efficiencies of private and state are sufficiently low, the MM competition mode will reduce the profits and consumer surplus, then social welfare is suppressed simultaneously. If the technical level is sufficiently high, the MM competition mode will boost enterprise profits, consumer surplus, and social welfare. This conclusion is consistent with Proposition 1. Moreover, producing completely heterogeneous products is the best choice for both managers and policymakers to maximise profit, consumer surplus, and social welfare.
The measures should be taken to encourage semi-public enterprises to produce fully heterogeneous products. The relationships between and
and
are non-monotonic. Thus, whether privatising mixed-ownership enterprises depends on economic and political objectives. In contrast to Proposition 2, efficient private capital is beneficial to all parties in the market.
4.4. The model PS
In Model PS, we obtain the equilibrium results and further deduce Proposition 4.
Proposition 4.
In Model PS, when
, and
, the values of
and
have the following effects on the equilibrium outcomes.
Effect of
Effect of
If then
if
then
Under the condition of if
and
then
if
and
then
If then
if
then
iii. Effect of
iv. Effect of
Proof.
See Supplementary Materials D
As shown in Proposition 4, reducing the costs of SOEs improves the welfare of producers and consumers. However, the effects of private capital efficiency are complex. Whether the impacts are positive or negative depends on the value of For example, if
then
is negatively correlated with
and private enterprises earn more profits by decreasing costs. Growth at technical level suppresses the unit production cost and increases social welfare. When products of two enterprises are completely homogenous, the enterprises can obtain maximum profits.
In conclusion, increasing investment at the technical level has a positive effect in Model PS. Enterprises can reduce production costs to expand profit margins and improve social welfare. Furthermore, a low efficiency of SOEs inhibits economic benefits and undermines social welfare. Thus, the government should permit efficient private capital to enter the public sector to stimulate market vitality.
4.5. The model PM
In Model PM, from the equilibrium outcomes, Proposition 5 can be obtained as follows.
Proposition 5.
In Model PM, the values of
and
have the following effects on the equilibrium outcomes.
Effect of
Effect of
Effect of
Effect of
Effect of
If and
then
if
and
then
When if
then
if
then
Proof.
See Supplementary Materials E
Proposition 5 implies that under Model PM, excessively high production cost reduces private enterprise profits, consumer surplus, and social welfare. The effect of state-owned capital efficiency on mixed-ownership enterprises is intricate. We note that product differentiation improvements can boost mixed-ownership enterprise’s profits and social welfare. Moreover, a high proportion of state-owned shares is not necessarily helpful in improving social welfare. Compared with Proposition 4, considerable changes occur in how affects
and
is no longer completely negatively correlated with
These changes are attributable to a shift in enterprise ownership arrangements.
In conclusion, increasing the technical level is an important corporate strategy. With the capital efficiency gap of private and state-owned narrowed, decision-makers of private and mixed-ownership enterprises should lower unit costs, which is helpful to gain more returns and social welfare. Moreover, blindly increasing the proportion of state-owned shares is undesirable.
4.6. The model SM
Standard calculation in Model SM gives the equilibria, and Proposition 6 is derived.
Proposition 6.
In Model SM, the values of
and
have complicated effects on the equilibrium outcomes.
Effect of
If
and
If
Effect of
If
If
Effect of
If and
then
if
then
iv. Effect of
If
and
then
if
and
then
Under the condition of if
or
and
or
then
if
or
and
then
v. Effect of
When if
then
if
then
If
then
When and
if
then
if
then
When
and
if
then
if
then
When
and
there is
When
and
there is
Proof.
See Supplementary Materials F
The implications of Proposition 6 are as follows. Private and state-owned marginal costs have complicated relationships with
and
Meanwhile,
is negatively correlated with
and
indicating that technical improvements restrain the growth of SOEs’ profits and social welfare under these circumstances. However, the correlations of
and
and
differ depending on the value ranges of parameters and competition modes. Full product homogeneity is the optimal choice to maximise consumer surplus and social welfare. However, a low degree of privatisation impairs social welfare.
Compared with the PS and PM models, the factors have more complex effects on the equilibrium results in Model SM. The complete positive correlation between and
in Model PS becomes uncertain. The uncertain relationship between
and
under Model PM is replaced with a positive correlation. In conclusion, the technological and capital efficiency differences, especially ownership arrangements, significantly impact enterprise performance.
5. Comparisons
To search for ownership boundaries, in this section, we compare three types of symmetric competition equilibria (PP, SS, MM) and three asymmetric competition equilibria (PS, PM, SM).
5.1. Symmetric situations
First, we provide the following definitions.
Proposition 7.
Comparison of profits for the three types of models:
Comparison of consumer surplus for the three types of models:
If and
then
if
then
When and
if
or
then
if
then
iii. Comparison of social welfare for the three types of models:
If or
then
if
then
When if
then
if
and
then
If and
then
if
and
then
if
and
then
Under the conditions of or
if
then
if
then
if
then
Proof.
See Supplementary Materials G
From Proposition 7, we note that these parameters are interconnected and constrained to cause the complexity of the optimal strategy.
In terms of profit, the enterprise will obtain the maximal profit in Model PP. The profit is relatively low with the goal of maximising Thus, the pursuit of social welfare results in lower profits. The above conclusions indicate that increasing the proportion of private capital can improve equilibrium profits.
The comparisons of consumer surplus for the three modes depend on the values of parameters. Specifically, when and
the SS monopoly is superior to the PP monopoly. Moreover, the consumer surplus under Model MM is superior to that under Model PP and is not affected by capital efficiency.
In terms of social welfare, although private enterprises pursue profit maximisation, it does not mean that private capital causes damage to social welfare. For example, when and
social welfare in Model PP will be higher than that in Model MM. Compared with the Model SS, even if SOEs have the advantage of pursuing the maximisation of social welfare, they are not always better than the pure private oligopoly. The issue of welfare allocations is affected by both market structure and ownership form.
5.2. Asymmetric situations
Proposition 8.
Comparison of profits for the three types of models:
Comparison of consumer surplus for the three types of models:
When if
then
if
then
iii. Comparison of social welfare for the three types of models:
When
if
if
then
Proof.
See Supplementary Materials H
The features under Proposition 8 are similar to those in Proposition 7. Specifically, the determination of the optimal strategy depends on the value ranges of parameters that interact with each other, resulting in the complexity of the analysis.
In terms of profit, the pursuit of social welfare leads to a lower profit. However, the profits of PS and PM are both higher than that of SM, which is not related to capital efficiency, as mentioned in Proposition 4. Because SOEs and mixed-ownership enterprises concern about social welfare, which attempts to achieve some political objectives .
The comparison of consumer surplus under PS and PM models also relies on the value range of parameters. The consumer surplus under SM monopoly is superior to that of PM monopoly, which is not affected by capital efficiency. In addition, a decrease in the degree of privatisation can enhance consumer welfare.
Referring to social welfare, the private capital and state-owned capital are not two contradictory forces from the perspectives of economic return and social welfare. Model PM is better than PS in terms of social welfare. Therefore, either private or state-owned capital would bring more profits or welfare, which is related to the economic factors, market environment, and policymaker’s intentions.
6. Extensions
Based on the above discussion, we further investigate the optimal proportion of state-owned shares () under MM, PM, and SM models. Proposition 9 can be obtained by analysing enterprises’ social welfare maximisation.
Proposition 9.
If
If
If
If
When
Proof:
See Supplementary Materials I
As shown in Proposition 9, according to social welfare maximisation, we find that nationalisation, partial privatisation, or even full privatisation can be the optimal privatisation strategy in public utilities sector. When state capital is sufficiently efficient, full nationalisation can maximise social welfare. However, if state capital is not efficient sufficiently, it is reasonable to carry out partial or full privatisation. In addition, we note that the optimal proportions of state-owned shares are different under different oligopoly models.
7. Discussion – evidence from China
To illustrate the explanatory power of model analysis in reality, we employ the example of Chinese public utilities reform in discussion.
7.1. The process of Chinese public utilities reform
These are four stages in China’s public utilities privatisation reform.
7.1.1. Full nationalisation (1954--1984)
In highly centralised planned economy, the Chinese government controlled the supply of public products fully. The production plans of SOEs must subject to administrative instructions which served the national industrialisation strategy, including the construction of railway, highway and so on. Because of lack of incentives and low efficiency, public goods are generally of poor quality.
7.1.2. Preliminary privatisation (1985-2002)
With implementing the reform and opening up policy, several cities tried to break administrative monopoly in urban public utilities. The public utilities institutions affiliated to the government transform to independent enterprises, realising “the separation of government and enterprise”. However, the subsidy from the government to the enterprises engaged in public utilities formed a heavy fiscal burden during this period.
7.1.3. Comprehensive privatisation reform (2003-2015)
Considering the increasingly growing demand in public utilities, China launched the privatisation. The private enterprises and mixed-ownership enterprises became the important participants in public utilities market. Nevertheless, the problems, such as regulatory difficulties of authority, have reignited debates over privatisation versus nationalisation, economic efficiency versus social responsibility.
7.1.4. Renationalisation (2016--2019)
China’s public utilities return to nationalisation and anti-privatisation. When the practice of neoliberalism in public utilities caused fiscal deterioration, instead of economic growth (Chang, Citation2002), new keynesianism advocating government intervention drew the attentions of scholars and policymakers. Because of the imperfect market in reality, government regulation is required to maintain smooth market running.
7.2. Empirical analysis
Combining with the reform process of urban public utilities in China, the empirical analysis is designed to investigate the relationship between privatisation and development of public utilities.
7.2.1. Data
The measurement of urban public utilities development and privatisation are relatively complicated. The former involves foundation industries such as water, electricity, heat and transportation in urban production. The latter contains various dimensions (product supply quantity, price and input-output benefit). Drawing on the existing research practices (e.g., Jiang & Zhu, Citation2004), we use the related data issued by China Statistical Yearbook, China Urban Construction Statistical Yearbook and Wind Database from 1985 to 2019 as the sample data. The initial sample is processed as follows: (i) standardising the data according to where
is the initial data of
and
are the maximum value and minimum value of
respectively; (ii) calculating the index weights of the development level of urban public utilities by entropy method.
To be specific, variable proportion is defined as the entropy of
is expressed as
then the weight of
is
Inspired by Yan et al. (Citation2012), Wang et al. (Citation2013), the development level index and privatisation level index of urban public utilities are provided in .
Table 1. Variable definitions.
Except to 2016-2019, the initial data and the first order difference values during 1985-2002 and 2003-2015 has passed Fisher-ADF test.
7.2.2. Empirical model
To examine the relationship between urban public utilities development and privatisation level, we construct the following regression model.
where
represents the development level of urban public utilities, and the explanatory variable
denotes the privatisation level in urban public utilities,
is regression coefficient,
is time, and
is constant.
7.2.3. Regression results
demonstrates the regression results of the relationship between urban public utilities development and privatisation level during 1985-2002 and 2003-2015.
Table 2. Regression results.
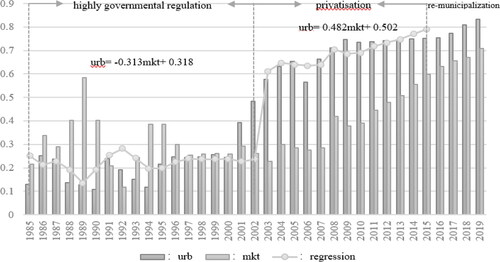
Only Model (2) has passed the EG two-step cointegration test (e.g., Engle &Granger, 1987). It indicates that there is a long-term stable equilibrium relationship from 2003 to 2015. The results show that the regression coefficient on is significantly positive at the 1% level, which manifests that privatisation level is positively and significantly related to the development level of China’s urban public utilities. This positive relationship is in line with the Proposition 3 and Proposition 5, showing that the full privatisation reform boosts China’s urban public utilities development during 2003-2015. In fact, after a long time of highly government regulation, Chinese urban public utilities sector faces numerous management problems (low efficiency, supply shortage and so on), which require the market power to obtain new motivations. Therefore, the privatisation policy improves the public utilities development by market mechanism in this period.
In 1985-2002, although the regression coefficient on is not significant, the negative effect of privatisation level on China’s urban public utilities is supported by Proposition 3 and Proposition 6. It suggests that the decrement of proportion of state-owned shares would hinder China’s urban public utilities development. Chinese society is undergoing a rapid transformation period in 1985-2002, in which a low technical level and weak economic foundation lead to less development in urban public utilities. Because of the scarcity of resources, the production in public utilities depending on administrative instructions is conducive to rational allocation of resources. Therefore, the strong government regulation promotes public utilities significantly.
However, in 2016-2019, the unstable relationship between and
indicates that China’s urban public utilities is facing development bottlenecks again, which require new effective measures under the complicated economic environment. The trend of regression model is shown in .
Figure 1. The trends of the development level and privatisation level and regression modelin 1985–2019 in China.
Source: own calculations.
7.3. Discussion
The reform of public utilities in China during the past 35 years have roughly experienced four stages, which includes the state administrative monopoly, government intervention, privatisation reform, government and market cooperation. The evolution process represents the competition modes of SS, SM, PS, PM, MM and PP, and even more complex. The empirical analyses of three periods (1985-2002, 2003-2015, 2016-2019) are consistent with the theoretical results. Specifically, the privatisation level is negatively with public utilities performance in 1985-2002 and positively in 2003-2015. It indicates that the effect of proportion of state-owned shares on enterprise profits and social welfare relying on parameter values. For example, the inverted U relationship between privatisation level and public utilities development attribute to the changing efficiencies of state and private capital, which is in line with Proposition 4 and Proposition 6. With the improvement of technological level and national economy, strictly government intervention would curb public utilities’ progress during the period of 2003-2015. As Proposition 1 and 3 say, privatisation policy is a right way in settling the stalled development of public utilities. However, China’s public utilities falls into adjustment stage again in recently years. The changing factors (capital efficiency, technological level, consumer preference and so on) cause unstable development trend reflected in theoretical propositions and practical performances. Moreover, the whole process of China’s public utilities development just prove the correctness of Proposition 9 that nationalisation, partial or full privatisation can be the optimal reform strategy. In other words, over-reliance on single power (government or market) is not conducive to the long-term development of public utilities. So the theoretical results are well supported in the empirical study of public utilities in China.
8. Conclusions
This study establishes an oligopoly model in public utilities to investigates equilibria in different ownership structures (PP, SS, MM, PS, PM, SM) and explores the privatisation policy. Furthermore, we also offer strong empirical evidence to prove the applicability of model results. Our main findings are as follows. First, product differentiation, cost variance, and technical level impact the equilibrium results of the different competition models. In Model PP, improvements in product differentiation and marginal costs lowers profits, consumer surplus, and social welfare. In Model SS, supplying completely homogeneous products can improve consumer surplus and social welfare. However, the correlations between the proportion of state-owned shares and profit, consumer welfare, and social welfare are non-monotonous, depending on the production conditions and game environment. In Model PS, reducing production costs can improve social welfare only when the technical level satisfies certain conditions. In Model PM, technical improvements increases private enterprise profits and consumer surplus but induces a decrease in social welfare. Overall, the impacts of the above factors are more complicated in asymmetric situations, which present conformity with the process of China’s public utilities development. These conclusions have certain significance for managers to conduct the right strategies and for the government to decide whether to privatise the SOEs, based on the different objective functions.
Second, the comparisons of profits, consumer surplus, and social welfare in symmetric and asymmetric markets are affected by product differentiation, cost efficiency, and technical level, resulting in the complexity of the optimal privatisation policy. In situations of symmetry, the profits in the PP and MM monopolies are higher than those in Model SS, which means that a high proportion of private capital can enhance enterprise profits. In asymmetry models, enterprises can obtain maximal profits under Model PM. The lowest profits of Model SM indicate that the participation of state capital deviates from profit maximisation. In terms of social welfare, although private enterprises are not social welfare maximisers, their efficiency advantage can offset the disadvantage of improving social welfare. Thus, the participation of private capital can ultimately increase social welfare under certain circumstances in both symmetric and asymmetric cases. Therefore, the government should consider the comparative advantages of the two types of capital when formulating privatisation policies and constructing an efficient market structure.
Third, the proportion of state-owned shares is non-monotone with the equilibrium results, and nationalisation and partial or full privatisation can be the optimal policy in public utilities sector. The empirical study of China’s public utilities is good practical evidence. When state capital is sufficiently efficient, full nationalisation can maximise social welfare. The empirical study of China’s public utilities during 1985-2002 shows that implementing privatisation blindly is irrational. Both the model and empirical analyses indicate that SOEs should absorb high-quality private capital into public utilities under certain conditions (2003--2015), making full use of the positive effects of the different types of capital to promote development. Furthermore, the ownership arrangements and capital efficiency variances play key roles in determining the optimal privatisation policy.
There are still some limitations that need to be resolved in the future. First, we only study the case of two enterprises in one country, which can be extended to multi-enterprise competition. Second, the study does not consider the peculiarities of different types of public utilities; it is necessary to study the privatisation of a specific public utility industry and conduct comparative studies on the privatisation of different types of public utilities. Third, the article divides corporate equity into state-owned and private shares, but state-owned and private shares can also be further divided into different types in reality. Therefore, refinement of equity is worthy of in-depth study in the future.
Disclosure statement
No potential competing interest was reported by the authors.
Additional information
Funding
Notes
1 Without loss of generality, the paper defines the enterprises owned by government as state-owned enterprises (SOEs),which is based on modern property rights (e.g., Bruton et al., Citation2015; Kim, Citation2005).
References
- Anderson, S. P., de Palma, A., & Thisse, J. F. (1997). Privatization and efficiency in a differentiated industry. European Economic Review, 41(9), 1635–1654. https://doi.org/10.1016/S0014-2921(97)00086-X
- Bajra, U. Q., Krasniqi, A., & Podvorica, A. (2021). Privatisation of socially owned enterprises, the methods used and the impact on economic growth: Empirical evidence from Kosovo. Economic Research-Ekonomska Istraživanja, 1–18. https://doi.org/10.1080/1331677X.2021.1893201
- Bárcena-Ruiz, J. C. (2012). Privatization when the public firm is as efficient as private enterprises. Economic Modelling, 29(4), 1019–1023. https://doi.org/10.1016/j.econmod.2012.03.011
- Bárcena-Ruiz, J. C., & Garzón, M. B. (2020). Partial privatization in an international mixed oligopoly under product differentiation. Journal of Economics, 131(1), 77–100. https://doi.org/10.1007/s00712-020-00701-z
- Bel, G., Fageda, X., & Warner, M. E. (2010). Is private production of public services cheaper than public production? A meta-regression analysis of solid waste and water services. Journal of Policy Analysis and Management, 29(3), 553–577. https://doi.org/10.1002/pam.20509
- Boardman, A. E., & Vining, A. R. (1989). Ownership and performance in competitive environments: A comparison of the performance of private, mixed, and state-owned enterprises. The Journal of Law and Economics, 32(1), 1–33. https://doi.org/10.1086/467167
- Boycko, M., Shleifer, A., & Vishny, R. W. (1994). Voucher privatization. Journal of Financial Economics, 35(2), 249–266. https://doi.org/10.1016/0304-405X(94)90006-X
- Bruton, G. D., Peng, M. W., Ahlstrom, D., Stan, C., & Xu, K. (2015). State-owned enterprises around the world as hybrid organizations. Academy of Management Perspectives, 29(1), 92–114. https://doi.org/10.5465/amp.2013.0069
- Bulow, J. I., Geanakoplos, J., & Klemperer, P. D. (1983). Multimarket oligopoly [Cowles Foundation Discussion Papers, 674].
- Casadevall, S. R. (2016). Improving the management of water multi-functionality through stakeholder involvement in decision-making processes. Utilities Policy, 43, 71–81. https://doi.org/10.1016/j.jup.2016.04.015
- Chang, H. J. (2002). Kicking away the ladder: Development strategy in historical perspective. Anthem.
- Chen, J., Shi, J., & Liu, J. (2022). Capacity sharing strategy with sustainable revenue-sharing contracts. Technological and Economic Development of Economy, 28(1), 76–100. https://doi.org/10.3846/tede.2021.16030
- Chen, J., Tang, H., & Liu, J. (2019). Duopoly, optimal proportion of state-owned shares and international cross-ownership. Revista de Cercetare si Interventie Sociala, 64, 352–365. https://doi.org/10.33788/rcis.64.26
- Chen, J., Wang, M., Gao, Y., & Long, Y. (2019). Duopoly, mixed ownership, and the optimal proportion of employee stocks in state-owned enterprises in China. Managerial and Decision Economics, 40(5), 550–558. https://doi.org/10.1002/mde.3025
- Chen, J., Xie, X., Liu, J., & Liu, R. (2020). Externality, product differentiation and social welfare in education market. Transformations in Business & Economics, 19(3C), 522–541.
- Corneo, G., & Jeanne, O. (1994). Oligopole mixte dans un marché commun. Annales d’Économie et de Statistique, 33, 73–90. https://doi.org/10.2307/20075937
- Correia-da-Silva, J., & Pinho, J. (2018). Collusion in mixed oligopolies and the coordinated effects of privatization. Journal of Economics, 124(1), 19–55. https://doi.org/10.1007/s00712-017-0560-6
- Da Cruz, N. F., & Marques, R. C. (2012). Mixed companies and local governance: No man can serve two masters. Public Administration, 90(3), 737–758. https://doi.org/10.1111/j.1467-9299.2011.02020.x
- De Fraja, G., & Delbono, F. (1989). Alternative strategies of a public enterprise in oligopoly. Oxford Economic Papers, 41(1), 302–311. https://doi.org/10.1016/0165-4896(89)90009-7 https://doi.org/10.1093/oxfordjournals.oep.a041896
- De Fraja, G., & Delbono, F. (1990). Game theoretic models of mixed oligopoly. Journal of Economic Surveys, 4(1), 1–17. https://doi.org/10.1111/j.1467-6419.1990.tb00077.x
- Engle, R., & Granger, C. (1987). Cointegration and error correction-representation, estimation and testing. Econometrica, 55(2), 251–276. https://doi.org/10.2307/1913236
- Fanti, L. (2016). Social welfare and cross-ownership in a vertical industry: When the mode of competition matters for antitrust policy. Japan and the World Economy, 37-38, 8–16. https://doi.org/10.1016/j.japwor.2016.02.004
- Fujiwara, K. (2007). Partial privatization in a differentiated mixed oligopoly. Journal of Economics, 92(1), 51–56. https://doi.org/10.1007/s00712-007-0267-1
- Guerrini, A., Romano, G., & Leardini, C. (2018). Economies of scale and density in the Italian water industry: A stochastic frontier approach. Utilities Policy, 52, 103–111. https://doi.org/10.1016/j.jup.2018.04.003
- Hackner, J. A. (2000). Note on price and quantity competition in differentiated oligopolies. Journal of Economic Theory, 93(2), 233–239. https://doi.org/10.1006/jeth.2000.2654
- Jain, R., & Pal, R. (2012). Mixed duopoly, cross-ownership and partial privatization. Journal of Economics, 107(1), 45–70. https://doi.org/10.1007/s00712-011-0260-6
- Jiang, Y., & Zhu, X. (2004). Research on infrastructure capital and economic growth. Management Review, 16(9), 57–62 + 64.
- Kim, J.-S. (2005). A study of reforming the state-owned enterprise of China-focusing on the reformation of the structure ownership change. The Journal of Northeast Asian Economic Studies, 17(2), 83–116.
- Lee, J.-Y., & Wang, L. F. S. (2018). Foreign competition and optimal privatization with excess burden of taxation. Journal of Economics, 125(2), 189–204. https://doi.org/10.1007/s00712-017-0592-y
- Matsumura, T. (1998). Partial privatization in mixed duopoly. Journal of Public Economics, 70(3), 473–483. https://doi.org/10.1016/S0047-2727(98)00051-6
- Matsumura, T., Matsushima, N., & Ishibashi, I. (2009). Privatization and entries of foreign enterprises in a differentiated industry. Journal of Economics, 98(3), 203–219. https://doi.org/10.1007/s00712-009-0091-x
- Mayne, Q., & Vigoda-Gadot, E. (2018). Symposium on the politics of local public-sector reform: A global perspective on local government reinvigoration. International Public Management Journal, 21 (3), 341–345. https://doi.org/10.1080/10967494.2018.1433938
- Megginson, W. L., & Netter, J. M. (2001). From state to market: A survey of empirical studies on privatization. Journal of Economic Literature, 39(2), 321–389. https://doi.org/10.2307/2698243 https://doi.org/10.1257/jel.39.2.321
- Monteduro, F. (2014). Public-private versus public ownership and economic performance: Evidence from Italian local utilities. Journal of Management & Governance, 18(1), 29–49. https://doi.org/10.1007/s10997-012-9235-4
- Nie, P. Y. (2014). Effects of capacity constraints on mixed duopoly. Journal of Economics, 112(3), 283–294. https://doi.org/10.1007/s00712-013-0362-4
- Pal, D., & White, M. D. (1998). Mixed oligopoly, privatization, and strategic trade policy. Southern Economic Journal, 65(2), 264. https://doi.org/10.2307/1060667
- Peters, B. G., Pierre, J., & Røiseland, A. (2014). Financial gains and value loss? The impacts of local mixed companies. Annals of Public and Cooperative Economics, 85(1), 87–102. https://doi.org/10.1111/apce.12031
- Rodrigues, M., & Tavares, A. F. (2017). The same deep water as you? The impact of alternative governance arrangements of water service delivery on efficiency. Journal of Strategic Contracting and Negotiation, 3(2), 78–101. https://doi.org/10.1177/2055563617728744
- Sato, S., & Matsumura, T. (2019). Dynamic privatization policy. The Manchester School, 87(1), 37–59. https://doi.org/10.1111/manc.12217
- Shleifer, A. (1998). State versus private ownership. Journal of Economic Perspectives, 12(4), 133–150. https://doi.org/10.1257/jep.12.4.133
- Shleifer, A., & Vishny, R. W. (1994). Politicians and enterprises. The Quarterly Journal of Economics, 109(4), 995–1025. https://doi.org/10.1111/1467-8543.00232 https://doi.org/10.2307/2118354
- Singh, N., & Vives, X. (1984). Price and quantity competition in a differentiated duopoly. The RAND Journal of Economics, 15(4), 546–554. https://doi.org/10.2307/2555525
- Spence, A. M. (1976). Product differentiation and welfare. American Economic Review, 66, 407–414. https://doi.org/10.1016/0309-586X(76)90008-X
- Stigler, G. J. (1971). The theory of economic regulation. Bell Journal of Economic and Management Science, 2(1), 3–21
- Tan, Y., Tian, X., Zhang, X., & Zhao, H. (2020). The real effect of partial privatization on corporate innovation: Evidence from China’s split share structure reform. Journal of Corporate Finance, 64, 101661. https://doi.org/10.1016/j.jcorpfin.2020.101661
- Tao, A., Wang, X. H., & Yang, B. Z. (2018). Duopoly models with a joint capacity constraint. Journal of Economics, 125(2), 159–172. https://doi.org/10.1007/s00712-018-0597-1
- Vining, A. R., & Boardman, A. E. (1992). Ownership versus competition-efficiency in public enterprise. Public Choice, 73(2), 205–239. https://doi.org/10.1007/BF00145092
- Voorn, B., Van Genugten, M. L., & Van Thiel, S. (2017). The efficiency and effectiveness of municipally owned corporations: A systematic review. Local Government Studies, 43(5), 820–841. https://doi.org/10.1080/03003930.2017.1319360
- Wang, C., Nie, P. Y., & Cui, T. (2019). Endogenous product substitutability strategy under duopoly. Managerial and Decision Economics, 40(6), 623–632. https://doi.org/10.1002/mde.3033
- Wang, J., Zhou, X., Wang, J., & Li, W. (2013). Research on performance evaluation and regulation policy of privatization of urban public utilities in China (pp. 86–88). China Social Sciences Press.
- Warner, M. E., & Aldag, A. M. (2021). Re-municipalization in the US: A pragmatic response to contracting. Journal of Economic Policy Reform, 24(3), 319–314. https://doi.org/10.1080/17487870.2019.1646133
- Warner, M. E., & Hefetz, A. (2008). Managing markets for public service: The role of mixed public-private delivery of city services. Public Administration Review, 68(1), 155–166. https://doi.org/10.2307/25145585 https://doi.org/10.1111/j.1540-6210.2007.00845.x
- Yan, S., Li, Y., Mao, Q., & Dong, S. (2012). The urban municipal infrastructure construction status, problem and countermeasure of China. Urban Studies, 19(5), 28–33.
