
 ?Mathematical formulae have been encoded as MathML and are displayed in this HTML version using MathJax in order to improve their display. Uncheck the box to turn MathJax off. This feature requires Javascript. Click on a formula to zoom.
Abstract
As a provider of public goods and a corrector of externalities, the government has a significant effect on the local environment. Based on annual province-level data from 1998 to 2015, this paper decomposes the changes in sulfur dioxide emissions into end pollution control effects and source pollution control effects by a complete decomposition model. It then uses a spatial econometric model to investigate how government size expansion affects sulfur dioxide emissions. The results show that under the promotion system based on appointment, the local government size and the neighboring government size are not conducive to reducing local sulfur dioxide emissions. With the expansion of the government size, the degree of environmental degradation caused by competition among governments is more serious. In the way of influence, the impact of local government size on the sulfur dioxide emissions is mainly through restraining the effect of end pollution control. The impact of neighboring government size on the sulfur dioxide emissions is mainly through weakening the effect of source pollution control.
1. Introduction
Weak institutions are considered a major obstacle to improving well-being in many developing countries (Greenstone & Hanna, Citation2014). So it is becoming more and more important to analyse these countries' environmental governance dilemmas from the institutional level. As the largest developing country, China is currently undergoing an economic transformation. Whether China can successfully deal with environmental problems will play an important role in the process of green and low-carbon development of the world (Wang et al., Citation2021). Therefore, taking China as an example, studying the dilemma of China's environmental governance from the institutional perspective has essential reference significance to achieve global environmental improvement.
The environmental resources have the characteristics of public goods, which leads to a lack of incentives for enterprises to control pollution (Li & Li, Citation2019). The government naturally undertakes the responsibility of regulating enterprises. However, the government cannot perform environmental regulation functions well (Ran, Citation2013). The institutional framework of fiscal decentralisation and political centralisation is the institutional background for understanding the government's dereliction of environmental protection duty. In the context of this system, scholars have explained the failure of local government environmental regulation from promotion incentives (Liang & Langbein, Citation2015), corruption (Wang et al., Citation2019), and departmental collaboration (Jia & Chen, Citation2019).
However, these studies ignore the impact of government size on the environment. Without considering the influence of other factors, López et al. (Citation2011) and Bernauer and Koubi (Citation2013) find that the expansion of government size is not conducive to the improvement of environmental quality. With the deepening of research, Halkos and Paizanos (Citation2017) find that the level of institutional quality is low in developing countries, and larger governments deteriorate environmental quality. Galinato and Islam (Citation2014) provide evidence that in democratic countries, more government spending on public goods increases the stringency of environmental regulations, thereby reducing consumption pollution. The above research results show that the impact of government size on the environment is affected by the national system. For China, Zhou (Citation2009) believes that under the system of fiscal decentralisation and political centralisation, there are too many short-term interest-oriented administrative interventions in local governments. As the local government size expands, the problem of joint agency from various levels of government agencies (departments) becomes more serious, and the sulfur dioxide emissions are more. However, Zhang et al. (Citation2017) use city-level panel data of 106 cities in China from 2002 to 2014 to study the relationship between government expenditure and the environment and find that government expenditure reduces pollutant emissions.
Based on the above analysis, it is found that the relationship between the Chinese government size and the environment has attracted some scholars' attention. However, the studies mentioned above regard local government as an independent individual, thus ignoring the influence and restriction of the actions of rival local governments. In fact, for China, the central government often adopts relative performance to evaluate the performance of local governments (Chen et al., Citation2005). ‘Relative performance appraisal’ makes local governments pay close attention to the behavior of competitors (Zhang, Citation2016). In other words, local government behavior will inevitably be affected by government behavior in neighboring regions. In fact, some scholars have used the spatial panel model to study this interactive behavior among Chinese local governments (Caldeira, Citation2012; Zhang, Citation2016). Therefore, when studying the relationship between government size and environment, the influence and restriction of neighboring local government behavior should be considered.
Moreover, according to the stage of pollution control, there are two pollution control methods: source pollution control (before pollutants are generated) and end pollution control (after pollutants are generated) (Wu et al., Citation2019). With the rapid economic development, the limitations of end pollution control are becoming more and more obvious (Zhang, Citation2013). However, source pollution control has advantages in economic and environmental aspects (Mantovani et al., Citation2017). Therefore, the central government is also paying more and more attention to the source pollution control (Zhang, Citation2013). However, source pollution control requires a large amount of investment, which will inevitably reduce the production capacity of enterprises, thereby reducing the competitiveness of local governments (Wu et al., Citation2019). With the expansion of government size, the competition among governments will become more intense. In order to improve competitive advantages, local governments may choose a pollution control mode that is beneficial to their interests. However, few researchers study the impact of government size expansion on the environment from pollution control modes, resulting in a lack of targeted policy recommendations. So this paper uses the complete decomposition method and spatial econometric model based on China's panel data during 1998–2015 to supplement the shortcomings mentioned above. Compared with existing research, this paper contributes to the literature in several ways.
Firstly, our research adds to the understanding of the internal mechanism of government size expansion affecting the changes in sulfur dioxide in local and neighboring areas from both theoretical and empirical levels. Existing studies regard local government as a completely independent individual and ignore the competition among local governments when they study the environmental effects of the government size expansion. This article explains the impact of government size expansion on local and neighboring sulfur dioxide emissions from the relationship between supply and demand based on the political labor market. On this basis, the spatial panel model is used to study the impact of government scale on the environment.
Secondly, we explore the changes in pollution control methods in different regions. According to pollution control methods, sulfur dioxide emissions are decomposed into source control effects and end control effects. Furthermore, we analyse the differences in preferences of pollution control methods in different regions in China and the contribution rate of different pollution control methods to environmental improvement.
Finally, this article studies the impact of government size expansion on sulfur dioxide emissions from the perspective of pollution control modes. The existing studies on the relationship between government size and pollution emissions ignore the impact of government size expansion on pollution control methods. This paper will do some supplementary research.
The rest of this article is organised as follows. We first review the existing literature and conduct theoretical research on the impact of government size on the environment in section two. In the third section, we analyse pollution control methods in different regions based on the decomposition of pollutant emission intensity, followed by introducing our data and empirical methodology. And then, we present the empirical findings in section five. Finally, the paper concludes with research findings and policy implications in section six.
2. Literature review and theoretical analysis
2.1. Literature review
Although the minimum public service provided by the government is necessary for a country, it is well known that oversized government causes various inefficiencies. If the government size is regarded as the degree of government intervention in the market failure, excessive intervention may inhibit market competition, that is, government failure (Kotera et al., Citation2012). Since the government size may affect government functions, more and more scholars have paid attention to the scale of government in recent years. There is no uniform definition of government size. In the existing research, Wang (Citation1998) believes that the government size refers to the sum of the government's specific components based on the allocation of power and according to certain organisational principles. It consists of the internal size and external size. The internal size determines the external size, while the external size is the bearer of internal size. Since the concept of internal size is abstract and its magnitude is difficult to measure, it can only be evaluated descriptively. Therefore, in the literature, government size mainly refers to the external size. Scholars mainly adopt the following three basic indicators to measure the government size: the proportion of government consumption expenditure in GDP (Chen & Lee, Citation2005; Karras, Citation1996; Lin, Citation1994); the proportion of government fiscal expenditure in GDP (Bergh & Karlsson, Citation2010; Colombier, Citation2009; Han & Lin, Citation2019) and the proportion of government employees in the total population (Zhou, Citation2009).
The research on the relationship between government size and the environment starts relatively late, but in recent years it has gradually attracted the attention of scholars. As a pioneering study, López et al. (Citation2011) point out that government fiscal expenditure may affect the environment through scale effect, composition effect, and technological effect. The empirical results show that increasing total government expenditure without changing its composition can not reduce pollution. Bernauer and Koubi (Citation2013) use sulfur dioxide as the pollution indicator and use the data of 42 countries from 1971 to 2006 to verify whether government fiscal expenditures can better improve the supply of public goods. The conclusion is that the expansion of the government size may worsen the quality of the environment. However, in another study, López and Palacios (Citation2014) further use the 12 wealthiest countries in Europe from 1995 to 2008 to conduct research and find that increasing the share of fiscal expenditure in GDP and shifting the focus to public product expenditure and non-social subsidies can significantly reduce the concentration of sulfur dioxide and ozone. In addition, with the deepening of research, some scholars have discovered that the impact of government size on the environment may be affected by other factors. Halkos and Paizanos (Citation2013) first distinguish between the direct and indirect effects of fiscal expenditure on the environment. The evidence provided by Galinato and Islam (Citation2014) shows that in democracies, more government spending on public goods increases the stringency of environmental regulations, thereby reducing consumption pollution. Adewuyi (Citation2016) points out that in the long run, the negative direct impact of government spending is reduced by the positive indirect impact, leading to a positive impact on total carbon emissions. Halkos and Paizanos (Citation2017) find that larger governments with lower institutional quality may deteriorate the environmental quality in developing countries.
The above researches support the view that government size expansion affects the environment. Nevertheless, these studies are mainly carried out at the national level, and it is difficult to examine the impact of institutional factors. Institutional factors are the main cause of environmental improvement in many developing countries (Greenstone & Hanna, Citation2014). Therefore, we should consider the country's institutional factors to analyse the internal mechanism of government size expansion affecting the environment. Economic decentralisation under political centralisation is the institutional background for studying China's issue, which has become a consensus (Chien, Citation2010; Qian & Roland, Citation1998; Wang et al., Citation2020). After reform and opening up, China has gradually formed a unique institutional framework of economic decentralisation and political centralisationcentralisation in the governance relationship between the central government and local governments. Under the institutional framework, the central government constructs effective political and economic incentives and cultivates a competition mechanism among local governments. Zhou (Citation2009) believes that there are too many short-term interest-oriented administrative interventions in local governments under this system. As the local government size expands, the common agency problems from government agencies (departments) at all levels become more serious. Consequently, the sulfur dioxide emissions in the region are serious. Zhang et al. (Citation2017) use city-level panel data of 106 cities in China from 2002 to 2014 to study the impact of government spending on pollutant emissions and find that government spending will reduce sulfur dioxide emissions. Although the relationship between the Chinese government size and the environment has attracted some scholars' attention. However, the existing studies regard each local government as an independent individual, thus ignoring the influence and restriction of the actions of rival local governments.
2.2. Theoretical analysis
It will be more conducive to understanding the impact of government size expansion on the environment and the government size's spatial spillover effects if we regard China's official system as a political labor market and explain government behavior in terms of supply and demand. As political participants, local officials have a strong motivation to pursue political promotion (Ran, Citation2013). Under political centralisation, the promotion of Chinese officials is determined by the upper-level government. So under the institutional setting, a political labor market has actually emerged. The political labor market is a buyer's monopoly market, with the central government being the only buyer and a large number of lower-level or local officials being the sellers (Wang, Citation2013). However, the posts provided by the central government are limited, and it is significantly fewer than the demand for posts. Therefore, the central government has formulated some standards to assess local governments (Zhou et al., Citation2019).
Local officials ranked relatively high in the assessment can be promoted to higher positions. With the expansion of government size, the scale of government agencies and staff size has also expanded simultaneously. It will inevitably intensify the supply of political labor, leading to more intense competition for promotion. In order to gain a promotion advantage in the competition, local governments will focus on completing those tasks that are easy to perform and ignore environmental protection. Therefore, local governments will increase the scale of fiscal expenditures to promote local economic development. At the same time, local governments use the information asymmetry between the upper-level government and local government to conceal the hidden costs of economic development and reduce the supply of public goods with obvious positive externalities, leading to further deterioration of environmental quality. Therefore, in general, government size expansion is not conducive to the improvement of environmental quality.
China's vast territory has led to differences in natural endowments and social development across regions. In regions with better natural endowments and social development, the local government can achieve better political performance without making efforts. To avoid the impact of the difference, the central government often follows the principle of comparable areas when assessing officials' performance (Zhou, Citation2007). The neighboring regions are more similar than other regions in terms of natural endowments and social development. Competition among the local governments in these areas is relatively strong. Therefore, the government size expansion in neighboring regions will inevitably affect local government decision-making, affecting environmental quality.
Besides, pollution emission is jointly determined by pollution generation and pollution governance. It determines that there are two pollution control methods in the current pollution control process: source pollution control and end pollution control. However, the end pollution control is out of touch with production and generally only produces environmental benefits. Relying solely on end pollution control may lead to the problem that resources and energy cannot be fully utilised in the production process. Simultaneously, end pollution control is difficult to achieve the goal of the complete elimination of pollution and even cause secondary pollution. Therefore, the effective way to reduce pollution emissions is to control the production of pollutants. It is the clean production method that China strongly advocates. For example, the Cleaner Production Promotion Law of the People's Republic of China promulgated and implemented by China aims to promote cleaner production, improve resource utilisation efficiency and reduce the generation of pollutants.
Although source pollution control has a higher environmental effect, the improvement of cleaner production technology has the characteristics of large initial investment, high risk and long incubation period, and it will reduce the competitiveness of enterprises in a short period. It is bound to reduce the competitive advantage of local government officials (Wu et al., Citation2019). However, as the government size expands, competition among governments will become more intense. In order to gain promotion advantages in the process of performance evaluation, the local government may reduce investment in source pollution control. From this perspective, as the government size expands, the government's efforts to control pollution at the source will decrease.
Local governments are often accountable to the central government under the promotion mechanism based on the appointment system (Chien, Citation2010). It means that local governments will selectively perform government functions based on the central government's attention. In other words, if the central government focuses on source pollution control, in order to meet the requirements of upper-level governments, the local government will take the method of source pollution control to reduce the pollution emission. From this perspective, as the scale of the government expands, the government's efforts to control pollution at the source will increase. In summary, under the appointment system based on appointment, as the government size expands, which method will local governments choose to deal with the promotion pressure? It needs to be tested with Chinese empirical data further.
3. Decomposition of pollutant emission intensity changes
3.1. Complete decomposition model
According to Sun (Citation1998) and Chen et al. (Citation2021), this paper decomposes the pollution emission intensity based on the complete decomposition model. Specifically, pollution emission intensity can be expressed as follows:
(1)
(1)
InEquation Equation (1)(1)
(1) ,
is the pollution emission intensity of area
in year
is the pollution emission of area
in year
is the economic output of area
in the
is the total amount of pollution produced by economic production activities of area
in year
is the pollution discharge rate of area
in year
is the pollution production per unit GDP of area
in year
Within time period the change in pollution intensity can be expressed as:
(2)
(2)
where
expresses the contribution of changes in the pollution generation intensity to the pollution emissions intensity change of area
expresses the contribution of changes in the pollutant emission rate to the pollution emissions intensity change of area
is the residual term. According to the research of Sun (Citation1998),
could to be attributed either to
or to
by equal right. That contribution is dependent on both of the changes and if only one of them goes to zero the other effect disappears. When there is no reason to assume the contrary, it is divided equally to
's contribution and
's contribution (Sun, Citation1998). The complete decomposition model for the two-factor system is as follows.
(3)
(3)
(4)
(4)
EquationEquation (3)(3)
(3) reflects the contribution of changes in the pollution generation intensity to the pollution emissions intensity change.Equation Equation (4)
(4)
(4) reflects the contribution of changes in the pollutant emission rate to the pollution emissions intensity change. Depending on the meaning of source pollution control and end pollution control, we can useEquation Equations (3)
(3)
(3) and Equation(4)
(4)
(4) to measure the source pollution control effect (SPC) and the end pollution control effect (EPC), respectively.
3.2. Decomposition results of SO2 emission intensity
In this paper, we choose industrial SO2 as the research object. This is because compared to air pollutants, water pollutants and solid pollutants are easy to store, which may cause the sum of the discharge and removal of these pollutants to be greater than the total pollution generated in the current period. It is not conducive to the decomposition calculation. On the contrary, air pollutants cannot be stored, so the sum of pollution discharge and removal is the total production. There are many types of air pollutants, but compared with other pollutants, industrial SO2 is not only closely related to the process of economic development but also clearly regulated by the government. Moreover, industrial SO2 is continuously counted, so it is an ideal empirical research object. This is why current scholars generally choose SO2 as the research object (Bernauer & Koubi, Citation2013). However, it is regrettable that data on the removal and production of industrial SO2 after 2015 is seriously missing. Therefore, the sample interval of this article is 1997–2015.
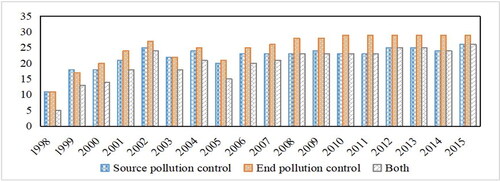
shows the trend of changes in the number of areas adopting different pollution control methods. It can be seen from that the number of areas adopting the single pollution control method and the two pollution control methods is both increasing except for several years. It means that environmental pollution has received increasing attention from the Chinese government in recent years. Moreover, the number of areas adopting source pollution control method and end pollution control method is not much different before 2005. However, after 2005, the number of areas adopting the end pollution control method is significantly higher than the number of areas adopting the source pollution control method.
Figure 1. Trends in the number of regions adopting different pollution control methods.
Source: Authors.
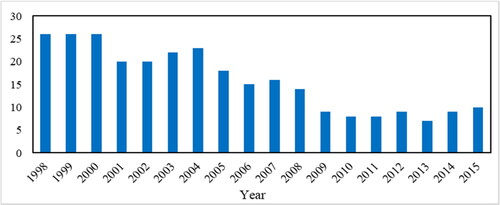
It can be seen from that the number of regions where the contribution rate of source pollution control method to pollution reduction is greater than the contribution rate of end pollution control method to pollution reduction is decreasing. Before 2009, for most regions, the contribution rate of source pollution control is higher than the contribution rate of end pollution control. On the contrary, after 2009, the latter is more than the former.
Figure 2. Changes in the number of regions where the contribution rate of source pollution control is higher than the contribution rate of end pollution control.
Source: Authors.
shows the distribution of years in which the contribution rate of source pollution control is greater than the contribution rate of end pollution control in each region. The symbol ■ indicates that the contribution rate of the source pollution control is greater than the contribution rate of end pollution control. The symbol 〇 indicates that the contribution rate of the source pollution control is less than the contribution rate of the end pollution control. It can be seen from that in the sample time, the contribution rate of source pollution control in Beijing, Liaoning, and Shanghai is greater than that of end pollution control.
Figure 3. The distribution of years in which the contribution rate of source pollution control is higher than the contribution rate of end pollution control in each region.
Source: Authors.
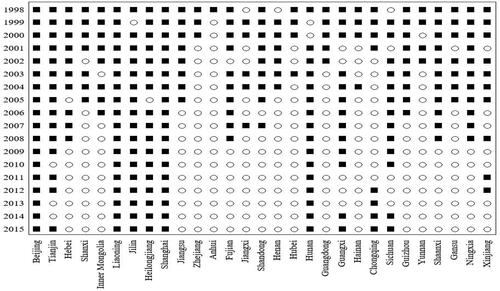
It is not difficult to understand the phenomenon that the contribution rate of source pollution control in Beijing and Shanghai over the years is greater than the contribution of end pollution control. As developed regions in China, they have a higher level of production technology and pollution reduction technology. However, compared to other provinces in China, such as Jiangsu, Zhejiang and Guangdong, Liaoning's economic development level is not high. Why is the contribution rate of source pollution control higher than the contribution rate of end pollution control over the years? One possible explanation is that as Liaoning is a traditional industrial base, its industrial structure has a more obvious impact on the pollution in Liaoning than in other provinces. With the adjustment of the industrial structure of Liaoning, the improvement effect of source pollution control on pollution emission has become more obvious. In fact, Jilin and Heilongjiang are both traditional industrial bases in the Northeast. Except in 1999 and 2005, respectively, the contribution rate of source pollution control of the two provinces is greater than the contribution rate of end pollution control.
4. Research design
4.1. Spatial autocorrelation test
The Moran's I index method is usually used to identify whether variables have a spatial correlation. The statistical formula of Moran's I index:
(5)
(5)
is the number of observations.
and
represent area
and area
respectively.
is an element in the spatial weight matrix of the observation object. When the area
is adjacent to the area
When the area
is not adjacent to the area
or
and
are the observation values of different observation objects.
is the average value of the observation objects.
show the Moran's I indexes of the pollution intensity, the source pollution control, and end pollution control of the 29 provinces (Qinghai, Tibet, Taiwan, Hong Kong and Macau are seriously missing data, so these regions are not included). It can be seen that the Moran's I indexes present the following characteristics.
Figure 4. The Moran's I indexes of the pollution intensity, the source pollution control, and end pollution control.
Source: Authors.
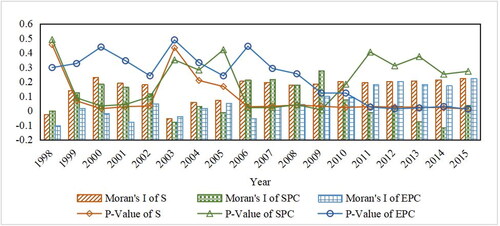
Firstly, Moran's I indexes of the SO2 emission intensity are statistically significant from 1999 to 2002 and 2006 to 2015. The Moran's I indexes of the source pollution control are statistically significant from 1999 to 2002 and from 2006 to 2009. The Moran's I indexes of the end pollution control are statistically significant from 2011 to 2015. Secondly, for the years when the Moran's I indexes are statistically significant, the Moran's I indexes are all positive, which means that there are competing behaviors with imitating each other among different regions. The above results indicate that before 2010, the spatial correlation of SO2 emission intensity is caused by source pollution control. That is, local governments' competing imitative behaviors mainly occur in source pollution control and produce significant effects. After 2010, the spatial correlation of SO2 emission intensity is caused by end pollution control. That is, local governments' competing imitative behaviors mainly occur in end pollution control and produce significant effects.
However, when the global Moran's I indexes are statistically significant, it does not mean the pollutant itself has a spatial spillover effect. The main reasons are as follows. Firstly, the research object of this paper is industrial sulfur dioxide, not the concentration of sulfur dioxide in the air, which excludes the transboundary spillover of the pollutant. Secondly, generally speaking, the industrial enterprises in the region may have imitative behaviors because of the competitive relationship among the industrial enterprises in the region. The sample data is provincial-level, which means that the pollution emissions in different provinces are not caused by the competition of enterprises themselves. In most years, Moran's I indexes are statistically significant, which indicates that the spatial correlation of pollution emissions is caused by other factors, such as the expansion of government size, pointed out in the previous analysis. In fact, many factors influence pollution emissions. Some of the factors have positive effects on pollution emissions. Some of the factors have negative effects on pollution emissions. Therefore, in some years, the Moran's I indexes are not statistically significant.
4.2. Methodology
Based on the research of Bernauer and Koubi (Citation2013), this paper revises the statistical model combined with our purpose. When Bernauer and Koubi (Citation2013) study the impact of government size on environmental pollution, the following model is set:
(6)
(6)
where
is the pollution level of the period
in the region
is the
th control variable.
is constant.
is the error term.
is the parameter to be estimated.
In China, under the institutional framework of fiscal decentralisation and political centralisation, local governments face promotion pressure. To gain an advantage in promotion, local governments may compete with other governments. The behavioral decisions of local governments may have spatial spillover effects. So this paper introduces the spatial weight matrix based onEquation Equation (6)(6)
(6) .
(7)
(7)
where,
is the ith row of the spatial weight matrix
is the ith row of the spatial weight matrix
is the ith row of the spatial weight matrix
EquationEquation (7)(7)
(7) is the general expression of the spatial econometric model.
When Equation Equation (7)
(7)
(7) is the spatial autocorrelation model (SAC).
When and
Equation Equation (7)
(7)
(7) is the spatial autoregressive model (SAR).
When and
Equation Equation (7)
(7)
(7) is the spatial error model (SEM).
When Equation Equation (7)
(7)
(7) is the spatial Durbin model (SDM).
When and
Equation Equation (7)
(7)
(7) is the spatial lag of X model (SLX).
In the research process, the appropriate model should be selected according to the real situation. As pointed out in the previous spatial correlation test, the spatial autocorrelation characteristics of pollutants are not caused by the spillover of the pollutants or by the competitive behavior of the enterprises themselves but by other factors. According to the above spatial models, we believe that the Spatial Lag of X Model (SLX) (Vega & Elhorst, Citation2015) is suitable for this study. Therefore, this paper sets the model:
(8)
(8)
4.3. Variables
4.3.1. Explained variable
In order to study the transmission mechanism of government size expansion that affects sulfur dioxide emissions, the explanatory variables in this paper are the changes in industrial sulfur dioxide emission intensity (S), source pollution control (SPC) and end pollution control (EPC). They are calculated in part three.
4.3.2. Government size
As pointed out in the second part of the analysis, the government size can be measured by the proportion of government consumption expenditure in GDP (Chen & Lee, Citation2005; Karras, Citation1996; Lin, Citation1994) and the proportion of government fiscal expenditure in GDP (Bergh & Karlsson, Citation2010; Colombier, Citation2009; Han & Lin, Citation2019). This paper uses the proportion of government consumption in GDP to measure government size. Moreover, this paper uses the proportion of government fiscal expenditure in GDP to test the conclusion's robustness.
4.3.3. Economic variables
Economic activity is considered a key factor affecting environmental quality (Antweiler et al., Citation2001). Based on existing research (Bai et al., Citation2019; Zhang et al., Citation2020; Zhao et al., Citation2020), this article controls the impact of economic activities on the environment from three aspects: per capita GDP, industrial structure and degree of openness.
4.3.3.1. Level of economic development
Generally speaking, areas with high economic development levels produce more products, consume more energy and increase pollution. This article uses real GDP per capita to measure the level of economic development.
4.3.3.2. Industrial structure
Differences in industrial structure between regions often lead to different levels of local environmental pollution. Compared with the primary and tertiary industries, the secondary industry, especially the industry, is more likely to cause environmental pollution. Therefore, we choose the ratio of the secondary industry's added value to the gross domestic product (GDP) to measure the industrial structure.
4.3.3.3. Degree of trade openness
Some studies incorporate international trade into their analysis of economic-environmental linkages (Frankel & Rose, Citation2005). Some researchers believe that local governments can lower the threshold of environmental regulations to attract foreign capital, which in turn expands the tax base. Some researchers believe that as the degree of openness increases, foreign companies can bring environmental protection technology and equipment to the host country, thereby improving the regional environment. In this analysis, we measure a country's trade openness by the ratio of the sum of exports and imports to GDP (Bernauer & Koubi, Citation2013).
4.3.4. Political variable
Corruption When the political environment worsens, polluting enterprises have more incentives to take rent-seeking behaviors to obtain more pollution opportunities. This paper uses the number of duty crime cases (e.g., corruption, bribery, malpractice and infringement) filed for investigation by procuratorial organs to control the political environment's influence (Wang et al., Citation2020).
4.3.5. Other variables
4.3.5.1. The population density
The population is also considered an important factor affecting environmental factors (Lee et al., Citation2009). However, the current impact of population density on the environment is unclear. Wang et al. (Citation2019) believe that on the one hand, population accumulation causes environmental pollution; on the other hand, high population density makes it possible to use energy more efficiently and intensively. Therefore, the net impact of population density on the environment depends on the relative strength of the above two opposite effects. Population density is measured by the number of persons per square kilometer.
4.3.5.2. Environmental regulations
Environmental resources have the characteristics of public products, and the enthusiasm of enterprises to control pollution is insufficient. Therefore, government environmental regulation is an effective way to solve environmental problems (Kou et al., Citation2021). The stricter the environmental regulation, the more closely enterprises pay attention to pollution control and emission reduction. In this paper, the environmental regulation is measured by the ratio of the total sewage charges to the number of enterprises.
4.3.5.3. Environmental protection staff scale
Swanson et al. (Citation2001) point out that the effective implementation of environmental policies is affected by the scale of environmental protection personnel. When there are more people in the environmental protection system, the more helpful it is to implement environmental policies. This paper uses the actual number of environmental protection personnel at the end of the year to measure the scale of environmental protection personnel.
4.3.5.4. Energy-saving technology
Excessive consumption of energy has become a key cause of environmental pollution. Therefore, upgrading energy-saving technologies is considered the main way to achieve environmental governance (Kou & Han, Citation2021). In general, the higher the technical level, the lower the energy consumption will be. Therefore, this paper uses energy consumption intensity to measure energy-saving technologies in reverse.
4.3.5.5. Fiscal decentralisation
The impact of fiscal decentralisation on the environment has become a consensus (Guo et al., Citation2020; Zhou et al., Citation2020). Based on the research of Guo et al. (Citation2020), this article adopts the ratio of local government per capita fiscal expenditure to the central per capita fiscal expenditure to measure fiscal decentralisation.
4.4. Data sources
The data of pollutant emissions, pollutant production, pollutant removal and the number of employees in the environmental protection system are from the China Environment Yearbook. Some missing values are complemented by interpolation. The data of government fiscal expenditure, GDP, industrial output value, secondary industry output value, population, total import and export, GDP index and industrial value-added index come from China Statistical Yearbook, New China Sixty Years Statistical Data Collection and China Economic and Social Development Statistics Database. Since the industry accounts for the largest proportion of the secondary industry, we supplement the missing industrial value-added index with the secondary industry index. The data of total energy consumption comes from the China Energy Statistical Yearbook. The data of duty crime cases comes from the China Procuratorial Yearbook and Local Procuratorial Reports. The statistics of the variables used in this paper are shown in.
Table 1. Statistical description of variables.
5. Empirical results and discussion
In order to avoid multicollinearity, this paper tests the correlation coefficient of each variable (see). According to, the maximum correlation coefficient between the variables is 0.79, so it can be judged that there is no serious multicollinearity problem.
Table 2. Correlation coefficient matrix.
In order to avoid spurious regression, it is necessary to perform the unit root test on each panel data series. In this paper, LLC and ADF are used to test panel data stationarity (see). It can be seen from the test results that the variables in the model are stable, so all variables are included in the regression model together.
Table 3. Unit root test.
According to the theoretical analysis part, the spatial lag of explanatory variables should be controlled. Since the SDM model and the SLX model contain the spatial lag of explanatory variables, in theory, these two models should be selected for empirical analysis. In addition, we also use the LR test and Wald test to select the appropriate spatial econometric model. Since the SLX model does not have a nesting relationship with the SAR model and the SEM model, we first test whether the SDM model can be simplified to the SAR model or the SEM model (Huang, Citation2018). If not, it indicates that the spatial lag of explanatory variables should be controlled. The test results are shown in.
Table 4. Spatial econometric model selection.
The Hausman test indicates that the fixed effect model is better than the random effect model. Moreover, it can be seen from the test results that the SDM model cannot be reduced to the SAR model or the SEM model. However, the spatial correlation coefficient of the SDM model does not pass the test of 10% significance (p = 0.388), so the SLX model is preliminarily judged to be more reasonable. The Wald test also further shows that the SDM model can be simplified to the SLX model (due to the different estimation methods of the SDM and SLX models, the LR test cannot be used, and the Wald test only needs to estimate the unconstrained model, so we report the Wald test). Because the explanatory variables of the SLX model do not include the spatial lag of the explained variable, the estimation technology of the ordinary panel model is still applicable to the SLX model. In order to control the heteroscedasticity, we choose to replace the standard panel ordinary least squares (POLS) errors with panel-corrected standard errors (Beck & Katz, Citation1995; Lago-Peñas et al., Citation2020). In order to avoid the endogenous caused by reverse causality, the core variable, the government size, is a lagging period.
5.1. The impact of government size on SO2 emissions
reports the regression results of government size affecting SO2 emissions. shows that regardless of the direct effect or indirect effect, the coefficient of government size (GOV) is positive at the 1% significance level. This result is consistent with the theoretical analysis. The expansion of the government size is not conducive to the improvement of the environment. In fact, this result is not difficult to understand. As the government size expands, more short-term interest-oriented administrative interventions exist (Zhou, Citation2009). Especially under the assessment mechanism with GDP as the core, environmental governance cannot bring direct economic benefits but increases the opportunity cost. Therefore, local governments often neglect to implement the environmental protection policies and regulations and intervene in environmental problems in their jurisdictions by acquiescing to the environmental pollution behavior of enterprises and even introducing high-polluting investment projects. In addition, comparing the direct and indirect influence coefficients of government size on SO2 emissions, it can be seen that the indirect influence coefficient is greater than the direct influence coefficient. This means that the degree of environmental degradation caused by the expansion of the government size in neighboring regions is greater than the degree of environmental degradation caused by the expansion of the local government size.
Table 5. The impact of government size on SO2 emission reduction.
The above results show that government officials have behaviors that value the economy under the economic-oriented performance evaluation system and ignore the environment with the government size expansion. Meanwhile, as the government size expands, government officials' competition for promotion not only occurs within the region but also occurs among regions. At the same time, with the expansion of government size, the degree of environmental degradation caused by government competition among regions has become more serious.
5.2. The impact of government size on the pollution control mode
The above results show that neither the direct effect nor the indirect effect of government size expansion is conducive to environmental quality. In this section, we analyse how the government size affects the environment from the perspective of pollution control modes. reports the impact of government size on pollution control modes. The explained variable of model 1 is the source pollution control, and the explained variable of model 2 is the end pollution control.
Table 6. The impact of government size on the pollution control mode.
It can be seen from that the direct impact of government size on the source pollution control is significantly negative, and the direct impact on the end pollution control is significantly positive. It shows that the expansion of the local government size will help improve the local government's pollution control efforts at the source but will weaken the end-of-pipe pollution control efforts. Under the pressure of the central government to promote cleaner production, local governments will actively increase pollution control efforts at the source. However, the government does not have unlimited capabilities. So with the improvement of pollution control efforts at the source, the investment in pollution control at the end will weaken. The government size in neighboring areas has a significant positive impact on the source pollution control, and the impact on the end pollution control is positive but does not pass the test at the significance level of 10%. It means that the expansion of government size in neighboring regions will reduce local pollution control efforts. It is because source pollution control requires a large amount of investment, which will inevitably reduce the production capacity of enterprises, thereby reducing the competitiveness of local governments (Wu et al., Citation2019). With the expansion of government size, the competition among governments will become more intense. In order to improve their competitive advantages, local governments will inevitably reduce the pollution control efforts at the source.
To sum up, in the way of influence, the direct effect of government size on the SO2 emissions is mainly through restraining the effect of end pollution control, and the indirect effect of government size on the SO2 emissions is mainly through weakening the effect of source pollution control.
5.3. Robustness test
In order to ensure the robustness of the conclusions, according to Colombier (Citation2009), Bergh and Karlsson (Citation2010) and Han and Lin (2019), we use the ratio of government fiscal expenditure to GDP to measure the government size. The regression results are shown in (Panel A). The explained variable of model 1 is S. The explained variable of model 2 is SPC. The explained variable of model 3 is EPC. shows that our conclusions have not changed except for the statistical significance of a few variables. It shows that the conclusions of this paper are robust.
Table 7. Robust test.
In addition, we replace the spatial adjacency matrix with the spatial distance matrix for robustness testing. The results are shown in (Panel B). It can be seen from that the other main conclusions have not changed except for the indirect impact of government size on source pollution control does not pass the test at the significance level of 10%. This result is not difficult to understand. When the spatial distance matrix is used for research, it actually implies that all regions have mutual influences. It is just that there is a little impact among regions that are far away. However, as stated in the theoretical analysis, the central government often follows the principle of comparable areas when assessing officials' performance (Zhou, Citation2007). It means that not all governments have mutual influence. In order to further confirm the conjecture of this article, we multiply the corresponding elements of the spatial adjacency matrix and the spatial distance matrix as a new spatial matrix for the robustness test. The meaning of this matrix is that if neighboring regions are closer in the distance, the competition among them may be more intense. The results are shown in (Panel C). It can be seen from that the main conclusions have not changed.
6. Conclusion and policy implications
6.1. Conclusion
The environmental resource is considered to be a public good with non-exclusive and competitive characteristics (Li & Li, Citation2019). In the production process, the phenomena of ‘free rider’ and ‘tragedy of the commons’ are prone to appear. Therefore, environmental protection still requires the government-led governance mode. As the main provider of public goods, the relationship between government size and the environment has attracted some scholars' attention. However, because most studies ignore the characteristics of the country's institution, the relationship between government size and environment has not yet reached a consensus. Therefore, based on China's institutional framework, this paper takes China as an example to study the relationship between government size expansion and the environment from both theoretical and empirical levels. It is not only a practical need for the construction of China's ecological civilisation but also to help other developing countries and transforming countries to examine the relationship between government size and the environment and improve the government's environmental protection function. Based on the research, the following conclusions are drawn.
Firstly, in recent years, the number of regions adopting the end pollution control method has been much higher than the number of regions adopting the source pollution control method. And for most regions, the contribution rate of end pollution control to environmental improvement is higher than the contribution rate of source pollution control to environmental improvement. It indicates that for China, most regions adopt the development mode of ‘pollution first, treatment later’. As pointed out by Wu et al. (Citation2019), source pollution control requires a lot of investment. It will inevitably reduce the production capacity of enterprises, thereby reducing the competitiveness of local governments. Therefore, in order to maintain their own competitiveness, local governments will adopt the development mode of ‘pollution first, treatment later’.
Secondly, the benchmark regression and robustness test both confirm that government size expansion is not conducive to environmental improvement. The conclusion is consistent with the finding of Bernauer and Koubi (Citation2013) and Zhou (Citation2009). However, different from their research, considering the competitive relationship among local governments under the promotion system based on appointment, this paper uses the spatial econometrics model to test the spatial spillover effect of the government size. The results show that government size expansion has a significant spatial spillover effect on the environment, which is greater than the direct impact of government size on the environment. This result confirms the analysis of the theoretical part, under the influence of the promotion system based on appointment, with the expansion of the government size, there is a behavior of ‘race to the bottom’ among local governments in the process of environmental governance, and the environmental degradation caused by this behavior is more serious.
Finally, there are two different transmission paths for the adverse effects of government size expansion on the environment. The direct impact of government size expansion on the environment is mainly achieved by reducing end pollution control efforts. However, the indirect impact of government size expansion on the environment is mainly achieved by reducing source pollution control efforts. The result explains why most regions have adopted the development mode of ‘pollution first, treatment later’ in recent years. It may be that the expansion of the government size intensifies the degree of competition among local governments in different regions.
6.2. Policy implications
Under the promotion system based on appointment, the central government's attitude has guiding significance for the environmental protection work of local governments. Therefore, this paper puts forward the following policy advice based on the research conclusions.
Firstly, on the premise of meeting the social demand for public services, the government should reduce the scale, streamline government agencies, and improve the efficiency of government agencies' operations. Based on existing research and the results of this article, the government size is not the bigger the better. The excessively large government size may lead to lower efficiency and serious corruption, which is not conducive to the performance of environmental protection functions. Therefore, the government should maintain an appropriate scale.
Secondly, it is necessary to standardise the functional orientation of the local government, give play to the decisive role of the market in the allocation of resources, and reduce the degree of government intervention in the allocation of resources. At the same time, the central government should truly incorporate the green economy into the performance evaluation index system of local governments. In this way, it can rectify the phenomenon that local governments are keen to intervene in the production activities of enterprises and underestimate environmental protection supervision from the system level, and prompt local governments to truly attach importance to environmental protection.
Thirdly, the central government should establish a reasonable performance evaluation mechanism to avoid conflicting evaluation tasks that distort the local government's performance of pollution control duties. Specifically, there is a certain conflict between economic development and environmental protection in terms of China's current development situation. When the central government improves the status of environmental protection in evaluating political performance, it should weaken the proportion of tasks incompatible with environmental evaluation (such as economic development) to reduce the opportunity cost of local governments to perform environmental protection responsibilities.
Fourthly, in the process of performance evaluation, the central government should pay attention to the effect of SO2 emission reduction and pay attention to the control pollution method to prevent local governments from relying too much on end pollution control. End pollution control is an essential part of environmental governance nowadays. However, end pollution control is mainly to governance the pollution that has already been produced. Excessive reliance on the end pollution control method actually embodies a development idea of ‘pollution first, governance later', which will damage the ecosystem and is not conducive to society's sustainable development.
In addition to directly affecting the environment, government size expansion can also affect the regional environment through indirect ways, such as industrial structure, enterprise production efficiency, and technological innovation. However, how and to what extent the government size affects environmental quality through indirect ways such as influencing industrial structure, enterprise production efficiency, and technological innovation remains an open question. In order to effectively realise the improvement of environmental quality, it is necessary to conduct a more detailed study on the ways in which the government size affects the environment in future research.
Supplemental Material
Download MS Word (23.2 KB)Disclosure statement
No potential conflict of interest was reported by the authors.
References
- Adewuyi, A. O. (2016). Effects of public and private expenditures on environmental pollution: A dynamic heterogeneous panel data analysis. Renewable and Sustainable Energy Reviews, 65, 489–506. https://doi.org/10.1016/j.rser.2016.06.090
- Antweiler, W., Copeland, B. R., & Taylor, M. S. (2001). Is Free Trade Good for the Environment? American Economic Review, 91(4), 877–908. https://doi.org/10.1257/aer.91.4.877
- Bai, J., Lu, J., & Li, S. (2019). Fiscal pressure, tax competition and environmental pollution. Environmental and Resource Economics, 73(2), 431–447. https://doi.org/10.1007/s10640-018-0269-1
- Beck, N., & Katz, O. N. (1995). What to do (and not to do) with time-series cross-section data. American Political Science Review, 89(3), 634–647. https://doi.org/10.2307/2082979
- Bergh, A., & Karlsson, M. (2010). Government size and growth: Accounting for economic freedom and globalization. Public Choice, 142(1-2), 195–213. https://doi.org/10.1007/s11127-009-9484-1
- Bernauer, T., & Koubi, V. (2013). Are bigger governments better providers of public goods? Evidence from air pollution. Public Choice, 156(3-4), 593–609. https://doi.org/10.1007/s11127-012-9916-1
- Caldeira, E. (2012). Yardstick competition in a federation: Theory and evidence from China. China Economic Review, 23(4), 878–897. https://doi.org/10.1016/j.chieco.2012.04.011
- Chen, L., Xu, L., Velasco-Fernández, R., Giampietro, M., & Yang, Z. (2021). Residential energy metabolic patterns in China: A study of the urbanization process. Energy, 215, 119021. https://doi.org/10.1016/j.energy.2020.119021
- Chen, S., & Lee, C. (2005). Government size and economic growth in Taiwan: A threshold regression approach. Journal of Policy Modeling, 27(9), 1051–1066. https://doi.org/10.1016/j.jpolmod.2005.06.006
- Chen, Y., Li, H., & Zhou, L.-A. (2005). Relative performance evaluation and the turnover of provincial leaders in China. Economics Letters, 88(3), 421–425. https://doi.org/10.1016/j.econlet.2005.05.003
- Chien, S. S. (2010). Economic freedom and political control in Post-Mao China: A perspective of upward accountability and asymmetric decentralization. Asian Journal of Political Science, 18(1), 69–89. https://doi.org/10.1080/02185371003669379
- Colombier, C. (2009). Growth effects of fiscal policies: An application of robust modified M-estimator. Applied Economics, 41(7), 899–912. https://doi.org/10.1080/00036840701736099
- Frankel, J. A., & Rose, A. K. (2005). Is trade good or bad for the environment? Sorting out the causality. Review of Economics and Statistics, 87 (1), 85–91. https://doi.org/10.1162/0034653053327577
- Galinato, G., & Islam, A. (2014). The challenge of addressing consumption pollutants with fiscal policy [Working Paper Series WP 2014–1]. School of Economic Sciences.
- Greenstone, M., & Hanna, R. (2014). Environmental regulations, air and water pollution, and infant mortality in India. American Economic Review, 104(10), 3038–3072. https://doi.org/10.1257/aer.104.10.3038
- Guo, S., Wen, L., Wu, Y., Yue, X., & Fan, G. (2020). Fiscal decentralization and local environmental pollution in China. International Journal of Environmental Research and Public Health, 17(22), 8661. https://doi.org/10.3390/ijerph17228661
- Halkos, G. E., & Paizanos, E. Α. (2013). The effect of government expenditure on the environment: An empirical investigation. Ecological Economics, 91, 48–56. https://doi.org/10.1016/j.ecolecon.2013.04.002
- Halkos, G. E., & Paizanos, E. A. (2017). The channels of the effect of government expenditure on the environment: Evidence using dynamic panel data. Journal of Environmental Planning and Management, 60(1), 135–157. https://doi.org/10.1080/09640568.2016.1145107
- Han, H., & Lin, S. (2019). Government size and regional capital flows in China. Sustainability, 11(23), 6653. https://doi.org/10.3390/su11236653
- Huang, J. T. (2018). Sulfur dioxide (SO2) emissions and government spending on environmental protection in China: Evidence from spatial econometric analysis. Journal of Cleaner Production, 175, 431–441. https://doi.org/10.1016/j.jclepro.2017.12.001
- Jia, K., & Chen, S. (2019). Could campaign-style enforcement improve environmental performance? Evidence from China's central environmental protection inspection. Journal of Environmental Management, 245, 282–290. https://doi.org/10.1016/j.jenvman.2019.05.114
- Karras, G. (1996). The optimal government size: Further international evidence on the productivity of government services. Economic Inquiry, 34(2), 193–203. https://doi.org/10.1111/j.1465-7295.1996.tb01372.x
- Kotera, G., Okada, K., & Samreth, S. (2012). Government size, democracy, and corruption: An empirical investigation. Economic Modelling, 29(6), 2340–2348. https://doi.org/10.1016/j.econmod.2012.06.022
- Kou, P., & Han, Y. (2021). Vertical environmental protection pressure, fiscal pressure, and local environmental regulations: evidence from China's industrial sulfur dioxide treatment. Environmental Science and Pollution Research, 28(42), 60095–60110. https://doi.org/10.1007/s11356-021-14947-7
- Kou, P., Han, Y., & Li, Y. (2021). An evolutionary analysis of corruption in the process of collecting environmental tax in China. Environmental Science and Pollution Research International, 28(39), 54852–54862. https://doi.org/10.1007/s11356-021-13104-4
- Lago-Peñas, S., Martinez-Vazquez, J., & Sacchi, A. (2020). Fiscal stability during the Great Recession: putting decentralization design to the test. Regional Studies, 54(7), 919–930. https://doi.org/10.1080/00343404.2019.1637836
- Lee, C.-C., Chiu, Y.-B., & Sun, C.-H. (2009). Does one size fit all? A reexamination of the environmental Kuznets curve using the dynamic panel data approach. Review of Agricultural Economics, 31(4), 751–778. https://doi.org/10.1111/j.1467-9353.2009.01465.x
- Li, H., & Li, B. (2019). The threshold effect of environmental regulation on the green transition of the industrial economy in China. Economic Research-Ekonomska Istraživanja, 32(1), 3134–3149. https://doi.org/10.1080/1331677X.2019.1661001
- Liang, J., & Langbein, L. (2015). Performance management, high-powered incentives, and environmental policies in China. International Public Management Journal, 18(3), 346–385. https://doi.org/10.1080/10967494.2015.1043167
- Lin, S. A. Y. (1994). Government spending and economic growth. Applied Economics, 26(1), 83–94. https://doi.org/10.1080/00036849400000064
- López, R., Galinato, G. I., & Islam, A. (2011). Fiscal spending and the environment: Theory and empirics. Journal of Environmental Economics and Management, 62(2), 180–198. https://doi.org/10.1016/j.jeem.2011.03.001
- López, R., & Palacios, A. (2014). Why has Europe become environmentally cleaner? Decomposing the roles of fiscal, trade and environmental policies. Environmental and Resource Economics, 58(1), 91–108. https://doi.org/10.1007/s10640-013-9692-5
- Mantovani, A., Tarola, O., & Vergari, C. (2017). End-of-pipe or cleaner production? How to go green in presence of income inequality and pro-environmental behavior. Journal of Cleaner Production, 160, 71–82. https://doi.org/10.1016/j.jclepro.2017.01.110
- Qian, Y., & Roland, G. (1998). Federalism and the soft budget constraint. American Economic Review, 88(5), 1143–1162. https://doi.org/10.2139/ssrn.149988
- Ran, R. (2013). Perverse incentive structure and policy implementation gap in China's local environmental politics. Journal of Environmental Policy & Planning, 15(1), 17–39. https://doi.org/10.1080/1523908X.2012.752186
- Sun, J. (1998). Changes in energy consumption and energy intensity: A complete decomposition model. Energy Economics, 20(1), 85–100. https://doi.org/10.1016/S0140-9883(97)00012-1
- Swanson, K. E., Kuhn, R. G., & Xu, W. (2001). Environmental policy implementation in rural China: A case study of Yuhang, Zhejiang. Environmental Management, 27(4), 481–491. https://doi.org/10.1007/s002670010164
- Vega, S. H., & Elhorst, J. P. (2015). The SLX model. Journal of Regional Science, 55(3), 339–363. https://doi.org/10.1111/jors.12188
- Wang, M. (1998). Research on the government's reasonable scale and its standard. Social Sciences in Nanjing, 11, 3–5. https://doi.org/10.15937/j.cnki.issn1001-8263.1998.11.004 (in Chinese)
- Wang, Q. S., Su, C. W., Hua, Y. F., & Umar, M. (2021). Can fiscal decentralisation regulate the impact of industrial structure on energy efficiency? Economic Research-Ekonomska Istraživanja, 34(1), 1727–1751. https://doi.org/10.1080/1331677X.2020.1845969
- Wang, S., Wang, H., & Sun, Q. (2020). The impact of foreign direct investment on environmental pollution in China: Corruption matters. International Journal of Environmental Research and Public Health, 17(18), 6477. https://doi.org/10.3390/ijerph17186477
- Wang, S., Yuan, Y., & Wang, H. (2019). Corruption, hidden economy and environmental pollution: A spatial econometric analysis based on China's provincial panel data. International Journal of Environmental Research and Public Health, 16(16), 2871. https://doi.org/10.3390/ijerph16162871
- Wang, X. (2013). Local official governance and regional development. Journal of Chongqing University (Social Science Edition), 19(5), 13–21. https://doi.org/10.11835/j.issn.1008-5831.2013.05.003 (in Chinese)
- Wu, G., Baležentis, T., Sun, C., & Xu, S. (2019). Source control or end-of-pipe control: Mitigating air pollution at the regional level from the perspective of the total factor productivity change decomposition. Energy Policy, 129, 1227–1239. https://doi.org/10.1016/j.enpol.2019.03.032
- Zhang, H. (2016). Strategic interaction of regional environmental regulation: An explanation on the universality of incomplete enforcement of environmental regulation. China Industrial Economics, 7, 74–90. https://doi.org/10.19581/j.cnki.ciejournal.2016.07.006 (in Chinese)
- Zhang, P. (2013). End-of-pipe or process-integrated: Evidence from LMDI decomposition of China's SO2 emission density reduction. Frontiers of Environmental Science & Engineering, 7(6), 867–874. https://doi.org/10.1007/s11783-013-0541-0
- Zhang, Q., Zhang, S., Ding, Z., & Hao, Y. (2017). Does government expenditure affect environmental quality? Empirical evidence using Chinese city-level data. Journal of Cleaner Production, 161, 143–152. https://doi.org/10.1016/j.jclepro.2017.05.096
- Zhang, Z., Jin, T., & Meng, X. (2020). From race-to-the-bottom to strategic imitation: how does political competition impact the environmental enforcement of local governments in China? Environmental Science and Pollution Research International, 27(20), 25675–25688. https://doi.org/10.1007/s11356-020-09003-9
- Zhao, H., Cao, X., & Ma, T. (2020). A spatial econometric empirical research on the impact of industrial agglomeration on haze pollution in China. Air Quality, Atmosphere & Health, 13(11), 1305–1312. https://doi.org/10.1007/s11869-020-00884-w
- Zhou, B., Li, Y., Lu, X., Huang, S., & Xue, B. (2019). Effects of officials' cross-regional redeployment on regional environmental quality in China. Environmental Management, 64(6), 757–771. https://doi.org/10.1007/s00267-019-01216-0
- Zhou, K., Zhou, B., & Yu, M. (2020). The impacts of fiscal decentralization on environmental innovation in China. Growth and Change, 51(4), 1690–1710. https://doi.org/10.1111/grow.12432
- Zhou, L. (2007). Governing China's local officials: An analysis of promotion tournament model. Economic Research Journal, 7, 36–50. (in Chinese)
- Zhou, Q. (2009). Government intervention, common agency and the enterprise's pollution emission reduction incentive: Evidence from the provincial panel data of industrial emissions of SO2. Nankai Economic Studies, 4, 110–130. https://doi.org/10.14116/j.nkes.2009.04.001 (in Chinese)