
 ?Mathematical formulae have been encoded as MathML and are displayed in this HTML version using MathJax in order to improve their display. Uncheck the box to turn MathJax off. This feature requires Javascript. Click on a formula to zoom.
Abstract
Prior studies have not reasonably explained why executive stock options (ESOs) encourage innovation through vega rather than delta. This study re-examines the relationship among vega, delta and innovation performance when stock prices are informative. The findings indicate that informative stock prices amplify the delta effect on encouraging executives to improve innovation performance but that informative prices alleviate the traditional positive effect of vega on innovation. Moreover, when stock prices are informative, deep-in-the-money options reduce the positive effect of delta on innovation, whereas the state control, independent directors and manager and director shareholding enhance (reduce) the positive effect of delta (vega) on innovation. The results hold after conducting robustness tests.
1. Introduction
Innovation is a risky investment process that contributes to the long-term development of firms (e.g. Hsu et al., Citation2014). However, executives who greatly invest financial and human capital in a firm are risk averse and avoid risky innovation (Chu et al., Citation2020). Executive stock options (ESOs) are an efficient way to motivate managers to take risks and engage in innovation. ESOs establish a link between executives’ wealth and innovation (Chen et al., Citation2014). Specifically, when valuable innovation enhances the stock price, executives are rewarded by the increased value of their ESOs, which is an increasing function of the stock price (delta). Meanwhile, stock return volatility, which is positively associated with risky innovation, also enhances the value of ESOs (vega) and executives’ wealth (Armstrong & Vashishtha, Citation2012).
Although theoretical arguments suggest that ESOs encourage innovation through both vega and delta, empirical evidence indicates that only vega is positively related to innovation (Armstrong & Vashishtha, Citation2012). Chen et al. (Citation2014) argue that vega leads executives to pursue innovation that generates expected wealth, whereas delta rewards executives with current wealth, which prevents them from engaging in innovation. Cohen et al. (Citation2000) show that delta leads executives to pursue short-term wealth rather than take long-term risks and that traditional types of compensation (e.g. salaries and bonuses) also offer this kind of motivation. However, these explanations might not be reasonable. High returns often compensate for high risks. If shareholders are informed of the investment opportunities’ values, they will differentiate the profitability of low-risk short-term investments from high-risk long-term innovation and incorporate their opinions (information) into stock prices. Therefore, informative stock prices react positively to risky but value-enhancing innovation projects (stock price increases) (Ferreira et al., Citation2011). Increased stock prices enhance ESO values, which are positively related to executives’ wealth, and induce executives to pursue risky innovation (Armstrong & Vashishtha, Citation2012). In this scenario, informative stock prices enhance executives’ wealth as well as risk-taking incentives.
Although this prediction is reasonable, the link among informative stock prices, ESOs and innovation has been barely considered. Therefore, this study aims to explore the effects of vega and delta on firms’ innovation when stock prices are informative. Using a sample of firms that granted ESOs in the Chinese A-share market from 2007 to 2017, the results of this study show that stock price informativeness enhances the effect of delta on encouraging executives to engage in innovation and improve firms’ innovation performance. However, price informativeness, which is negatively associated with noise volatility, mitigates the traditional positive effect of vega on innovation.
This study focuses on the Chinese market for several reasons. Firstly, Chinese businesses have significantly increased innovation investments in recent years. From 0.992% in 2007, gross R&D spending for Chinese businesses per GDP hit 1.708% in 2019. The number of patent applications for Chinese businesses also rose from 73,893 in 2007 to 801,813 in 2019.Footnote1 This phenomenon can be reasonably explained. The Chinese government suggested a series of subsidy policies to encourage business innovation; for instance, Chinese businesses with established accounting mechanisms enjoy a 75% additional R&D spending deduction when calculating business income tax. Furthermore, Chinese businesses were aware of innovation’s role in improving their market competition abilities. Secondly, more Chinese firms are adopting ESO strategies to motivate managers to take risks (Zhao & Huang, Citation2013). However, the Chinese stock market is sometimes driven by noise traders who contribute to noise volatility (Lin et al., Citation2014), influencing the formation of ESO values and, therefore, the effects of ESOs on firm decisions, including innovation.
This study has theoretical and practical contributions. Firstly, the impact of ESOs on managers’ innovation incentives is of considerable concern because corporate governance theories indicate that ESOs are more efficient than traditional compensation strategies in encouraging managers to engage in innovation (Cohen et al., Citation2000). According to governance theories, managers who receive ESOs are keen to engage in risky innovation, which enhances ESO values by increasing stock return volatility (vega) (Armstrong & Vashishtha, Citation2012). However, this study focuses on informative stock prices, which absorb noise volatility, and demonstrates that with informative stock prices, volatility might not be the reason why ESOs motivate innovation. Conversely, managers are encouraged to enhance risk-taking abilities and accept innovation projects that create values and improve stock performance (delta).
Secondly, the study contributes to a widely discussed topic in corporate governance theories: the executive compensation contract design (e.g. Hayes et al., Citation2012). In prior studies, higher exercise prices of ESOs make executives sensitive to stock return volatility (vega), whereas lower exercise prices amplify executives’ sensitivity to the stock price (delta) (Hayes et al., Citation2012). This study finds that when stock prices are informative, delta encourages executives to engage in innovation. Hence, lower exercise prices contribute more to innovation when prices are informative. However, directors should adjust exercise prices and grant new at-the-money options to renew the delta incentives of executives in time because deep-in-the-money options weaken the positive effect of delta on innovation when exercise prices are too low.
Thirdly, this study focuses on China, a fast-growing emerging market, rather than on developed markets. The Chinese market has experienced rapid growth in ESOs. In 1993, only one firm granted ESOs, whereas between November and December 2010, over 30 firms announced their ESO plans (Zhao & Huang, Citation2013). However, unlike developed markets where information updating is the main driving force of stock return volatility, the Chinese stock market is sometimes dominated by individual investors who contribute to noise volatility (Lin et al., Citation2014). Prior studies have demonstrated that informative stock prices in emerging markets are negatively associated with noise volatility (Lin et al., Citation2014). Hence, the Chinese A-share market serves as a setting where we test how price informativeness reduces the effect of (noise) volatility on motivating risky innovation.
The rest of this paper is organised as follows. Section 2 provides a brief review of related literature and outlines the hypotheses. Section 3 describes the data and variable construction. Section 4 presents the empirical results. Section 5 concludes the study.
2. Literature review and hypothesis development
2.1. ESOs and corporate innovation
According to prior studies, innovation enhances corporate risks due to the long investment process and the high probability of early failures (Hsu et al., Citation2014). Shareholders diversify corporate risks by changing their wealth portfolios, whereas executives who invest much financial and human capital in a firm need to bear such risks (Chu et al., Citation2020). Hence, executives are likely to forgo risky innovation than shareholders (Chu et al., Citation2020).
ESOs are an efficient compensation strategy that encourages risk-averse executives to undertake risky innovation (Cohen et al., Citation2000). Risky innovation increases investors’ divergent opinions about firm value, which generates stock return volatility (Cohen et al., Citation2000). As stock return volatility enhances the value of ESOs (vega), executives who are rewarded by the increased ESO value are likely to undertake innovation (Chen et al., Citation2014), as suggested by Step④ in . Furthermore, stock price increases (delta) encourage executives to engage in value-enhancing innovation (Armstrong & Vashishtha, Citation2012). Armstrong and Vashishtha (Citation2012) show that delta provides executives with an incentive to select positive NPV projects, even if the investment is risky. If the increase in stock value incurred by profitability compensates for the decrease in stock value that results from risks, delta will encourage innovation.
Figure 1. Variable relationships.
Source: Authors.
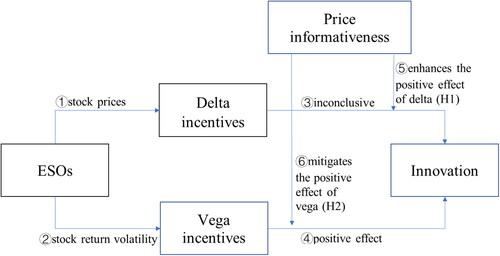
However, empirical studies have not documented a significant positive relationship between delta and innovation, as suggested by Step③ in (Cohen et al., Citation2000). Chen et al. (Citation2014) note that risk-taking incentives, which encourage innovation, mainly emerge from vega rather than delta. Chang et al. (Citation2015) show that delta cannot explain executives’ innovation behaviours when ESOs compensate for them. Studies have suggested some reasons for this phenomenon. Chen et al. (Citation2014) indicate that delta, which rewards executives when stock prices increase, causes executives to pursue low-risk investments, whereas only vega, which is associated with stock return volatility, prompts executives’ risk-taking behaviours. However, value-enhancing projects that increase stock prices typically require executives to take risks. Cohen et al. (Citation2000) argue that, although ESOs create incentives to increase stock prices, traditional types of compensation, such as salaries and bonuses, also provide such incentives. However, option-based compensation offers much stronger incentives to increase stock prices than traditional compensation, because executives who receive ESOs are encouraged to increase the stock price beyond the exercise price and achieve higher performance by taking risks (Baixauli-Soler et al., Citation2015). Consequently, it is unclear why delta does not affect innovation.
2.2. Stock price informativeness, ESOs and corporate innovation
Informative stock prices are driven by investors who efficiently access and analyse firm-specific information (Lin et al., Citation2014; Tiron-Tudor & Achim, Citation2019). Investors who are sophisticated in collecting and processing firm-specific information generate relatively accurate estimations of firms’ investment values, incorporate their estimations into stock prices and improve price informativeness. Hence, informative prices, which reflect the value of investments, react positively to value-enhancing innovation projects (Lin et al., Citation2014). Increased stock prices enlarge the value of ESOs (delta), which is positively related to the wealth of executives who receive ESOs. Executives whose wealth is enhanced through delta are likely to invest in value-enhancing innovation (Armstrong & Vashishtha, Citation2012), as suggested by Step⑤ in . However, if risk-averse executives reject valuable innovation investments, informative prices might show negative reactions that reduce the value of ESOs and the wealth of executives (Armstrong & Vashishtha, Citation2012). Thus, executives are punished for their risk-averse decisions. Accordingly, the following hypothesis is proposed:
H1: Informative stock prices amplify the positive effect of delta on innovation.
The relationship between volatility and price informativeness is inconclusive. Some studies have indicated that informative prices, which rapidly respond to the release of information, are sensitive to the information component of volatility (information volatility) (Lin et al., Citation2014). That is, when investors efficiently capture and trade on new information, stock prices absorb such new information promptly. In this scenario, price informativeness is improved, but the process of information absorption results in volatility (Lin et al., Citation2014). Therefore, the relationship between price informativeness and information volatility is positive.
Conversely, some studies documented a negative relationship between the noise component of volatility and price informativeness (e.g. Lee & Liu, Citation2011). Lee and Liu (Citation2011) suggest that noise traders are difficult to capture firm-specific information and incorporate such information into stock prices, which reduces price informativeness. Meanwhile, noise traders cannot accurately estimate stock prices, which enhances noise volatility in stock prices. Lee and Liu (Citation2011) show that when information disclosure requirements are enhanced, previous noise traders can capture firm-specific information, which improves price informativeness and market stability. In this situation, noise volatility is negatively associated with price informativeness.
Consequently, the relationship between price informativeness and volatility depends on whether the information or noise component is the dominant one. Lin et al. (Citation2014) claim that in the A-share market, informative prices enhance the information component but reduce the noise component of volatility, wherein the reduction (noise) exceeds the enhancement (information) in equilibrium, which therefore leads to decreases in volatility. Lee and Liu (Citation2011) argue that a modest release of information in stock prices leaves time for noise traders to capture information embodied in stock prices and trade on such information, thereby improving price informativeness and experiencing lower noise volatility. Meanwhile, a modest release of information is associated with lower information volatility. Accordingly, when stock prices react slowly to information updates (e.g. prices in the A-share market), higher price informativeness is accompanied by lower (information and noise) volatility (Lin et al., Citation2014).
As mentioned above, stock return volatility, which enhances ESO values and executives’ wealth, is positively related to executives’ innovation incentives (vega incentives). Hence, as Step⑥ in suggests, price informativeness, which is negatively related to stock return volatility in the A-share market, mitigates the traditional positive effect of stock return volatility on innovation (vega). Accordingly, the following hypothesis is proposed:
H2: Informative stock prices mitigate the positive effect of vega on innovation.
3. Sample selection and variable measurement
3.1. Sample selection
In this paper, a sample of firms that granted ESOs in the Chinese A-share market from 2007 to 2017 is used. The initial sample includes 1,813 observations. I only consider the years in which ESOs are not exercised. Financial firms (11 observations) are excluded as they have special capital structures. Firms that have at least 2-year deficits (65 observations) and that have missing values for financial data (32 observations) are excluded from the sample. The final sample consists of 397 firms and 1,705 observations. The observation selection process is presented in Panel B of . The data are obtained from the China Stock Market & Accounting Research database (CSMAR).
Table 1. Summary statistics and observation selection.
3.2. Innovation
Innovation is a long investment process. Prior studies used R&D spending to measure early innovation investments and adopted patent-related proxies to examine innovation products (Hsu et al., Citation2014). However, Chinese accounting regulations do not require listed firms to disclose their early R&D spending in financial reports, and many Chinese firms hide such spending because of fierce technological competition. Accordingly, using R&D spending as a measure causes a severe missing data problem. In this study, the number of annual patent applications (granted or valid patents)Footnote2 is used to estimate the innovation performance of firms (Applications, Granted and Valid) (e.g. Hsu et al., Citation2014).
3.3. Vega and delta incentives
This study seeks to differentiate between vega and delta incentives when stock prices are informative. Following Chen et al. (Citation2014), I adopt the dividend-adjusted Black and Scholes (Citation1973) formula by Merton (Citation1973) to estimate the value of European call options:
where S represents the year-end underlying stock price; X denotes the option’s exercise price; r captures ln(1 + risk-free interest rate), where the risk-free interest rate is the one-year current deposit interest rate; σ is the annual standard deviation of cash dividends reinvested daily stock returns; T denotes the remaining time to expiration estimated in years; N(.) is the cumulative probability of the standard normal distribution;
and
where
represents ln(1 + expected dividend rate), where the expected dividend rate is calculated as the annual dividend paid per share divided by the year-end stock price.
Vega is calculated as
Delta is estimated as
3.4. Stock price informativeness
In the study, 1 minus the synchronicity proxy is used to estimate price informativeness. Synchronicity, which captures market information, is negatively related to firm-specific information embodied in stock prices and defined as the stock return’s sensitivity to domestic and foreign market returns in current and previous years (Li et al., Citation2015). The Chinese A-share index return is used to measure domestic market return, and the Hang Seng index return is used to estimate foreign market return. The Hang Seng index return is adopted because market open policies, such as the Shanghai–Hong Kong Stock Connect programme, have built a significant interrelationship between A-share and Hong Kong markets, and most firms in the A-share market consider the Hong Kong market as their first choice for cross-listing. The synchronicity proxy is estimated using the equation below:
(1)
(1)
where i denotes firm, t reflects year and
is an error term. Ri, RA and RH are cash dividends reinvested daily stock returns of individual firms, the A-share index and the Hang Seng index, respectively. The estimation process is repeated based on firms. R2 is abstracted from the equation and defines the synchronicity proxy as
(Li et al., Citation2015). Hence, price informativeness is measured as 1-
The study introduces a dummy variable equalling 1 if 1-
is higher than the sample median (Informativeness), suggesting high price informativeness.
3.5. Control variables
This study controls firm size (Assets) and firm age (Age) because large and old firms enjoy technological and financial advantages crucial for innovation success (Chen et al., Citation2014). The financial leverage (Leverage) is controlled because leveraged firms face more financial burdens and invest less in innovation (Hsu et al., Citation2014). The internal cash (Cash) is controlled to estimate the internal financing abilities of firms. To measure firms’ long-term development, this study uses book-to-market ratio (B/M) (Hsu et al., Citation2014). Cash compensation (Cash compensation) is considered because executives who receive high cash compensation prefer current wealth and forgo innovation (Baixauli-Soler et al., Citation2015). Moreover, the study uses annual stock return (Return) to evaluate the annual payment for equity financing (Hsu et al., Citation2014). Other controls include the property, plant and equipment ratio (PPE); sales ratio (Sales); and EBIT-to-total assets ratio (ROA) (e.g. Armstrong & Vashishtha, Citation2012). defines the control variables.
Table A4. Variable definitions.
In , the Pearson correlation coefficients (PCCs) generally do not show a severe multicollinearity problem among control variables (|PCCs|< 0.5), indicating that the control variables generally explain the dependent variables independently. However, from columns (1) to (3) of , PCCs show a weak correlation relationship between the dependent and independent variables. This might be because the dependent variables are innovation output proxies, and the relationship between the dependent and independent variables has a lagging effect.
Table A2. Correlation tests.
Table A3. Continuous patent proxies.
3.6. Empirical model
The baseline model is defined as follows:
(2)
(2)
where i denotes firms, t reflects years and j captures industries.
and
represent industry and year fixed effects, respectively.
is an error term. Innovation denotes the patent proxies in Section 3.2. Vega and Delta are described in Section 3.3. Informativeness is the informativeness dummy variable in Section 3.4. Control indicates the control variables in Section 3.5. As executive compensation takes time to affect the innovation decisions and productivity of firms, a one-year time lag of explanatory variables is considered (Chu et al., Citation2020). In EquationEquation (2)
(2)
(2) ,
(
), which captures delta (vega) incentives when stock prices are informative, is expected to be significantly positive (negative), according to Hypothesis 1 (Hypothesis 2).
This research follows many empirical studies and estimates the model using the Poisson regression method (e.g. Youssef et al., Citation2020). Specifically, let yi represent the number of patent applications (granted or valid patents) and ci the total follow-up time in the ith subgroup. The expected number of patent applications (granted or valid patents) in subgroup i is
where Xi denotes a vector of prediction variables in the ith subgroup.
represents a vector of estimated parameters.
is the expected rate function, a regression function related to the expected number of patent applications (granted or valid patents). Typically,
when the expected rate function has a log-linear form, and β is estimated using the maximum likelihood estimation method.
Poisson regression is adopted for several reasons. Firstly, the Poisson distribution is widely used to model count data (e.g. the number of typing errors on a certain page). In this study, the dependent variable is the number of patent applications (granted or valid patents) in a financial year, which can be viewed as the count data (a statistical process) obeying Poisson distribution (Youssef et al., Citation2020). Secondly, Poisson regression creates a regression-type context where count data are modelled as a response variable. Therefore, it allows us to predict the number of events within a certain period. This study attempts to predict the number of patent applications (granted or valid patents) under the influence of ESOs and price informativeness in a financial year. Poisson regression serves as a suitable tool to conduct this prediction.
4. Empirical results
4.1. Summary statistics
Panel A of presents the summary statistics of the main variables. Concerning the dependent variables, the sample means of Applications, Granted and Valid are 217.829, 141.500 and 521.733, respectively. These statistics indicate that the sample firms, to some degree, might not perform well in innovation during the sample period because the average granted patent of US firms for 1976–2005 is nearly 850 (Chava et al., Citation2013).
Concerning the explanatory variables, the sample mean of Delta (Vega) is 0.009 (0.006), indicating that the average reward executives receive from the stock price change (stock return volatility) is 0.009 (0.006).
In this study, 1 minus the synchronicity proxy in Section 3.4 is used to measure price informativeness. In , when the dummy variable, Informativeness, equals 1 (
is higher than the sample median), the sample mean of the price informativeness proxy (
) is 1.863, exceeding the average level of price informativeness (1.424) in the 2005–2010 Hong Kong market (Li et al., Citation2015). This outcome suggests that Informativeness identifies a group of A-share market firms whose price informativeness exceeds even that of firms in the developed Hong Kong market over the 2005–2010 period.
For the control variables, the sample mean of Assets is 22.264, exceeding the 10.69 in Chang et al. (Citation2015). The sample mean of ROA is 0.066, which is smaller than 0.10 in Chang et al. (Citation2015). The sample means of Leverage, Cash and B/M are 0.422, 0.187 and 0.530, respectively, exceeding 0.22, 0.17 and 0.26 in Armstrong and Vashishtha (Citation2012). The sample means of Cash compensation and Return are 14.518 and 0.270, respectively, which are smaller than 1,168 and 0.64 in Armstrong and Vashishtha (Citation2012).
4.2. Basic results
This section discusses the effects of delta and vega on corporate innovation. The results are provided in . In column (1), Vega is significantly positively related to the number of patent applications (Step④, ), suggesting that vega encourages executives to pursue risky innovation and increases firms’ annual patent applications (Cohen et al., Citation2000). However, Delta is significantly negatively related to the number of patent applications (Step③, ), supporting the argument that ESOs do not motivate patent applications through delta (Armstrong & Vashishtha, Citation2012).
Table 2. The relationship between ESOs’ incentives and innovation.
Moreover, a scenario where stock prices are informative is examined. In column (1), the interaction between Delta and Informativeness is significantly positively related to the number of patent applications (Step⑤, Figure1), indicating that informative prices amplify the positive effect of delta on innovation and increase the number of patent applications. This result supports H1. Economically, a 1% increase in delta results in an average marginalFootnote3 increase of 49.900 in patent applications when stock prices are informative, accounting for 22.908% of the sample mean of patent applications (49.900/217.829). Conversely, the interaction between Vega and Informativeness is negatively related to the number of patent applications (Step⑥, ), suggesting that informative prices mitigate the traditional positive effect of volatility (vega) on innovation (Lin et al., Citation2014). This result supports H2. Economically, a 1% increase in vega leads to an average marginal decrease of 45.284 in the number of patent applications when stock prices are informative, accounting for 20.789% of the sample mean of patent applications (45.284/217.829). In column (2) (column (3)), the results hold when the dependent variable is measured as the number of granted (valid) patents. However, the effect of informative price on innovation is uncertain because only efficient compensation linking stock prices to executives’ wealth elicits the monitoring of informative prices on innovation. In columns (1) and (2), the average impact of Informativeness on innovation is positive.
Finally, Informativeness is measured as a dummy variable equalling 1 if 1- is above the 75th percentile of its sample distribution (). The results in also indicate that the positive (negative) relationship between vega (delta) and innovation proxies is mitigated when stock prices are informative, further demonstrating the argument that price informativeness amplifies the positive effect of delta on innovation but mitigates vega incentives that traditionally encourage innovation.
Table 3. Alternative informative price dummy variable.
4.3. Lagged levels of independent variables
As ESOs might not affect innovation outputs within a year, the study considers a 2-year lagged level of explanatory variables when estimating EquationEquation (2)(2)
(2) . The results in columns (2) and (3) of indicate that informative prices strengthen (weaken) the positive effect of delta (vega) on innovation under a 2-year time lag, supporting H1 and H2. The results hold when considering the 3-year time lag of explanatory variables (columns (4) to (6)).
Table 4. The lagged levels.
4.4. Instrumental variable regressions
Innovation firms use ESOs to motivate executives to take risks (Chen et al., Citation2014). Therefore, innovation affects ESOs, which causes endogeneity problems. This section addresses endogeneity problems using the instrumental variable (IV) regression method.
Firms’ stock performance, which is influenced by industry-related factors such as competition, is associated with the stock performance of industries (Piotroski & Roulstone, Citation2004). Vega and delta, therefore, are also influenced by industry stock market performance. However, individual firm characteristics (e.g. innovation) might not be directly associated with industry stock performance (Piotroski & Roulstone, Citation2004). Hence, stock performance of industries, measured as the median of industry firms’ annual cash dividends reinvested stock returnsFootnote4 (Industry_return) and the median of industry firms’ annual stock pricesFootnote5 (Industry_price), is used as the excluded IV. The first-step F-statistics in columns (1) and (3) of are significant at the 1% level, indicating that estimated IVs are efficient. The second-step regression results in columns (1) to (3) of support the main findings.
Table 5. IV regressions.
Table A1. The first stage regression.
This study uses alternative excluded IVs, namely stock liquidity proxies, for robustness checks. Stock liquidity is related to firms’ stock performance (delta) (Lee & Liu, Citation2011), volatility (vega) (Autore et al., Citation2011) and price informativeness (Lee & Liu, Citation2011), but there is little evidence of a direct influence of innovation on liquidity (Autore et al., Citation2011). Liquidity measures include the Amihud illiquidity proxy (Amihud), defined as the annual median of absolute daily abnormal stock returns scaled by the daily trading volume in million yuan; and the annual turnover rate (Turnover), measured as the annual median of daily trading volume to the number of tradable shares ratio (Autore et al., Citation2011). The first-step F-statistics (columns (2) and (4), ) are significant, indicating that estimated IVs are efficient. In columns (4) to (6) of , the second-step regression results align with those in columns (1) to (3) of .
4.5. Alternative definitions of stock price informativeness
The interrelationship between the Chinese A-share market and the US stock market has been significant in recent years. A-share firms can cross-list shares on US stock markets such as NYSE and NASDAQ, and US investors can invest simultaneously in Chinese firms that issue A and B shares. Thus, changes in US macroeconomic policies influence the financing and investment of Chinese firms, in turn affecting the performance of the A-share market. Accordingly, this study includes the daily return of the S&P 500 index (current and one-day lagged levels) in EquationEquation (1)(1)
(1) , abstracts the estimated R2 and defines Informativeness as a dummy variable equalling 1 if
exceeds the sample median. The results in columns (1) to (3) of demonstrate H1 and H2.
Table 6. Alternative proxies of price informativeness.
Yin et al. (Citation2019) also suggest a synchronicity measure specially used in the A-share market. Synchronicity is estimated as
(3)
(3)
where
is cash dividends reinvested daily stock returns of individual firms.
and
are current and one-day lagged daily industry returns, respectively. Daily industry returns are the market-value weighted average of industry firms’ cash dividends reinvested daily stock returns. The estimated R2 allows us to construct an informative price proxy with a definition that parallels those mentioned above. The results in columns (4) to (6) of demonstrate the main findings.
In columns (7) to (9) of , Informativeness is calculated using the Fama–French three-factor model following Ferreira et al. (Citation2011). Specifically, I regress the dividends reinvested daily stock returns on the Fama–French three factors (Ferreira et al., Citation2011), abstract R2 and build the Informativeness dummy variable mentioned above. The results in columns (7) to (9) of support the main findings.
4.6. Further discussions
4.6.1. Deep-in-the-money options
Executives who are richly rewarded by deep-in-the-money options tend to exercise options to realise current wealth (Baixauli-Soler et al., Citation2015). In this scenario, the delta incentives of executives are weakened (Baixauli-Soler et al., Citation2015) and the positive effect of delta on innovation is reduced. The moneyness of ESOs is calculated as the year-end stock price divided by the average strike price of outstanding options and a deep-in-the-money dummy variable (Deep, ) is introduced (Chang et al., Citation2015). I include interaction among Delta, Informativeness and Deep in EquationEquation (2)(2)
(2) and expect a negative coefficient. That is, when ESOs are deep-in-the-money, executives who capture current wealth have lower delta incentives and invest less in innovation. Moreover, delta incentives are significantly weakened when stock prices are informative because informative prices absorb existing volatility factors and leave only small price changes (Lee & Liu, Citation2011), which encourage executives to exercise their ESOs and reap current wealth. However, if executives are not satisfied with current profits, they might seek new volatility factors and create opportunities for future price run-ups (expected wealth) (Chen et al., Citation2014). Therefore, executives are likely to take risks, which results in volatility. In particular, vega incentives are strengthened.
presents the results. In column (1), the coefficient of interaction among Delta, Informativeness and Deep is significantly negative (−30.515), indicating that when ESOs are deep-in-the-money, informative prices leave only small price changes. Executives who are keen to capture current wealth have lower delta incentives and invest less in innovation. The coefficient of interaction among Vega, Informativeness and Deep is significantly positive (45.914), suggesting that vega encourages executives to engage in innovation, which creates new volatility factors captured by informative prices and results in future price run-ups when ESOs are deep-in-the-money. The results hold when using IV regressions in columns (4) to (6). Excluded IVs are Industry_return and Industry_price in Section 4.4.
Table 7. Deep-in-the-money options.
4.6.2. Subsample analysis
CEO compensation plans have unique features concerning the state-owned background. State-owned enterprises (SOEs), which state shareholders control, are often used as tools to implement government economic policies. Therefore, CEO compensation plans in SOEs are sometimes related to government policies (Laporšek et al., Citation2020). In this scenario, external investors need to monitor SOE managers through other governance mechanisms, such as stock price pressure (Huang & Zhu, Citation2015). In this section, I introduce a state-owned dummy variable (SOE, ) and include interaction among Delta (Vega), Informativeness and SOE in EquationEquation (2)(2)
(2) . The results presented in columns (1) to (3) of provide further evidence and demonstrate that informative prices monitor SOEs to engage in innovation by enhancing delta incentives (positive coefficients of (Delta*Informativeness*SOE)), whereas informative prices, which are negatively related to noise volatility, reduce vega incentives on SOE innovation (negative coefficients of (Vega*Informativeness*SOE)). Specifically, combining informative prices with traditional governance mechanisms ESOs is possible when monitoring SOEs.
Table 8. Subsample analysis.
Moreover, the study investigates the scenario in which managers and directors hold the firm’s stocks. The study introduces a proxy measuring the percentage of manager and director shares (M&D_share, ) and constructs interaction among Delta (Vega), Informativeness and M&D_share. The results presented in columns (4) to (6) of suggest that a higher level of manager and director shareholding strengthens the delta incentives on innovation when stock prices are informative (positive coefficients of (Delta*Informativeness*M&D_share). This might be because managers and directors holding a large stake in a firm have strong incentives to maintain stock price increases and avoid great stock return volatility. Therefore, delta has a larger effect on encouraging innovation.
Finally, the board structure (e.g. percentage of independent directors) might impact the governance standard. Better governance improves the information environment of firms and benefits stock price informativeness. Accordingly, I include a proxy estimating the percentage of independent directors (Independent, ) and interaction among Delta (Vega), Informativeness and Independent. In columns (7) to (9) of , the positive coefficients of (Delta*Informativeness*Independent) indicate that independent directors provide governance and lead managers to disclose more high-quality firm-specific information, further improving firms’ information environment. In this scenario, information embodied in stock prices has higher qualities and is more likely to reflect the value of innovation. As mentioned earlier, when stock prices reflect innovation values and positively respond to the value-enhancing decisions of managers, the delta effect on encouraging valuable innovation is enhanced.
4.6.3. Stock return volatility
In this section, I estimate the prediction that price informativeness is negatively related to noise volatility by modifying the model suggested by Lee and Liu (Citation2011). Annual stock return volatility (Volatility) is measured as the annual standard deviation of a firm’s cash dividends reinvested daily stock returns. Price informativeness is calculated as -ln(PIN index for year t) (Log_PIN). PIN is the probability of information-based trading. When stocks are less informative, the probability of information-based trading is higher; thus, the PIN is high. Another informative proxy is PIM calculated as -ln(0.0001 + APIM). APIM is the annual average of the absolute daily return divided by the daily RMB volume of trade (in millions). The higher PIM (Log_PIN) indicates higher stock price informativeness (Lee & Liu, Citation2011).
This study views noise traders as external individual investors (Huang & Zhu, Citation2015). I introduce a ratio of stocks held by external individual investors to total shares in a firm (Noise) and regress annual stock return volatility on an interaction between Noise and Log_PIN (PIM), estimating whether price informativeness reduces volatility when noise traders hold more shares. Control variables include Assets, B/M, Leverage, ROA and the volatility of ROA (VROA) (Lee & Liu, Citation2011). The results in suggest that firms with higher stock price informativeness experience lower stock return volatility, especially when noise traders hold more shares. This result supports the argument that price informativeness is negatively related to the noise component of volatility.
Table 9. Noise traders, price informativeness and stock return volatility.
5. Conclusion
This study examines the relationship between ESOs and firms’ innovation performance when stock prices are informative. The findings indicate that the effect of delta on encouraging innovation is enhanced when stock prices are informative but that informative prices alleviate the traditional positive effect of vega on innovation. However, when stock prices are informative, deep-in-the-money options reduce the positive effect of delta on innovation, whereas the state control, independent directors and manager and director shareholding enhance (reduce) the positive effect of delta (vega) on innovation.
The results have implications. Firstly, most studies have focused on developed markets where information updating is the main driving force of stock return volatility. However, in emerging markets, volatility is dominated by noise, which is negatively related to informative prices (Lin et al., Citation2014). This study demonstrates that in the Chinese A-share market, informative prices, which are negatively related to volatility, alleviate the positive effect of vega on innovation. Secondly, some characteristics of stock prices (e.g. price informativeness) impact ESO contract design. The study demonstrates a positive effect of delta on innovation when stock prices are informative. Consequently, when stock prices are informative, directors set lower exercise prices, which increase the delta incentives of executives and encourage innovation. However, as delta incentives are weakened when ESOs are deep-in-the-money, directors must grant new at-the-money ESOs to renew executives’ sensitivity to stock prices. Thirdly, this study highlights the importance of ESOs in motivating executives to take risks and engage in innovation. Executives compensated by ESOs tend to create opportunities that lead the stock price to exceed the exercise price. Innovation, which benefits firms’ long-term development, receives positive market reactions and allows executives to reap the rewards of their ESOs.
Disclosure statement
The author reports there are no competing interests to declare.
Data availability statement
Raw data were generated at Shenzhen SCMAR Data Technology Co., Ltd. Derived data supporting the findings of this study are available from the corresponding author on request.
Notes
1 The statistics are from the National Bureau of Statistics of the People’s Republic of China.
2 The results in Table A3 hold when using the natural logarithm of 1 plus the number of annual patent applications (granted or valid patents) (Log_applications, Log_grant and Log_valid).
3 As y’s sensitivity to xi () might be a function of xi (
), it is necessary to calculate the marginal effect of x on y, which is estimated as
The Stata command is margin, dydx(varlist).
4 The industry classification was published by the China Securities Regulatory Commission in 2012.
5 Firms’ annual stock prices are defined as the annual median of their daily close prices.
References
- Armstrong, C., & Vashishtha, R. (2012). Executive stock options, differential risk-taking incentives, and firm value. Journal of Financial Economics, 104(1), 70–88. https://doi.org/10.1016/j.jfineco.2011.11.005
- Autore, D. M., Billingsley, R. S., & Kovacs, T. (2011). The 2008 short sale ban: Liquidity, dispersion of opinion, and the cross-section of returns of US financial stocks. Journal of Banking & Finance, 35(9), 2252–2266. https://doi.org/10.1016/j.jbankfin.2011.01.026
- Baixauli-Soler, J. S., Belda-Ruiz, M., & Sanchez-Marin, G. (2015). Executive stock options, gender diversity in the top management team, and firm risk taking. Journal of Business Research, 68(2), 451–463. https://doi.org/10.1016/j.jbusres.2014.06.003
- Black, F., & Scholes, M. (1973). The pricing of options and corporate liabilities. Journal of Political Economy, 81(3), 637–654. https://doi.org/10.1086/260062
- Chang, X., Fu, K., Low, A., & Zhang, W. (2015). Non-executive employee stock options and corporate innovation. Journal of Financial Economics, 115(1), 168–188. https://doi.org/10.1016/j.jfineco.2014.09.002
- Chava, S., Oettl, A., Subramanian, A., & Subramanian, K. V. (2013). Banking deregulation and innovation. Journal of Financial Economics, 109(3), 759–774. https://doi.org/10.1016/j.jfineco.2013.03.015
- Chen, Y., Chen, C., & Chu, C. (2014). The effect of executive stock options on corporate innovative activities. Financial Management, 43(2), 271–290. https://doi.org/10.1111/fima.12036
- Chu, Y., Liu, M., Ma, T., & Li, X. (2020). Executive compensation and corporate risk-taking: Evidence from private loan contracts. Journal of Corporate Finance, 64, 101683. https://doi.org/10.1016/j.jcorpfin.2020.101683
- Cohen, R., Hall, B., & Viceira, L. (2000). Do executive stock options encourage risk taking? Working Paper. Unpublished manuscript, Harvard University.
- Ferreira, D., Ferreira, M., & Raposo, C. (2011). Board structure and price informativeness. Journal of Financial Economics, 99(3), 523–545. https://doi.org/10.1016/j.jfineco.2010.10.007
- Hayes, R., Lemmon, M., & Qiu, M. (2012). Stock options and managerial incentives for risk taking: Evidence from FAS 123R. Journal of Financial Economics, 105(1), 174–190. https://doi.org/10.1016/j.jfineco.2012.01.004
- Hsu, P. H., Tian, X., & Xu, Y. (2014). Financial development and innovation: Cross-country evidence. Journal of Financial Economics, 112(1), 116–135. https://doi.org/10.1016/j.jfineco.2013.12.002
- Huang, W., & Zhu, T. (2015). Foreign institutional investors and corporate governance in emerging markets: Evidence of a split-share structure reform in China. Journal of Corporate Finance, 32, 312–326. https://doi.org/10.1016/j.jcorpfin.2014.10.013
- Laporšek, S., Dolenc, P., Grum, A., & Stubelj, I. (2020). Ownership structure and firm performance – The case of Slovenia. Ekonomska Istraživanja/Economic Research, 1–21. https://doi.org/10.1080/1331677X.2020.1865827
- Lee, D., & Liu, M. (2011). Does more information in stock price lead to greater or smaller idiosyncratic return volatility? Journal of Banking & Finance, 35(6), 1563–1580. https://doi.org/10.1016/j.jbankfin.2010.11.002
- Li, S., Brockman, P., & Zurbruegg, R. (2015). Cross-listing, firm-specific information, and corporate governance: Evidence from Chinese A-shares and H-shares. Journal of Corporate Finance, 32, 347–362. https://doi.org/10.1016/j.jcorpfin.2014.10.008
- Lin, K., Karim, K., & Carter, C. (2014). Stock price informativeness and idiosyncratic return volatility in emerging markets: Evidence from China. Review of Pacific Basin Financial Markets and Policies, 17(04), 1450025–1450028. https://doi.org/10.1142/S0219091514500258
- Merton, R. (1973). Theory of rational option pricing. The Bell Journal of Economics and Management Science, 4(1), 141–183. https://doi.org/10.2307/3003143
- Piotroski, J. D., & Roulstone, D. T. (2004). The influence of analysts, institutional investors, and insiders on the incorporation of market, industry, and firm‐specific information into stock prices. The Accounting Review, 79(4), 1119–1151. https://doi.org/10.2308/accr.2004.79.4.1119
- Tiron-Tudor, A., & Achim, A. (2019). Accounting quality and stock price informativeness: A cross-country study. Economic Research-Ekonomska Istraživanja, 32(1), 2481–2499. https://doi.org/10.1080/1331677X.2019.1650655
- Youssef, A. H., Abonazel, M. R., & Ahmed, E. G. (2020). Estimating the number of patents in the world using count panel data models. Asian Journal of Probability and Statistics, 6(4), 24–33.
- Yin, Z. H., Yang, S. Z., & Chen, Q. Y. (2019). Could analysts reduce stock price synchronicity – A textual analysis based on analyst report. China Industrial Economics, (001), 156–173. (in Chinese)
- Zhao, Q., & Huang, D. (2013). An empirical study on executive power and plan of stock option. Journal of Chongqing University (Social Edition), 19(3), 65–72. (in Chinese)
Appendix