
 ?Mathematical formulae have been encoded as MathML and are displayed in this HTML version using MathJax in order to improve their display. Uncheck the box to turn MathJax off. This feature requires Javascript. Click on a formula to zoom.
Abstract
No one denied the significant role of transportation infrastructure in economic development; however, it is also considered a major contributor to global warming. Therefore, to achieve sustainable development, it is imperative to transform the transport sector investment into low-carbon transportation choices. The public-private partnership investment in the transport sector could be proved a suitable tool for sustainable transport and efficiency. Therefore, we investigate the significance of public-private partnership investment (PPP) on transport emissions by incorporating the role of environmental innovation, economic growth, and population. Our preliminary findings confirm that all variables are abnormally distributed and embodied with structural breaks that distort true parameters in traditional regression. In compliance, we employ Quantile ARDL (QARDL) technique which provides more reliable results in case of non-normality, dynamic trends, and structural changes in data. The long-run empirical outcomes indicate that PPP reduces transport emissions mainly from middle (40th) to highest (95th) emissions quantiles. Similarly, environmental innovation reduces transport emissions from 60th to 95th quantiles. These results imply that the emissions-mitigating effect of PPP and environmental innovation is only pronounced at higher levels of transport emissions. The results provide valuable policy recommendations.
1. Introduction
Achieving the high standards of sustainable development goals (SDGs) of transportation systems entails a steadiness of the three main pillars of sustainable development, which includes environmental, social, and economic stability of that country. Conferring to the 17 SDGs goals approved by United Nations, for the transportation systems, to accomplish environmental sustainability, the SDGs includes clean water and sanitation, clean energy, climate-related goals, and life and land (Fang et al., Citation2022). The private sector is a significant stakeholder in achieving the SDGs, as the private sector accounted for a significant share of the economies (Abe et al., Citation2019; Hacking, Citation2019; Marx, Citation2019; Topple et al., Citation2017). The private sector is a job inventor, source of tax income, source of capital, and a source of technological innovation, and are the major stability drivers of the economy and eco-system (Frey & Sabbatino, Citation2018) and also plays a significant role in the society through financial resources, technology, knowledge, and expertise (Buhmann et al., Citation2019). The sustained economic development of India is highly contingent on sustainable infrastructure development, mainly in the transport sector. An estimate has specified, to endure to grow at 8% annual, Indian infrastructure sectors require investments of approximately $500 billion in 2007–2012, of which 30% goes to the private sector, as public resources were insufficient to meet such massive investments. In 2020, a total of 1824 PPP projects cost USD 327 Billion are on different phases of implementation in the country. Out of these on average 57% of the projects are attributed to the transport sector.
In the present times, climate change has been perhaps the greatest task to accomplish worldwide sustainable development (World Bank, Citation2000). Global warming causes destruction, for instance, decreasing biodiversity, rising ocean levels, diminishing food production, and increased mortality from diseases (An et al., Citation2021). The major reason for these irreparable catastrophes is the massive volume of CO2 and greenhouse gas (GHGs) emitted by fossil fuel burning, e.g., coal and oil, and demolishing forests (ecosystems). A huge amount of GHGs have been produced as a result of the improper activity of mankind, which has a very large transmission system to observable light of solar ejection as well as greatly absorb the large wave released from the ground and they can easily captivate the infrared radiation which emits from the earth. As a result, the temperature of the earth enhances, and it ultimately causes climate change on the global level (Shahbaz et al., Citation2020). Manifestly, the transport sector consumes a considerable amount of fossil fuels. Thus, it is a significant source of destructive greenhouse gases that needs to be deal (Saighani & Sommer, Citation2017).
It is considered that transport is one of the most complicated sectors to decarbonize (Lah, Citation2015), as the transportation infrastructure is regarded as highly capital intensive (Georgatzi et al., Citation2020; H. Zhang et al., Citation2021). Therefore, to reduce environmental pollution and achieve sustainable development goals (Cf, Citation2015), it is very imperative to encourage private investors to take part in transportation infrastructure. According to International Energy Agency, the transport sector produces almost 25% of the overall CO2 emission, which can be double by 2050 (International Energy Agency (IEA), Citation2020). Therefore, the transportation sector is a leading cause of human health deterioration through air pollution (Anenberg et al., Citation2019; World Health Organization (WHO), Citation2006). In 2017, air pollution was accountable for almost 3.5 million premature deaths due to lower respiratory contagions, stroke, lung cancer, ischemic heart disease, and chronic obstructive pulmonary diseases (Anenberg et al., Citation2019). India is one of the fastest-growing sources of carbon emanations, primarily from oil ignition. India’s transport sector is alone accountable for approximately 13.5% of energy-related CO2 emissions, with which the transport sector contributes 90% of the sector’s final energy consumption.
Moreover, capital is a fundamental factor for the economies during the procedure of low-carbon conversion, and investment in low-carbon projects is an essential part of it (Fulton & Capalino, Citation2014; McCollum et al., Citation2013). The conversion to a low-carbon economic development model from a high economic development model is a complex and considerable issue in the entire economic development phase (Irfan et al., Citation2022). This transition from high carbon projects to low carbon projects has got the great interest of businessmen, policymakers, and researchers worldwide. Due to the government's inadequate resources and the persistent increment in demand for transport, policymakers have collaborated with private sector investors and local communities to promote the transport infrastructure. Chan et al. (Citation2009) argued that the private sector's collaboration is a solution to these problems as the private sector provides financial support, advanced technology, and efficient management to the public projects.
The public-private partnership (PPP) is an engagement of public and private sectors to provide public services or construct public assets with private investors' collaboration (Tang et al., Citation2013). Most of the time, those infrastructure projects that directly framed and handled by the government are usually resulting in project disasters due to the lack of cost control and risk administration. The main advantages of grouping with the private sector, including professionalism, experience, optimal use of resources, and enhancing the efficiency of operational projects (Xu et al., Citation2015). Numerous infrastructure PPP projects have been deliberate and even completed successfully in developed and developing countries, so the government's financial burden relieves (Zhang et al., Citation2016). The enthralling phenomenon in developing economies is that the PPP model makes available the necessary resources ready to produce the public commodities and services by the management and investment of the private sector (Jamasb et al., Citation2018). The risks of any project can be better projected by the private sector (Ameyaw & Chan, Citation2015). Economic benefits are the main driving force for the private companies involved in the PPP, so their risk factor management is more efficient. Moreover, the probability of wasting resources in the project is very low in the private sector related to the involvement of the government sector (Xin-Gang et al., Citation2016).
The integration of private capital in public transport enables the competition between public and private sectors that helps to achieve the standard of sustainable development. Even, this practice is widely followed in developed countries (Costa & Fernande, Citation2012). PPP has become the main interest of many developed and developing countries globally, especially after 2000 due to its possible social, economic, and environmental advantages (Ho, 2016; Los Ríos-Carmenado et al., Citation2016; Medda et al., Citation2013).
The PPP is established by the Government of India in 2011 and today, there are hundreds of PPP projects in several phases of operation in the country. In 2020, approximately 1,103 PPP projects of investment $274,959,000,000 were launched throughout the country. Indian infrastructure is deprived as compared to similarly developed countries (Raju, Citation2011). In this regard, the Government recognized PPP as an imperative tool to fill the potential transport infrastructure gap across the country. In the 1990s, during the first liberalization wave, numerous attempts have been taken to endorse PPPs. Approximately 60% of 3 P projects are for the transportation sector and they indorsed 45% of 3 P monetary value. Through PPP, the Indian transportation sector is putting its efforts to combat transportation combustion and transport-induced pollution. While considering the restructuring of the prevailing policies in India for observing in the context of the 2030 program, it is essential to propose a holistic SDG agenda. In this respect, the present study attempts to investigate the impressions of PPP investment, environmental innovation on transport CO2 emissions in India for the period 1990Q1–2018Q4.
Apart from the above motivation, another decisive task is to adopt a best-fitted methodology to wrap the gaps and provides the detailed and reliable exposure of the association between the variables. This study aids the investors and policymakers to make operative decisions regarding the PPP in the transportation system and their implication on environmental quality. Unlike, traditional model, where average effects of investment and other technology variables are estimated on emissions based on the assumption of data normality. We argued that the emission mitigating (increasing) effect of any economic variable does not remain the same across all emissions levels. This is also confirmed from our preliminary findings, which suggest that data of Indian transport emissions, eco-innovation, and PPP is not normally distributed enables us to apply non-linear estimators. Thus, we apply quantile autoregressive distributed lag approach (QARDL) model that helps to explore the asymmetric effects of PPP, and eco-innovation at different levels of transport emissions. To the best of our knowledge, no significant study has been found that explored this phenomenon using the Indian dataset, particularly the heterogeneous effects are entirely missing in PPP literature. Extent literature estimates asymmetric effects at country level to found in-depth relationship (Ullah et al. Citation2021; Usman et al., Citation2021b).
The QARDL method has been familiarized by Cho et al. (Citation2015), and it delivers a more elite way of examining the dynamics of long-run and short-run association over the quantiles and also provides a consistent econometric framework to assess the asymmetric nexus of selected variables. It is worth mentioning that, economic shocks, policy shifts, financial turmoil, and changes in government policies possess abrupt effects on PPP, innovation output, and emissions, thus it is imperative to explore the asymmetric effect to integrate these shocks at extreme low or high quantiles. The overall results confirm that the PPP and eco-innovation reduce transport emissions however, their emission mitigating effects are not the same across lower and higher emissions quantiles. These findings help the legislatures to evaluate the environmental performance of transport infrastructure projects under PPP and re-direct policies to maximize efficiency
The rest of the paper has been organized as follows: The review of previous studies is covered in section 2, methodological framework is defined in section 3. Empirical findings and their possible justifications are discussed in section 4, and finally, section 5 concludes the paper and provides policy implications.
2. Literature review
The present study examines the link between PPPT and transport emission by considering the role of population, environmental innovations, and economic growth in case of India. The connotation between PPPT and environmental degradation is relatively overlooked in the existing literature. However, we found few studies which have explored the impression of PPPT on environmental deterioration. Such as, Cruz and Katz-Gerro (Citation2016) documented that transport-related pollution might be reduced through the improvement of fuel efficiency and by the adoption of modern technology, which is possible with the collaboration of private sector investment. Similarly, by using the data of eight Asian economies, Lin and Omoju (Citation2017) claimed that private sector investment is helpful for sustainable and environment-friendly transport. Xue et al. (Citation2017) argued that the goal of sustainable transport could be achieved through private sector collaboration in transport infrastructure instead of the traditional mode of investment.
Nowadays, the role of transportation sector and economic growth on environmental degradation is a highly debated topic. Numerous empirical studies have examined the link between above-cited indicators by using different techniques, regions, and datasets, but the outcomes of these studies are generally mix and inconclusive. For instance, Xu and Lin (Citation2016) explored the link between energy usage, GDP, and urban population on carbon emission of transport sector. They suggested that urban population, GDP, and energy usage have a positive effect on carbon discharge. Danish et al. (Citation2018) found that energy utilization in the transport sector is a source of carbon emanation in Pakistan. Transportation developments have substantial economic, environmental, and social impressions on stakeholders, humanities, and regions. In terms of the environmental effects, there is a significant correlation among transportation development, population, and per capita energy consumption. However, the structure and operation of transportation plans also bring harmful environmental effects due to manifold contaminations during the lifecycle process.
Saighani and Sommer (Citation2017) examined the link among energy usage and transport CO2 emission. They suggested that transport induced pollution could be reduced through the utilization of renewable energy in transport sector. Saboori et al. (Citation2014) proved the causal link between GDP and transport-related carbon discharge in OECD economies, during 1960–2008. For Asian economies for the period 1980–2005, Timilsina and Shrestha (Citation2009) documented that per capita income and transportation energy usage are the main driving force behind the carbon emanation. Xu and Lin (Citation2016) estimated that energy efficiency has an inverse association with transport-related CO2 emanation. Wang et al. (Citation2011) claimed that economic growth is a leasing driving force behind transport-related CO2 emissions.
By using the data of Tunisia from 1980 to 2014, Talbi (Citation2017) verifies the presence of EKC hypothesis between income and transport CO2 emission. Li et al. (Citation2016) scrutinized the progressive link between economic growth and transport CO2 emissions in case of China for 1995–2012. Shen and Chi (Citation2012) analysed that urbanization is a key reason of transport CO2 emissions in China during 1991–2009. The same outcomes were claimed by Lin and Xie (Citation2014) for China during 1981–2010. They claimed that urbanization and income increasing transport carbon emanation. During 1980–2010, Shahbaz et al. (Citation2015) documented that energy usage increases carbon discharge in Tunisia. By using quantile regression for China in the period of 2000–2012, Xu and Lin (Citation2018) probed that income and urbanization are rising TCO across all the quantiles. During 1975–2015, Mohsin et al. (Citation2019) explored the link between income, urbanization, and TCO for Pakistan. They found that urbanization and income increase TCO. They also found the presence of EKC hypothesis in Pakistan. By using data span from 2001 to 2004, Liang et al. (Citation2017) claimed that GDP upsurges the TCO in China (Y. Zhuang et al., Citation2021).
Baloch et al. (Citation2021b) explored the link between green innovation and environmental pollution in case of OECD economies. They found that green innovation reduces environmental deterioration. Similarly, by using FMOLS approach for BRICS countries, Baloch et al. (Citation2021a) probed that green innovation impedes GHG emissions and verified the presence of EKC hypothesis in BRICS countries during 1996–2016. Álvarez-Herránz et al. (Citation2017) scrutinized the impact of public investment for the energy sector on ecological footprint in the OECD economies from 1990 to 2014. The regression verdicts explored that energy innovation expands the overall quality of the environment by dropping carbon emissions. Ganda (Citation2018) investigated the influence of renewable energy investment on ecological quality by using the data of OECD nations. The empirical results demonstrated that investment in green energy decreases carbon emission as well as increases the overall ecological quality (Adedoyin et al., Citation2021).
Waqih et al. (Citation2019) queried the impression of private investment on carbon emission in case of SAARC countries. They established an inverted-U-shaped connotation between private investment and ecological dilapidation. They pointed out that at the initial stage of the relationship environmental pollution increases but after a threshold point it starts to be decline. Similarly, Shahbaz et al. (Citation2018) explored the association between research and development as an indicator of public investment in energy sector and carbon emission in case of French. For this purpose, they applied bootstrapped ARDL approach. The empirical verdicts recommended that public investment in green energy reduces environmental pollution by reducing carbon emissions. The result of causality test confirms the unidirectional causality from energy sector public investment to environmental degradation. Balsalobre-Lorente et al. (Citation2019) explored the influence of public budget for green energy on environmental deterioration for OECD economies. They found EKC hypothesis during the period 1995–2016 for OECD economies. They also found that public investment in green energy has a negative and significant impression on environmental deterioration. The existing studies have used several indicators, such as economic growth (Anser et al., Citation2021; Farooq et al., Citation2021), renewable energy (Anser et al., Citation2021a; Anwar et al., Citation2021d; Salem et al., Citation2021; Syed & Bouri, Citation2021; Usman et al., Citation2021c), non-renewable energy (Anser et al., Citation2021b; Cai et al., Citation2021; Jahanger et al., Citation2021; Usman et al., Citation2021a; Yang et al., Citation2021), and technological innovation (Anwar et al., Citation2021a; Anser et al., Citation2021) for achieving the sustainable development goals. But there are few empirical studies which incorporate the role of public private partnership in transport sector on transport emission. Therefore, in this study we examine the impact of PPPT in transport on transport emission.
3. Data and methodology
3.1. Theoretical framework
According to World Bank Institute (Citation2017), ‘PPP is a contract between the government agency and private party for providing public asset or services, in which private party takes risk and management responsibility’. The theoretical foundations of PPP are based on x-efficiency theory (Leibenstein, Citation1966), which highlighted the role of PPP in reducing the sources of x-efficiency (Hammami et al., Citation2006). During the 1990s, the PPP has gained further acceptance due to the new public management (NPM) (Pedersen & Lofgren, Citation2012). PPP is encouraged by NPM as an instrument for the provision of public infrastructure to reduce the financial burden of governments (Casady et al., Citation2020). Due to the different advantages such as low cost of projects, improved service quality, and reduction in project completion time (Albalate et al., Citation2018). This study inspects the effect of public-private partnership investment in the transport sector on transport emissions for India.
3.2. Model specification
The primary goal of this study is to explore the effects of key driving forces impacting the TCO in India. In doing so, we followed the theoretical foundation of STIRPAT model, where technology, growth, and population are considered three core factors of emissions. We have extended the same model for transport emissions by integrating the theoretical underpinning of PPP as a new regressor.
(1)
(1)
In the above equation, TCO represents the transport carbon emissions, which is used as a dependent indicator in this study. PPP, EI, GDP, GDP2, and POP shows the public-private partnership investment in transport, environmental innovations, GPD per capita, square of GDP per capita (EKC), and population, respectively. The sign of ‘ln’ and ‘e’ indicates the logarithm form of the indicators and error term respectively, whereas b1, b2, b3, b4, and b5 are the coefficients.
3.3. Description of data
In this study, we used quarterly time-series dataset from 1991Q1 to 2019Q4 with a total 116 observations of each variable. The data for public-private partnership investment, economic growth, and population are gathered from world development indicators (World Bank, Citation2020). The data for transport CO2 emissions and environmental innovations are extracted from the international energy agency (International Energy Agency (IEA), Citation2020) and the organization for economic co-operation and development (OECD, Citation2020) respectively. Further, presented the variables information, including specifications, abbreviations, and source of data. To overcome the issue of a shorter time, we have utilized a quadratic match-sum approach to transform yearly data into quarterly data by following Shahbaz et al. (Citation2020), and Razzaq et al. (Citation2021b). The quadratic match-sum approach is quite inspective due to adjustment of cyclical variation in data and seasonality issues is avoided as this procedure decreases the point-to-point data variations (Shahbaz et al., Citation2017; Sun et al., Citation2022)).
Table 1. Description of variables.
3.4. Methodology
3.4.1. Quantile autoregressive distributed lagged method:
To estimates the influence of GDP, EI, PPP and POP on TCO for India across the grid of quantiles, we use QARDL technique offered by Cho et al. (Citation2015). QARDL model produced long run equilibrium effect of GDP, EI, PPP and POP on transport pollution. We also use the Wald-test which inspected the constancy of the estimated coefficients crosswise the quantiles. There are three major preferences behind the adoption of QARDL model instead of linear model. First, this technique produces both long term as well as short term dynamic connections between the dependent and independent indicators over different quantiles. Secondly, most of the studies claimed no-cointegration between the indicators by using a linear model such as ARDL and Johansen (Citation1988) cointegration test. These contrary outcomes could be inferred as the occurrence of ‘quantile-varying cointegration coefficient’ both for short and long term (Xiao, Citation2009). Thirdly, this technique allows for location-related asymmetry impacts as the parameters might be depending on the location of the TCO, predicted indicator, rather the conditional distribution. Based on the above properties, the QARDL technique is considered to be the utmost suitable approach that includes both non-linear and asymmetric relations. Following is the derivation of asymmetric ARDL.
(2)
(2)
The above EquationEq. (2)(2)
(2) represents TCO, GDP, GDP2, PPP, EI and POP as transport carbon emission, per capita income, square of per capita GDP, and public private partnership investment in transport, environmental innovation and population. The term ϵt explain as error term, which describes TCOt – E[TCOt/σt–1] where σt–1 shows the least σ-field of {TCOt, GDPt, GDP2t, PPPt, EIt, POPt, TCOt–1, GDPt–1, GDP2t–1, PPPt–1, EIt–1, POPt–1}and signs v, u, s, q, and p indicate lag order criterion of Schwarz information (SIC).
EquationEquation (3)(3)
(3) is the extension form of EquationEq. (2)
(2)
(2) , the quantile estimations are presented in the extended model as under:
(3)
(3)
Where, ϵt(τ) = TCOt – QTCOt (τ/υt–1) and 1 > τ > 0 indicates quantile (Kim & White, Citation2003). The serial correlation in EquationEq. (2)
(2)
(2) describes as,
(4)
(4)
Following is the QARDL error correction model of dynamic quantile.
(5)
(5)
By using delta approach, the short-run impression of emanated transport emission on present emission of transport emission has been estimated by whereas the combined short-term impact of the preceding and present levels of GDP, GDP2, PPP, EI, and POP is estimated by
and
respectively. The parameters which are associated to GDP, GDP2, PPP, EI, and POP are determined as,
βGDP*= - βGDP/ρ, βGDP2*= - βGDP2/ρ, βPPP*= - βPPP/ρ, βEI*= - βEI/ρ, and βPOP*= - βPOP/ρ
3.4.2. Quantiles causality
We use Granger-causality in quantiles technique to observe the causality among the TCO and independent indicators of the model. According to Granger (Citation1969), an indicator yi would not be the Granger cause of indicator xi if previously yi is not ratified to forecast xi as long as formerly xi. To detect the causal association in the different grid-iron of quartiles of TCO2 emanation and other explanatory variables, we borrowed a causality technique named ‘Granger-causality in quantiles’. It is developed by Granger (Citation1969), a factor yi does not Granger cause to other factor xi if previously yi does not encourage to forecast xi, as long as the preceding xi. For example, there is an explaining vector mi=(mix, mi y)0 ∈ Re, e = 0 + q, where mi y are the previous outcomes of yimiy = (yi − 1, …. ., yi − q)0 ∈Rq. In this scenario, the present study formed a null hypothesis as narrated below: This test hypothesis that the contemporaneous value of TCO2 is contingent to its own values or previous values of the independent variable. In this study, to scrutinize the quantile-causal of TCO2 with economic innovation, GDP, and population, we use Granger-causality in quantiles technique established by Troster (Citation2018).
4. Results and discussion
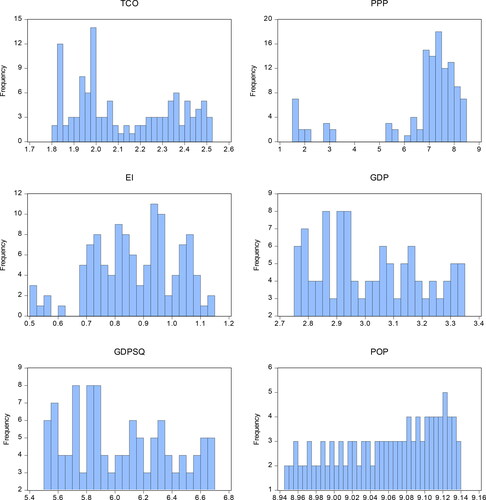
The descriptive statistics are presented in , which indicates that all variables have a positive mean. TCO has a mean value of 2.219 which lies between 1.818 and 2.520. The mean value of PPP is 6.623 which lies between 1.535 and 8.399. Similarly, EI, GDP, and POP possess the mean values 0.871 (falls between 1.138 and 0.503), 3.029 (falls between 3.342 and 2.754), and 9.054 (falls between 9.137 and 8.947) respectively.
Table 2. Results of descriptive statistics.
Furthermore, to check the normality of variables the Jarque-Bera test was also applied. The p-values of Jarque-Bera test are less than 0.05, which confirms that the data of all variables are not normally distributed. also reports the data distribution histogram, indicating a clear abnormal distribution. JB test is largely followed by extent literature to confirm non-linearity (Razzaq et al., Citation2021c, Sun et al., Citation2022; Citation2021b).
Figure 1. Distribution histograms of data.
Source: Author’s Estimations.
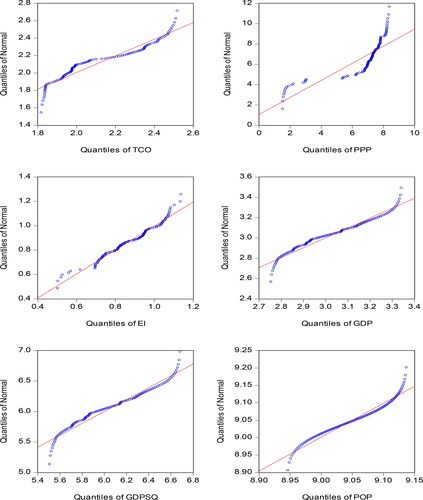
Moreover, visualize that data of all series are significantly distributed across quantile. Thus, to deal with the non-linearity issues, quantile regression is a more appropriate option for empirical analysis which is allowed abnormal distribution of data and provide robust estimate across the grid of diverse quantiles (Anwar et al., Citation2021c; Razzaq et al., Citation2021b; Sun et al., Citation2021).
Figure 2. Quantile distribution of data.
Source: Author’s Estimations.
Before assessing the QARDL model, we applied the augmented Dicky-Fuller (ADF) and Zivot-Andrews (Citation1992) unit root tests, to explore the order of integration of the time series. The results of unit root tests are reported in . The outcomes of ADF and ZA tests confirm that all variables are stationary at I (1) except TCO which is stationary at I(0) in ZA test. The results of ZA test also confirm the structural breaks in data, which primarily belong to the year 2007 (TCO and GDP), 2011 (PPP and EI). Thus, it is derived that all variables are abnormally distributed, have a unit root, and structural breaks, which endorse the application of QARDL model. QARDL framework efficiently deals with dynamic trends, structural breaks, and nonlinearity in time series (Anwar et al., Citation2022; Sun et al., Citation2021).
Table 3. Unit root test.
describes the outcomes of QARDL model. The negative and significant values of error correction terms (ECM) confirm the long-run cointegrating association between model variables. It also exhibits that the reversion towards long-run equilibrium in case of any shock in the short-run across major quantiles. The results demonstrate that PPP negatively influences the TCO across all quantiles but these outcomes are only significant from 30th to 80th quantile. It implies that the emissions-mitigating effect of PPP investment in transport sector is only persisting at medium to higher quantiles, and insignificant at extreme lower and extreme higher emission quantiles. These findings indicate that at lower and highest levels of emission the marginal efficiency of PPP is not enough to produce a significant impact on transport emissions. These findings are similar to Anwar et al. (Citation2021b) for China, who confirmed heterogeneous effects of PPP on emission mitigation. Environmental innovation also decreases TCO mainly at higher quantiles (60th to 95th quantile). Similar results were endorsed by Razzaq et al. (Citation2021a) using top ten GDP countries. Similar to PPP, the emissions-mitigation effect of environmental innovation is only pronounced at medium to higher levels of emissions. These outcomes were echoed by Chen et al. (Citation2020) for China, Khan et al. (Citation2020) for G-7 countries, and Tobelmann and Wendler (Citation2020) for European economies. The positive impact of GDP and negative impact of GDP square (EKC) on TCO support the existence of EKC-hypothesis from 50th to 95th quantiles. The results are similar to the outcomes of Jun et al. (Citation2021), Chien et al. (Citation2021), and Syed et al. (Citation2022). The impact of population on TCO is positive across all the quantiles, but this relation is significant throughout the quantiles except 80th quantiles.
Table 4. Results of quantile autoregressive distributed lag.
While investigating the QARDL short-run estimates, the outcomes revealed that TCO is positively and significantly influenced by its previous transport emissions at all quantiles, whereas the change in previous and current PPP is negatively and significantly influenced the TCO at the upper high (0.09–0.95) quantile only. However, for the rest of the quartiles, the stimulus remains negative but insignificant. These results specify that in short-run the PPP investments only affect the TCO when transport emissions are too high. Similarly, in the short-run the preceding and existing variations in environmental innovations have a statistically significant and negative effect on the TCO at the medium to highest (0.60–0.95) quartiles. Similarly, the per capita income has a positive and significant short-run effect on TCO at the median quartiles.
reports Wald test statistics, which is applied to confirm the asymmetricity of long-run and short-run parameters. The results of Wald test reject the null hypothesis of linearity of the speed of adjustment parameter. The results show the cointegration parameter between TCO and PPP, TCO and EI, TCO and GDP, TCO and GDP2, TCO and POP are dynamic in quantile range which verifies the asymmetry. The long-run results of Wald test reject the null hypothesis of parameter consistency for all regressors. The outcome also confirms the existence of asymmetric combined short-term impression of PPP, EI, and POP on TCO. The Wald test failed to reject the null hypothesis for the effect of GDP and GDP2 on TCO across the grid of quantile in short-term, describing the symmetric combine short-term impression of GDP and GDP2 on TCO. Primarily, all parameters are not constant across the diverse distribution of data, rather it varies from lower to higher quantiles of TCO.
Table 5. Results of the Wald Test for the constancy of parameters.
presents the outcomes of Granger-causality test. The results are presented in the grid of 11 quantiles and null hypothesis shows the absence of causality among the variables. A two-way causality exists between PPP investment in transport to transport CO2 emissions (ΔPPPt to ΔTCOt), implying that PPP not only mitigates TCO but also being instigated by higher transport emissions. The probability values also verify one-way causality from environmental innovation to transport carbon emissions (ΔEIt to ΔTCOt) at a 1% significance level throughout the quantiles. Similarly, for economic growth, the study finds two-way causality between GDP and transport carbon emissions (ΔGDPt to ΔTCOt) across all the quantiles at a 1% level of significance, confirming that transport emissions are caused by/to economic growth. Moreover, a uni-directional causality exists from population to transport carbon emissions.
Table 6. Test results of Granger causality in quantile.
5. Conclusion and policy implications
This study inspects the link between public-private partnership investment in transport and transports CO2 emissions by controlling the effects of environmental innovations, economic growth, and population following the theoretical background of STRIPAT model. For this purpose, we use unit-root test to examine the stationarity of the indicators. After confirming the stationarity of the indicators, we apply Quantile ARDL technique presented by Cho et al. (Citation2015) for estimating the long-run and short-run parameters. The long-run empirical outcomes indicate that PPP reduces transport carbon emission from middle (40th) to highest quantiles (95th) quantiles. Likewise, environmental innovation reduces transport carbon emission from 60th to 95th quantiles. Additionally, the results also confirm the presence of EKC-hypothesis in upper quantiles (60th to 95th), which indicates that economic output reduces transport emissions if reaches a certain level. Lastly, population increases the transport pollution in lower (10th to 40th) and upper (90th to 95th) quantiles. A two-way quantile causality is also observed between public-private partnership (PPP) and transport emissions, and economic growth and transport emissions.
These results imply that the industrial sector needs to switch energy practices towards green and renewable energy sources. This process could be taking place gradually and it may be possible for some businesses might be unable to manage the transformation due to higher capital costs, which can be complement by a PPP investment in transport and other sectors. A robust operational effort is required to build a more mature understanding of PPPs, and even these are more operative tools of state for the establishment of transport infrastructure and related services with a lesser burden on the annual budget and higher efficiency. There is an imperative need to launch a common forum which expands R&D cooperation, improve communication and preparation, boost collaborative initiatives for environmental innovation, streamline individual exchanges, enable the transfer of environmentally friendly technology, and generate a fine functioning network and implement research-oriented ventures and engineering. A strong institutional quality is always needed for the fulfilment of such obligations. Transparent and well-established PPP policies are significant for the establishment of a robust institutional framework for emerging, procuring, and executing infrastructure projects in the PPP framework.
Although the study adopted the most recent econometric techniques to produce this connection, yet it has some convinced limitations as well. For instance, the current outcomes are focused on a small choice of variables with a limited period, and empirical appraisal was steered for only India. While, further research could also explore the effect of PPP investments in transport, economic innovation, and economic growth exploiting the current dataset with different parameter measures. Additionally, the application of the existing framework was constrained to India, further research could include various countries as per their emission level by accounting for the structural breaks in their analysis.
Disclosure statement
No potential conflict of interest was reported by the authors.
Additional information
Funding
References
- Abe, Y., Zodrow, I., Johnson, D. A., & Silerio, L. (2019). Risk informed and resilient development: Engaging the private sector in the era of the Sendai Framework. Progress in Disaster Science, 2, 100020. https://doi.org/10.1016/j.pdisas.2019.100020
- Adedoyin, F. F., Ozturk, I., Agboola, M. O., Agboola, P. O., & Bekun, F. V. (2021). The implications of renewable and non-renewable energy generating in Sub-Saharan Africa: The role of economic policy uncertainties. Energy Policy, 150, 112115. https://doi.org/10.1016/j.enpol.2020.112115
- Albalate, D., Bel Queralt, G., & Geddes, R. R. (2018). Do public-private partnership enabling laws increase private investment in infrastructure [WP]. IREA–Working Papers, 2018, IR18/15.
- Álvarez-Herránz, A., Balsalobre, D., Cantos, J. M., & Shahbaz, M. (2017). Energy innovations-GHG emissions nexus: Fresh empirical evidence from OECD countries. Energy Policy, 101, 90–100. https://doi.org/10.1016/j.enpol.2016.11.030
- Ameyaw, E. E., & Chan, A. P. (2015). Evaluation and ranking of risk factors in public–private partnership water supply projects in developing countries using fuzzy synthetic evaluation approach. Expert Systems with Applications, 42(12), 5102–5116. https://doi.org/10.1016/j.eswa.2015.02.041
- An, H., Razzaq, A., Haseeb, M., & Mihardjo, L. W. (2021). The role of technology innovation and people’s connectivity in testing environmental Kuznets curve and pollution heaven hypotheses across the belt and road host countries: New evidence from method of moments quantile regression. Environmental Science and Pollution Research International, 28(5), 5254–5270.
- Anenberg, S., Miller, J. O. S. H. U. A., Henze, D. A. V. E. N., & Minjares, R. (2019). A global snapshot of the air pollution-related health impacts of transportation sector emissions in 2010 and 2015. International Council on Clean Transportation.
- Anser, M. K., Apergis, N., & Syed, Q. R. (2021). Impact of economic policy uncertainty on CO2 emissions: Evidence from top ten carbon emitter countries. Environmental Science and Pollution Research, 28(23), 29369–29378. https://doi.org/10.1007/s11356-021-12782-4
- Anser, M. K., Apergis, N., Syed, Q. R., & Alola, A. A. (2021a). Exploring a new perspective of sustainable development drive through environmental Phillips curve in the case of the BRICST countries. Environmental Science and Pollution Research International, 28(35), 48112–48122. https://doi.org/10.1007/s11356-021-14056-5
- Anser, M. K., Syed, Q. R., Lean, H. H., Alola, A. A., & Ahmad, M. (2021b). Do economic policy uncertainty and geopolitical risk lead to environmental degradation? Evidence from emerging economies. Sustainability, 13(11), 5866. https://doi.org/10.3390/su13115866
- Anwar, A., & Malik, S. (2021). Cogitating the role of technological innovation and institutional quality on environmental degradation in G-7 countries. International Journal of Green Economics, 15(3), 213. https://doi.org/10.1504/IJGE.2021.10044262
- Anwar, A., Malik, S., & Ahmad, P. (2022). Cogitating the role of technological innovation and institutional quality in formulating the sustainable development goal policies for E7 countries: Evidence from quantile regression. Global Business Review, 097215092110726–097215092110722. https://doi.org/10.1177/09721509211072657
- Anwar, A., Malik, S., Chaudhary, A. R., & Bassim, M. (2021a). Modeling the macroeconomic determinants of carbon dioxide emissions in the G-7 countries: The roles of technological innovation and institutional quality improvement. Global Business Review, 097215092110393. https://doi.org/10.1177/09721509211039392
- Anwar, A., Sharif, A., Fatima, S., Ahmad, P., Sinha, A., Khan, S. A. R., & Jermsittiparsert, K. (2021b). The asymmetric effect of public private partnership investment on transport CO2 emission in China: Evidence from quantile ARDL approach. Journal of Cleaner Production, 288, 125282. https://doi.org/10.1016/j.jclepro.2020.125282
- Anwar, A., Siddique, M., Dogan, E., & Sharif, A. (2021c). The moderating role of renewable and non-renewable energy in environment-income nexus for ASEAN countries: Evidence from method of moments quantile regression. Renewable Energy, 164, 956–967. https://doi.org/10.1016/j.renene.2020.09.128
- Anwar, A., Sinha, A., Sharif, A., Siddique, M., Irshad, S., Anwar, W., & Malik, S. (2021d). The nexus between urbanization, renewable energy consumption, financial development, and CO2 emissions: Evidence from selected Asian countries. Environment, Development and Sustainability, https://doi.org/10.1007/s10668-021-01716-2
- Baloch, M. A., Danish, K., & Yiting, Q. (2021a). Does energy innovation play a role in achieving sustainable development goals in BRICS countries? Environmental Technology, 1–10. https://doi.org/10.1080/09593330.2021.1874542
- Baloch, M. A., Ozturk, I., Bekun, F. V., & Khan, D. (2021b). Modeling the dynamic linkage between financial development, energy innovation, and environmental quality: Does globalization matter? Business Strategy and the Environment, 30(1), 176–184. https://doi.org/10.1002/bse.2615
- Balsalobre-Lorente, D., Shahbaz, M., Jabbour, C. J. C., & Driha, O. M. (2019). The role of energy innovation and corruption in carbon emissions: Evidence based on the EKC hypothesis. In Energy and environmental strategies in the era of globalization (pp. 271–304). Springer.
- Buhmann, K., Jonsson, J., & Fisker, M. (2019). Do no harm and do more good too: Connecting the SDGs with business and human rights and political CSR theory. Corporate Governance: The International Journal of Business in Society, 19(3), 389–403. https://doi.org/10.1108/CG-01-2018-0030
- Cai, Y., Xu, J., Ahmad, P., & Anwar, A. (2021). What drives carbon emissions in the long-run? The role of renewable energy and agriculture in achieving the sustainable development goals. Economic Research-Ekonomska Istraživanja, 1–22. https://doi.org/10.1080/1331677X.2021.2015613
- Casady, C. B., Eriksson, K., Levitt, R. E., & Scott, W. R. (2020). (Re) defining public-private partnerships (PPPs) in the new public governance (NPG) paradigm: an institutional maturity perspective. Public Management Review, 22(2), 161–183. https://doi.org/10.1080/14719037.2019.1577909
- Cf, O. D. D. S. (2015). Transforming our world: the 2030 Agenda for Sustainable Development. New York, NY, USA: United Nations.
- Chan, A. P. C., Lam, P. T. I., Chan, D. W. M., Cheung, E., & Ke, Y. (2009). Privileges and attractions for private sector involvement in PPP projects.
- Chen, F., Zhao, T., & Liao, Z. (2020). The impact of technology-environmental innovation on CO 2 emissions in China’s transportation sector. Environmental Science and Pollution Research, 27(23), 29485–29501. https://doi.org/10.1007/s11356-020-08983-y
- Chien, F., Anwar, A., Hsu, C. C., Sharif, A., Razzaq, A., & Sinha, A. (2021). The role of information and communication technology in encountering environmental degradation: Proposing an SDG framework for the BRICS countries. Technology in Society, 65, 101587. https://doi.org/10.1016/j.techsoc.2021.101587
- Cho, J. S., Kim, T. H., & Shin, Y. (2015). Quantile cointegration in the autoregressive distributed-lag modeling framework. Journal of Econometrics, 188(1), 281–300. https://doi.org/10.1016/j.jeconom.2015.05.003
- Costa, A., & Fernandes, R. (2012). Urban public transport in Europe: Technology diffusion and market organisation. Transportation Research Part A: Policy and Practice, 46(2), 269–284.
- Cruz, I. S., & Katz-Gerro, T. (2016). Urban public transport companies and strategies to promote sustainable consumption practices. Journal of Cleaner Production, 123, 28–33. https://doi.org/10.1016/j.jclepro.2015.12.007
- Danish, Baloch, M. A., & Suad, S. (2018). Modeling the impact of transport energy consumption on CO 2 emission in Pakistan: evidence from ARDL approach. Environmental Science and Pollution Research, 25(10), 9461–9473.
- Fang, Z., Razzaq, A., Mohsin, M., & Irfan, M. (2022). Spatial spillovers and threshold effects of internet development and entrepreneurship on green innovation efficiency in China. Technology in Society, 68, 101844. https://doi.org/10.1016/j.techsoc.2021.101844
- Farooq, A., Anwar, A., Ahad, M., Shabbir, G., & Imran, Z. A. (2021). A validity of environmental Kuznets curve under the role of urbanization, financial development index and foreign direct investment in Pakistan. Journal of Economic and Administrative Sciences, https://doi.org/10.1108/JEAS-10-2021-0219
- Frey, M., & Sabbatino, A. (2018). The role of the private sector in global sustainable development: The UN 2030 Agenda. In Corporate responsibility and digital communities (pp. 187–204). Palgrave Macmillan.
- Fulton, M., & Capalino, R. (2014). Investing in the clean trillion: Closing the clean gnergy investment gap. Report. Ceres, January.
- Ganda, F. (2018). The influence of green energy investments on environmental quality in OECD countries. Environmental Quality Management, 28(2), 17–29. https://doi.org/10.1002/tqem.21595
- Georgatzi, V. V., Stamboulis, Y., & Vetsikas, A. (2020). Examining the determinants of CO2 emissions caused by the transport sector: Empirical evidence from 12 European countries. Economic Analysis and Policy, 65, 11–20. https://doi.org/10.1016/j.eap.2019.11.003
- Granger, C. W. (1969). Investigating causal relations by econometric models and cross-spectral methods. Econometrica: Journal of the Econometric Society, 37(3), 424–438.
- Hacking, T. (2019). The SDGs and the sustainability assessment of private-sector projects: Theoretical conceptualization and comparison with current practice using the case study of the Asian Development Bank. Impact Assessment and Project Appraisal, 37(1), 2–16. https://doi.org/10.1080/14615517.2018.1477469
- Hammami, M., Ruhashyankiko, J. F., & Yehoue, E. B. (2006). Determinants of public-private partnerships in infrastructure.
- International Energy Agency (IEA). (2020). Energy statistics.
- Irfan, M., Razzaq, A., Chupradit, S., Javid, M., Rauf, A., & Farooqi, T. J. A. (2022). Hydrogen production potential from agricultural biomass in Punjab province of Pakistan. International Journal of Hydrogen Energy, 47(5), 2846–2861. https://doi.org/10.1016/j.ijhydene.2021.10.257
- Jahanger, A., Usman, M., & Balsalobre-Lorente, D. (2021). Autocracy, democracy, globalization, and environmental pollution in developing world: fresh evidence from STIRPAT model. Journal of Public Affairs, e2753. https://doi.org/10.1002/pa.2753
- Jamasb, T., Thakur, T., & Bag, B. (2018). Smart electricity distribution networks, business models, and application for developing countries. Energy Policy, 114, 22–29. https://doi.org/10.1016/j.enpol.2017.11.068
- Johansen, S. (1988). Statistical Analysis of Cointegration Vectors. Journal of Economic Dynamics and Control, 12(2-3), 231–254. https://doi.org/10.1016/0165-1889(88)90041-3
- Jun, W., Mughal, N., Zhao, J., Shabbir, M. S., Niedbała, G., Jain, V., & Anwar, A. (2021). Does globalization matter for environmental degradation? Nexus among energy consumption, economic growth, and carbon dioxide emission. Energy Policy, 153, 112230.
- Khan, Z., Ali, S., Umar, M., Kirikkaleli, D., & Jiao, Z. (2020). Consumption-based carbon emissions and international trade in G7 countries: the role of environmental innovation and renewable energy. Science of the Total Environment, 730, 138945. https://doi.org/10.1016/j.scitotenv.2020.138945
- Kim, T. H., & White, H. (2003). Estimation, inference, and specification testing for possibly misspecified quantile regression. Advances in Econometrics, 17, 107–132.
- Lah, O. (2015). The barriers to low-carbon land-transport and policies to overcome them. European Transport Research Review, 7(1), 1–11. https://doi.org/10.1007/s12544-014-0151-3
- Leibenstein, H. (1966). Allocative efficiency vs. X-efficiency. The American Economic Review, 56(3), 392–415.
- Li, W., Li, H., Zhang, H., & Sun, S. (2016). The analysis of CO2 emissions and reduction potential in China's transport sector. Mathematical Problems in Engineering, 2016, 1–12.
- Liang, Y., Niu, D., Wang, H., & Li, Y. (2017). Factors affecting transportation sector CO2 emissions growth in China: An LMDI decomposition analysis. Sustainability, 9(10), 1730. https://doi.org/10.3390/su9101730
- Lin, B., & Omoju, O. E. (2017). Does private investment in the transport sector mitigate the environmental impact of urbanisation? Evidence from Asia. Journal of Cleaner Production, 153, 331–341. https://doi.org/10.1016/j.jclepro.2017.01.064
- Lin, B., & Xie, C. (2014). Reduction potential of CO2 emissions in China’ s transport industry. Renewable and Sustainable Energy Reviews, 33, 689–700. https://doi.org/10.1016/j.rser.2014.02.017
- Los Ríos-Carmenado, D., Ortuño, M., & Rivera, M. (2016). Private–public partnership as a tool to promote entrepreneurship for sustainable development: WWP torrearte experience. Sustainability, 8(3), 199. https://doi.org/10.3390/su8030199
- Marx, A. (2019). Public–private partnerships for sustainable development: Exploring their design and its impact on effectiveness. Sustainability, 11(4), 1087–1089. https://doi.org/10.3390/su11041087
- McCollum, D., Nagai, Y., Riahi, K., Marangoni, G., Calvin, K., Pietzcker, R., van Vliet, J., & van der Zwaan, B. (2013). Energy investments under climate policy: A comparison of global models. Climate Change Economics, 4(4), 1340010–1340032. https://doi.org/10.1142/S2010007813400101
- Medda, F. R., Carbonaro, G., & Davis, S. L. (2013). Public private partnerships in transportation: Some insights from the European experience. IATSS Research, 36(2), 83–87. https://doi.org/10.1016/j.iatssr.2012.11.002
- Mohsin, M., Abbas, Q., Zhang, J., Ikram, M., & Iqbal, N. (2019). Integrated effect of energy consumption, economic development, and population growth on CO 2 based environmental degradation: a case of transport sector. Environmental Science and Pollution Research, 26(32), 32824–32835. https://doi.org/10.1007/s11356-019-06372-8
- OECD. (2020). Organization of Economic Cooperation and Development, Statistical Database. https://stats.oecd.org/
- Pedersen, J. S., & Lofgren, K. (2012). Public sector reforms: New public management without marketization? The Danish case. International Journal of Public Administration, 35(7), 435–447. https://doi.org/10.1080/01900692.2012.679579
- Raju, S. S. (2011). A successful Indian model. The Hindu Survey of Indian Industry 2011.
- Razzaq, A., Ajaz, T., Li, J. C., Irfan, M., & Suksatan, W. (2021a). Investigating the asymmetric linkages between infrastructure development, green innovation, and consumption-based material footprint: Novel empirical estimations from highly resource-consuming economies. Resources Policy, 74, 102302. https://doi.org/10.1016/j.resourpol.2021.102302
- Razzaq, A., Sharif, A., Ahmad, P., & Jermsittiparsert, K. (2021b). Asymmetric role of tourism development and technology innovation on carbon dioxide emission reduction in the Chinese economy: Fresh insights from QARDL approach. Sustainable Development, 29(1), 176–193. https://doi.org/10.1002/sd.2139
- Razzaq, A., Wang, Y., Chupradit, S., Suksatan, W., & Shahzad, F. (2021c). Asymmetric inter-linkages between green technology innovation and consumption-based carbon emissions in BRICS countries using quantile-on-quantile framework. Technology in Society, 66, 101656. https://doi.org/10.1016/j.techsoc.2021.101656
- Saboori, B., Sapri, M., & bin Baba, M. (2014). Economic growth, energy consumption and CO2 emissions in OECD (Organization for Economic Co-operation and Development)'s transport sector: A fully modified bi-directional relationship approach. Energy, 66, 150–161. https://doi.org/10.1016/j.energy.2013.12.048
- Saighani, A., & Sommer, C. (2017). Potentials for reducing carbon dioxide emissions and conversion of renewable energy for the regional transport market-a case study. Transportation Research Procedia, 25, 3479–3494. https://doi.org/10.1016/j.trpro.2017.05.259
- Salem, S., Arshed, N., Anwar, A., Iqbal, M., & Sattar, N. (2021). Renewable energy consumption and carbon emissions—Testing nonlinearity for highly carbon emitting countries. Sustainability, 13(21), 11930. https://doi.org/10.3390/su132111930
- Shahbaz, M., Khraief, N., & Jemaa, M. M. B. (2015). On the causal nexus of road transport CO2 emissions and macroeconomic variables in Tunisia: Evidence from combined cointegration tests. Renewable and Sustainable Energy Reviews, 51, 89–100. https://doi.org/10.1016/j.rser.2015.06.014
- Shahbaz, M., Nasir, M. A., & Roubaud, D. (2018). Environmental degradation in France: The effects of FDI, financial development, and energy innovations. Energy Economics, 74, 843–857. https://doi.org/10.1016/j.eneco.2018.07.020
- Shahbaz, M., Raghutla, C., Song, M., Zameer, H., & Jiao, Z. (2020). Public-private partnerships investment in energy as new determinant of CO2 emissions: The role of technological innovations in China. Energy Economics, 86, 104664. https://doi.org/10.1016/j.eneco.2020.104664
- Shahbaz, M., Shafiullah, M., Papavassiliou, V. G., & Hammoudeh, S. (2017). The CO2–growth nexus revisited: A nonparametric analysis for the G7 economies over nearly two centuries. Energy Economics, 65, 183–193. https://doi.org/10.1016/j.eneco.2017.05.007
- Shen, M., & Chi, X. (2012). Analysis on the Driving Factors of the Growth of Carbon Emissions in China's Transportation Sector. Jianghuai Trib, 31–38.
- Sun, Y., Anwar, A., Razzaq, A., Liang, X., & Siddique, M. (2022). Asymmetric role of renewable energy, green innovation, and globalization in deriving environmental sustainability: Evidence from top-10 polluted countries. Renewable Energy., 185, 280–290. https://doi.org/10.1016/j.renene.2021.12.038
- Sun, Y., Duru, O. A., Razzaq, A., & Dinca, M. S. (2021). The asymmetric effect eco-innovation and tourism towards carbon neutrality target in Turkey. Journal of Environmental Management, 299, 113653. https://doi.org/10.1016/j.jenvman.2021.113653
- Syed, Q. R., Bhowmik, R., Adedoyin, F. F., Alola, A. A., & Khalid, N. (2022). Do economic policy uncertainty and geopolitical risk surge CO2 emissions? New insights from panel quantile regression approach. Environmental Science and Pollution Research, 1–17. https://doi.org/10.1007/s11356-021-17707-9
- Syed, Q. R., & Bouri, E. (2021). Impact of economic policy uncertainty on CO2 emissions in the US: Evidence from bootstrap ARDL approach. Journal of Public Affairs, e2595. https://doi.org/10.1002/pa.2595
- Talbi, B. (2017). CO2 emissions reduction in road transport sector in Tunisia. Renewable and Sustainable Energy Reviews, 69, 232–238. https://doi.org/10.1016/j.rser.2016.11.208
- Tang, L., Shen, Q., Skitmore, M., & Cheng, E. W. (2013). Ranked critical factors in PPP briefings. Journal of Management in Engineering, 29(2), 164–171. https://doi.org/10.1061/(ASCE)ME.1943-5479.0000131
- Timilsina, G. R., & Shrestha, A. (2009). Transport sector CO2 emissions growth in Asia: Underlying factors and policy options. Energy Policy, 37(11), 4523–4539. https://doi.org/10.1016/j.enpol.2009.06.009
- Tobelmann, D., & Wendler, T. (2020). The impact of environmental innovation on carbon dioxide emissions. Journal of Cleaner Production, 244, 118787. https://doi.org/10.1016/j.jclepro.2019.118787
- Topple, C., Donovan, J. D., Masli, E. K., & Borgert, T. (2017). Corporate sustainability assessments: MNE engagement with sustainable development and the SDGs. Transnational Corporations, 24(3), 61–71. https://doi.org/10.18356/2ae5911c-en
- Troster, V. (2018). Testing for Granger-causality in quantiles. Econometric Reviews, 37(8), 850–866.
- Ullah, S., Ozturk, I., Majeed, M. T., & Ahmad, W. (2021). Do technological innovations have symmetric or asymmetric effects on environmental quality? Evidence from Pakistan. Journal of Cleaner Production, 316, 128239. https://doi.org/10.1016/j.jclepro.2021.128239
- Usman, M., Jahanger, A., Makhdum, M. S. A., Balsalobre-Lorente, D., & Bashir, A. (2021a). How do financial development, energy consumption, natural resources, and globalization affect Arctic countries' economic growth and environmental quality? An advanced panel data simulation. Energy, 241, 122515. https://doi.org/10.1016/j.energy.2021.122515
- Usman, M., Khalid, K., & Mehdi, M. A. (2021b). What determines environmental deficit in Asia? Embossing the role of renewable and non-renewable energy utilization. Renewable Energy., 168, 1165–1176. https://doi.org/10.1016/j.renene.2021.01.012
- Usman, A., Ozturk, I., Ullah, S., & Hassan, A. (2021c). Does ICT have symmetric or asymmetric effects on CO2 emissions? Evidence from selected Asian economies. Technology in Society, 67, 101692. https://doi.org/10.1016/j.techsoc.2021.101692
- Wang, W. W., Zhang, M., & Zhou, M. (2011). Using LMDI method to analyze transport sector CO2 emissions in China. Energy, 36(10), 5909–5915. https://doi.org/10.1016/j.energy.2011.08.031
- Waqih, M. A. U., Bhutto, N. A., Ghumro, N. H., Kumar, S., & Salam, M. A. (2019). Rising environmental degradation and impact of foreign direct investment: An empirical evidence from SAARC region. Journal of Environmental Management, 243, 472–480. https://doi.org/10.1016/j.jenvman.2019.05.001
- World Bank. (2020). World development indicators (WDI). Online Database, World Bank.
- World Bank Institute. (2017). PPP reference guide - Version 3., World Bank.
- World Health Organization (WHO). (2006). Occupational and Environmental Health Team. WHO air quality guidelines for particulate matter, ozone, nitrogen dioxide and sulfur dioxide: Global update 2005: Summary of risk assessment. World Health Organization.
- Xiao, Z. (2009). Quantile cointegrating regression. Journal of Econometrics, 150(2), 248–260. https://doi.org/10.1016/j.jeconom.2008.12.005
- Xin-Gang, Z., Gui-Wu, J., Ang, L., & Yun, L. (2016). Technology, cost, a performance of waste-to-energy incineration industry in China. Renewable and Sustainable Energy Reviews, 55, 115–130. https://doi.org/10.1016/j.rser.2015.10.137
- Xu, Y., Chan, A. P., Xia, B., Qian, Q. K., Liu, Y., & Peng, Y. (2015). Critical risk factors affecting the implementation of PPP waste-to-energy projects in China. Applied Energy, 158, 403–411. https://doi.org/10.1016/j.apenergy.2015.08.043
- Xue, Y., Guan, H., Corey, J., Zhang, B., Yan, H., Han, Y., & Qin, H. (2017). Transport emissions and energy consumption impacts of private capital investment in public transport. Sustainability, 9(10), 1760. https://doi.org/10.3390/su9101760
- Xu, B., & Lin, B. (2016). Differences in regional emissions in China's transport sector: determinants and reduction strategies. Energy, 95, 459–470. https://doi.org/10.1016/j.energy.2015.12.016
- Xu, B., & Lin, B. (2018). Investigating the differences in CO2 emissions in the transport sector across Chinese provinces: Evidence from a quantile regression model. Journal of Cleaner Production, 175, 109–122. https://doi.org/10.1016/j.jclepro.2017.12.022
- Yang, B., Jahanger, A., Usman, M., & Khan, M. A. (2021). The dynamic linkage between globalization, financial development, energy utilization, and environmental sustainability in GCC countries. Environmental Science and Pollution Research International, 28(13), 16568–16588.
- Zhang, H., Razzaq, A., Pelit, I., & Irmak, E. (2021). Does freight and passenger transportation industries are sustainable in BRICS countries? Evidence from advance panel estimations. Economic Research-Ekonomska Istraživanja, 1–21. https://doi.org/10.1080/1331677X.2021.2002708
- Zhang, S., Chan, A. P., Feng, Y., Duan, H., & Ke, Y. (2016). Critical review on PPP research–A search from the Chinese and International Journals. International Journal of Project Management, 34(4), 597–612. https://doi.org/10.1016/j.ijproman.2016.02.008
- Zhuang, Y., Yang, S., Razzaq, A., & Khan, Z. (2021). Environmental impact of infrastructure-led Chinese outward FDI, tourism development and technology innovation: a regional country analysis. Journal of Environmental Planning and Management, 1–33. https://doi.org/10.1080/09640568.2021.1989672
- Zivot, E., & Andrews, D. W. K. (1992). Further evidence on the great crash, the oil-price shock, and the unit-root hypothesis. Journal of Business & Economic Statistics, 10(3), 251–270.