
 ?Mathematical formulae have been encoded as MathML and are displayed in this HTML version using MathJax in order to improve their display. Uncheck the box to turn MathJax off. This feature requires Javascript. Click on a formula to zoom.
Abstract
Due to the growing importance of the sports economy and the severe impact of the current Covid-19 pandemic on it, this paper examines the way in which the infectious disease stock market volatility (ID-EMV) tracker affects the Covid world sports economy from an asymmetrical perspective. We selected the newspaper-based ID-EMV index and Wind Physical Education Concept Index (PEC) for our research. First, the results of conventional causality tests showed that the tests ID-EMV and PEC were unable to detect causality, implying that stock market volatility stemming from COVID-19 risk had no impact on the sports economy. However, considering potential asymmetric effects in this relationship, we further investigated whether ID-EMV could significantly affect PEC under both positive and negative shocks. The empirical results confirm the existence of asymmetric effects. Therefore, we are the first to focus on this asymmetric effect and conduct empirical research, which may help provide educators and financial market participants with a novel research perspective.
1. Introduction
With the continuous advance of the economy, people have become more and more aware of the sports’ great economic function and values. Generally speaking, with the prevalence of mass sports and professional sports, the physical education industry developed in the 1960s and became a new industry (Savić et al., Citation2018). In developed countries, the development of the physical education industry has been relatively mature. For example, the physical education industry in the U.S. reached US$152 billion in 1995 (Meek, Citation1997). Meanwhile, the physical education industry in some developing countries has also developed rapidly, such as China and Iran (Ji et al., Citation2021; Naqvi et al., Citation2021; Wang et al., Citation2019). The development of the physical education industry has led to rapid economic growth and increased its proportion in the gross national product. As a result, the physical education economy has received more attention. However, the sudden outbreak of the Covid-19 epidemic not only poses a fatal threat to personal health but also has a great impact on the world economy (Liang et al., Citation2020b, Citation2021b; Mirza et al., Citation2020b; Rizvi et al., Citation2020a; Yarovaya et al., Citation2021). As an important part of the social economy, the physical education economy has also suffered a huge impact (Zhang et al., Citation2019a). Therefore, evaluating sports economic losses and proposing corresponding countermeasures are important topics in the development of the sports economy for a long time to come, especially in this Coivd-19 world, which may be also helpful for the sustainable financial systems (Li et al., Citation2021; Umar et al., Citation2021d, Citation2021e).
Although attention had been paid to the Covid’ impact on the physical education economy, the research gap still exists. First, most of the present works discuss this direct influence of Covid-19 on some specific sports industries, such as professional E-sports, soccer, and basketball (Kim et al., Citation2020; Mirza et al., Citation2020a; Yarovaya et al., Citation2020a). For instance, Drewes et al. (Citation2021) pointed out that the main impact of the Covid-19 on professional soccer sports, and discussed the solution from an economic perspective on the basis of the characteristics of the team sports (generality and particularity). Moritz et al. (Citation2021) examined how indoor sports are affected by the Covid-19 with conducting a simulated experiment and thus evaluating the influence generated by the Covid-19 on sports economic. However, due to the close relationship between sports and individual sentimentFootnote1 (Edmans et al., Citation2007), the physical education economy may be more easily and straightly affected by the equity market volatility, especially during the Covid-19 outbreak, which has been overlooked by the present studies (Lobato et al., Citation2021; Umar et al., Citation2021a, Citation2021b). Second, there is no study discussing the direction of the risk transmission running from the equity market volatility came from Covid-19 to the physical education industry economy. Third, on the basis of the above-mentioned content, the asymmetric effect of this kind of influence has also not been noticed. Hence, our contribution is to complement these study areas from the analysis of the asymmetric causality running from the impact of the Covid-19 crisis on equity markets to the physical education economy.
Specifically, motivated by Mirza et al. (Citation2020c), Rizvi et al. (Citation2020b), Yarovaya et al. (Citation2020b), we consider the risk transmission running from the equity market volatility to the physical education economy in the Covid world. For the representation of the physical education economy, we choose the PEC index, covering the sample period from December 12, 2019, to December 2021. The sampling starting date is in line with Gharib et al. (Citation2021) and the ending date is determined by the data availability. This index is a global index that can describe the development of the worldwide physical education economy. More importantly, we apply the newspaper-based ID-EMV index to capture the effect of this Covid-19 risk on the equity market volatility (Baker et al., Citation2020). And thus, we can use both time series to conduct our study. According to our records, this is the first study that explores the way the ID-EMV affects the stock market related to physical education economy.
Besides, we aim to investigate the risk transmission by applying a widely-used testing method, namely, Granger-causality test (Granger, Citation1969). This contribution contains twofold. The first is that we examine the average Granger causalityFootnote2 running from the ID-EMV to the PEC, and thus we can discuss whether the equity market risk originated from Covid-19 would transmit to PEC. The conventional Granger causality test, as an important tool that can examine the impact of one sequence on another one, can also be used to detect the predictive power of ID-EMV for the PEC (Granger, Citation1969, Citation1980; Sims, Citation1972). As the same as other studies, this work may be helpful for us to understand the influencing machine between ID-EMV and PEC in the first pass (Dutta, Citation2001; Freeman, Citation1983; Wang et al., Citation2021). Interestingly, our empirical result shows that ID-EMV seems to have no statistically significant effect on PEC, which encourages us to further conduct our work in the asymmetric case.
Next, our rest of contribution is that we further explore whether this effect exists in the asymmetric framework by using the wide-used asymmetric Granger causality test (Alper & Oguz, Citation2016; Bahmani-Oskooee et al., Citation2016; Tiwari, Citation2014). According to Hatemi-j (Citation2012a), the sample data can be decomposed into negative and positive shocks, respectively. Detecting the causality between these paired shocks can describe all aspects of the interaction running from ID-EMV to PEC. That is, we can investigate a more detailed way ID-EMV affects the PEC. Our finding displays that there is an asymmetric effect of ID-EMV on PEC. In particular, the negative and positive shocks of ID-EMV will have an impact on PEC, which cannot be found by the conventional Granger test. Thus, it fully confirms the necessity of our research. Economically, our work may be a shift of profound importance for market participants, scholars, and sporters.
The rest of this paper is arranged as follows. Section 2 introduces the economic framework we applied in this paper. Section 3 displays the sample data. The empirical results are in Section 4. Finally, Section 5 concludes.
2. Methodology
2.1. Granger (1969): average granger causality test
Granger (Citation1969) is the first one introduce the Granger-causality concept in economic framework. Sims (Citation1972) subsequently proposes a method, which can detect the causal relationship among time series in the light of a lagged structure. The conventional Granger causality test has been extended and applied in lots of research areas (Diks & Panchenko, Citation2006; Hatemi-j, Citation2012a; Hoffmann et al., Citation2005; Wang et al., Citation2020, Wang & Wang, Citation2021). Although the term Granger causality is used as a synonym for causality in this paper, it is well-known that Granger causality has an extremely specific interpretation of causality, namely, whether one variable improves the forecasting performance of another variable. Specifically, the fact that the past values of X can significantly provide information of Y indicates that X can Granger-causes Y, namely X→Y. Similarly, the fact that the past values of Y can significantly offer beneficial information of X means that variable Y can Granger-causes X, namely Y→X. Except for the above unidirectional causality, bidirectional causality between X and Y can be defined when the relationship X→Y and Y→X exist at the same time. According to Sims (Citation1972), we can use F-test or χ2-test to analyze the existence of Granger causality between two variables.
For instance, the null hypothesis of can be tested by the followings. Firstly, assume that
(1)
(1)
where
and
are stationary (
is the constant,
is the
lagged values of the
and
is that of
Then, the null hypothesis is equal to
for
Thus, if the null hypothesis be rejected, there is a unidirectional causality Y→X. The contrary direction can also be tested in the same way.
2.2. Hatemi-j (2012) test
Generally, scholars focus on exploring the overall relationship between time series. However, there may be an asymmetric structure regarding these relationships, which cannot be detected through analyzing the overall data but their components. The idea of exploring the relationship between pair-wise internal components (shocks) comes from Granger and Yoon (Citation2002), who divided the variables into the positive and negative shocks for examining the hidden cointegration. Granger and Yoon (Citation2002) mainly considered the stochastic trends since they found that modeling the time series with the deterministic trend would lead to spurious cointegration. Thus, on this basis, Hatemi-j (Citation2012a) proposed to detect the causality between pair-wise shocks and defined this method as the asymmetric causality test. Subsequently, a large number of scholars applied and extended this method to test the asymmetric effect.
In this paper, although the conventional causality test can examine the average causal linkage between ID-EMV and PEC, it overlooks the asymmetric structure of information (Granger, Citation1969, Citation1980). Thus, in order to test the asymmetric effect that the different causality may exist in positive and negative shocks, we decide to employ the method of Hatemi-j (Citation2012a). Specifically, ID-EMV (represented by ) and PEC (represented by
) are assumed to be integrated variables. Hence, they can be expressed as follows:
(2)
(2)
(3)
(3)
where
and
denotes their initial values.
and
Inspired by Granger and Yoon (Citation2002), positive and negative shocksFootnote3 can be defined:
(4)
(4)
(5)
(5)
Thus, and
Then, it implies that
Thus, positive and negative shocksFootnote4 are displayed by
and
Finally, causality between pairwise shocks can be tested. Hence, various degree of fluctuations for
and
may contain different important information, which can be captured in more detail by different shocks. Then, the impact of ID-EMV shocks on PEC shocks can be grouped into four different combinations: the impact of
on
and the impact of
on
Further, the causal relationships between these pair-wise shocks can be examinedFootnote5.
For instance, we begin our research by testing the null hypothesis of noncausality from to
According to Kilian and Park (Citation2009), the null hypothesis can be examined by the p-order VAR model:
(8)
(8)
If does not Granger-causeFootnote6
then
The optimal lag order p can be chosen by the HJC criterion (Hatemi-j, Citation2003), defined as follows:
(9)
(9)
The Wald test is used as follows:
(10)
(10)
Moreover, considering non-normal characteristics for financial returns, the traditional Wald statistics may not follow the pre-specified distribution. To solve this issue, bootstrap simulation technique is introduced to obtain the modified Wald test and the related critical value Therefore, we can use
to check the significance of Wald statistics. More details can be found in Hatemi-j (Citation2012a).
Hence, we rely exclusively on the conventional and asymmetric Granger causality tests to conduct our study in this paper.
3. Data
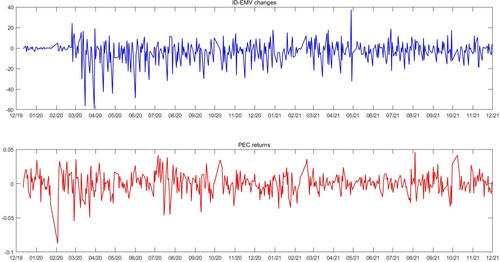
The existing research applies the PEC index and the ID-EMV trackerFootnote7, in the form of daily frequency, covering from December 12, 2019 to November 30, 2021. We use daily data because the ID-EMV index is only available on daily frequenciesFootnote8. This index is constructed by daily counts of newspaper articles across approximately 3,000 US Newspapers, which are related to economic, stock, volatility, and infectious disease respectivelyFootnote9. According to Hatemi-j (Citation2012a), we take differences for the ID-EMV index and thus we can present the ID-EMV shocks by their changes. PEC prices by log returns:
shows the descriptive statistics of our sample data. We provide the standard sample statistics about them, including the maximum (Max.), minimum (Min.), mean and so on. We also list the statistics about the J-B, ADF and KPSS. J-B is for testing the normality. ADF is for the null hypothesis of nonstationary and KPSS for stationary. Obviously, original ID-EMV data and PEC prices are right-skewed while ID-EMV changes and PEC returns are left-skewed. According to positive kurtosis, all series have heavier tails than the normal distribution, except prices. J-B indicates that all of them are not of normal distribution at the significance level of 1%, while ADF and KPSS show that only the ID-EMV changes and PEC returns are stationary.
Table 1. Descriptive statistics.
shows the ID-EMV tracker and the PEC index during the COVID-19 outbreak. In particular, we can observe that both series present dramatically abnormal fluctuating patterns at the beginning of the COVID period. displays the historical changes of ID-EMV and PEC returns. It can be seen that ID-EMV changes have slight and latent fluctuations only at the beginning of the period of Covid while the PEC returns show great volatility during the whole period.
Figure 1. The ID-EMV tracker and the PEC index during the COVID-19 outbreak.
Source: Authors.
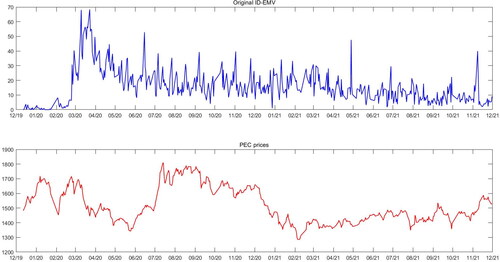
Figure 2. Historical changes of stationary series: for ID-EMV and PEC.
Source: Authors.
4. Empirical results
4.1. Average granger causality from ID-EMV to Pec
First, we use the conventional Granger causality test to examine the average Granger causality running from ID-EMV to PEC. Following Hatemi-j (Citation2012a) and Wang et al. (Citation2020), we assume that there is a causal relationship if the test values are over the 5% CV. In panel A of , the statistical value shows that the null hypothesis of Granger non-causality running from ID-EMV to PEC returns can only be rejected at a 10% significant level. Thus, we can barely observe the causality running from ID-EMV from PEC, implying that the ID-EMV may have no impact on PEC returns during the Covid-19 outbreak. This case seems to be interesting. Although a large amount of literature has found evidence of the impact of the Covid crisis on the physical education economy (Sayyd et al., Citation2021; Wong et al., Citation2020), the traditional causality test cannot provide strong evidence to support this conclusion. A reasonable explanation is that the Covid crisis can directly affect physical education while its impact on the equity market may not transmit to the physical education economy on average. However, does this conclusion really exist? Does this relationship exist in an asymmetrical framework? Hence, this work needs to be further considered.
Table 3. The results of Granger (Citation1969) and Hatemi-j (2012a) causality tests.
4.2. Asymmetric effects of ID-EMV shocks to Pec shocks
On the basis of the above-mentioned discussion, we conduct our further study by applying the Hatemi-j asymmetric Granger causality test (Hatemi-j, Citation2012a). In line with a large number of studies, we divide the ID-EMV changes and PEC returns into negative and positive shocks, respectively (Al-Shayeb & Hatemi-J, Citation2016; Destek, Citation2016; Faisal et al., Citation2018; Hatemi-J, Citation2012b). Before detecting the causality running from ID-EMV shocks to PEC shocks, we test the multiple multivariate diagnostic tests for the shocks of ID-EMV changes and PEC returns. We can see from , all residuals generating from VAR show non-normal, implying the necessary of applying the bootstrap method. Then, we can further examine the causality from any pairwise shocks to explore the detailed and integrated relationship between ID-EMV and PECFootnote10.
Table 2. Multivariate normality and ARCH effects.
Panel B of displays our empirical results. On the one hand, the statistical value shows that the negative ID-EMV shocks cannot provide useful information to forecast negative PEC shocks, under each significant level. However, our results find that the null hypothesis of Granger non-causality running from to
is significantly rejected at the 5% significant level. Thus, for predicting the positive PEC shocks, these negative ID-EMV shocks seem to play an important role. A plausible economic explanation is that when the Covid-19 pandemic was brought under control, the extreme uncertainty and instability previously seen in financial markets were stabilized, thus promoting the recovery of the sports economy (Mirza et al., Citation2020b; Rizvi et al., Citation2020b). This finding greatly differs from the results of the conventional average causality test, highlighting that the necessity of our work. On the other hand, the positive ID-EMV shocks also should be paid attention to in the research related to exploring the relationship between ID-EMV and PEC. Specifically, the null hypothesis of the positive ID-EMV shocks cannot Granger-cause negative PEC shocks cannot be rejected while the positive ID-EMV shocks have an impact on the positive PEC shocks at the 5% significant level.
4.3. Discussion about this asymmetry
First, our paper finds an inapparent causality running from ID-EMV to PEC by applying the conventional Granger causality test, implying that the risk of the equity market volatility originating from the Covid-19 could not transmit to the stock market related to the physical education economy. However, the following results find a significant asymmetric effect of ID-EMV on PEC returns. In particular, the occurrence of positive PEC shocks is more prevalent in the Covid period. Negative or positive ID-EMV shocks are equally important, not all shocks from ID-EMV will Granger-cause changes in PEC returns. In a word, more attention should be paid to this asymmetric effect. In fact, these changes depend on the type of shock. Different impacts of ID-EMV may have significant differences on PEC.
The sports economy is known to be influenced by individuals, policies, social circumstances, and financial market conditions. Therefore, some major events in history may affect the sports market by affecting the financial market. With the outbreak of Covid-19, the volatility of financial markets, especially stock markets, will fluctuate with economic and social conditions (Liang et al., Citation2021a; Wang & Wang, Citation2021). Both of these conditions affect the behavior of companies, individuals and countries, and thus their decision-making (Dorfleitner & Grebler, Citation2022; Ferrat et al., Citation2022; Umar et al., Citation2021c). As a result, increasing and decreasing uncertainty in the stock market during Covid-19 could lead to a sharp rise in PEC returns. First, this rise can be explained by a “safe haven” role. The sports economy appears to be a nascent industry and thus may only be affected by short-term or insignificant fluctuations in the stock market compared to other financial markets such as stocks, crude oil, and gold (Dutta et al., Citation2021; Li et al., Citation2020; Sikiru & Salisu, Citation2021). Furthermore, with globalization and integration, the sports economy may become increasingly vulnerable to market volatility. Therefore, the slowdown in stock market volatility will boost the development of sports.
5. Conclusion
As one of the most important social economies, the sports economy plays a unique and key role in daily activities and economy. With the establishment of the sports market, the degree of financialization and capitalization of sports continues to increase, and equity market risks are transmitted to the sports market, which may affect the normal operation of the sports economy, thereby affecting people's livelihood. With the outbreak of the new crown epidemic, various economic industries around the world have suffered varying degrees of impact, including the sports economy. However, research on how stock market turmoil affects the sports economy is still very limited. Therefore, this study investigated the asymmetric causality between stock market volatility and sports economic returns from December 12, 2019, to December 2021. We chose the ID-EMV index to capture the stock market volatility affected by the new crown epidemic and chose PEC, a global sports concept indicator. Then, we conducted our research by using Hatemi-J’s method to test the causality between each ID-EMV shock and PEC shock. In addition, we still use the traditional causality test to test the average relationship between them.
First, we find that ID-EMV cannot affect PEC by using the traditional Granger causality test. However, by using the asymmetric Granger causality test, our empirical results show that there is a significant asymmetric causality between the uncertainty of the stock market and the sports economy market, which shows that both negative and positive ID-EMV shocks are the main driving factor for positive PEC shocks. Therefore, during this sudden COVID-19 epidemic, the impact of stock market risks on the PEC market is positive. This phenomenon can be explained by the multiple roles that PEC plays in society and the market economy.
In summary, our results provide empirical evidence that stock market volatility can affect the PEC market asymmetrically. This asymmetry indicates that the impact of EMV shocks on oil shocks varies with the uncertainty of the stock market. Generally, investors tend to focus on negative shocks rather than positive shocks, so they have different attitudes towards investment decisions when faced with shocks. Therefore, when analyzing and predicting PEC returns, the asymmetric effects derived from stock market risks may provide market participants with more useful information, especially during periods of extreme events (Covid-19). Finally, it should be worth noting that we will study the changes of this asymmetric causality over different time horizons in our future research.
Disclosure statement
No potential conflict of interest was reported by the authors.
Notes
1 Equity market volatility is verified to be easily and significantly affected by investor sentiment (Dutta et al., Citation2021; Liang et al., Citation2020a; Zhang et al., Citation2019b; Zhu et al., Citation2019).
2 For simplicity of expression, all causal relationships referred to in this paper are Granger causality. If a variable (Y) can Granger-cause another variable (X), it means that this variable (Y) contains predictive information that can be used for that other variable (X).
3 Specifically, positive ID-EMV shocks () can be interpreted by sharply increased ID-EMV, negative ID-EMV shocks (
) are drastically reduced ID-EMV. Positive/negative PEC shocks (
) represent higher/lower fluctuations in physical education economy than that in normal.
4 It is worth noting that different shocks can potentially influence other variables.
5 Some previous research has reported that the asymmetric effect of EMV shocks, such as Alqahtani et al. (Citation2020); Dutta et al. (Citation2021).
6 If the historical information of is conducive to improving the prediction of the current and future of
is said to Granger-cause
8 First of all, this study employs daily-based data for analysis while the existing EMV indices are monthly-based except ID-EMV. Secondly, according to our survey, only the EMV index is related to the Covid-19 epidemic. In summary, the other EMV data seem to be unsuitable for robustness analysis. See the EPU website for more details: http://www.policyuncertainty.com/EMV_monthly.html.
9 For more information about constructing this index, see Baker et al. (Citation2020).
10 We only focus on detecting and displaying the causality from ID-EMV to PEC. Meanwhile, for better demonstrate the completeness of the research, the conventional and asymmetric Granger causality from the PEC to the ID-EMV can also be analyzed. However, due to space limitations, the analysis results will not be shown in the paper and can be provided upon request.
References
- Alper, A., & Oguz, O. (2016). The role of renewable energy consumption in economic growth: Evidence from asymmetric causality. Renewable and Sustainable Energy Reviews, 60, 953–959. https://doi.org/10.1016/j.rser.2016.01.123
- Alqahtani, A., Wither, M. J., Dong, Z., & Goodwin, K. R. (2020). Impact of news-based equity market volatility on international stock markets. Journal of Applied Economics, 23(1), 224–234. https://doi.org/10.1080/15140326.2020.1729571
- Al-Shayeb, A., & Hatemi-J, A. (2016). Trade openness and economic development in the UAE: An asymmetric approach. Journal of Economic Studies, 43(4), 587–597. https://doi.org/10.1108/JES-06-2015-0094
- Bahmani-Oskooee, M., Chang, T., & Ranjbar, O. (2016). Asymmetric causality using frequency domain and time-frequency domain (wavelet) approaches. Economic Modelling, 56, 66–78. https://doi.org/10.1016/j.econmod.2016.03.002
- Baker, S. R., Bloom, N., Davis, S. J., Kost, K., Sammon, M., & Viratyosin, T. (2020). The unprecedented stock market reaction to COVID-19. The Review of Asset Pricing Studies, 10(4), 742–758. https://doi.org/10.1093/rapstu/raaa008
- Destek, M. A. (2016). Renewable energy consumption and economic growth in newly industrialized countries: Evidence from asymmetric causality test. Renewable Energy, 95, 478–484. https://doi.org/10.1016/j.renene.2016.04.049
- Diks, C., & Panchenko, V. (2006). A new statistic and practical guidelines for nonparametric Granger causality testing. Journal of Economic Dynamics and Control, 30(9–10), 1647–1669. https://doi.org/10.1016/j.jedc.2005.08.008
- Doornik, J. A., & Hansen, H. (2008). An omnibus test for univariate and multivariate normality. Oxford Bulletin of Economics and Statistics, 70, 927–939. https://doi.org/10.1111/j.1468-0084.2008.00537.x
- Dorfleitner, G., & Grebler, J. (2022). Corporate social responsibility and systematic risk: International evidence. The Journal of Risk Finance, 23(1), 85–120. https://doi.org/10.1108/JRF-07-2020-0162
- Drewes, M., Daumann, F., & Follert, F. (2021). Exploring the sports economic impact of COVID-19 on professional soccer. Soccer & Society, 22(1–2), 125–137. https://doi.org/10.1080/14660970.2020.1802256
- Dutta, A. (2001). Telecommunications and economic activity: An analysis of Granger causality. Journal of Management Information Systems, 17, 71–95.
- Dutta, A., Bouri, E., & Saeed, T. (2021). News-based equity market uncertainty and crude oil volatility. Energy, 222, 119930. https://doi.org/10.1016/j.energy.2021.119930
- Edmans, A., Garcia, D., & Norli, Ø. (2007). Sports sentiment and stock returns. The Journal of Finance, 62(4), 1967–1998. https://doi.org/10.1111/j.1540-6261.2007.01262.x
- Faisal, F., Tursoy, T., & Berk, N. (2018). Linear and non-linear impact of Internet usage and financial deepening on electricity consumption for Turkey: Empirical evidence from asymmetric causality. Environmental Science and Pollution Research International, 25(12), 11536–11555. https://doi.org/10.1007/s11356-018-1341-7
- Ferrat, Y., Daty, F., & Burlacu, R. (2022). Short-and long-term effects of responsible investment growth on equity returns. The Journal of Risk Finance, 23(1), 1–13. https://doi.org/10.1108/JRF-07-2021-0107
- Freeman, J. R. (1983). Granger causality and the times series analysis of political relationships. American Journal of Political Science, 27(2), 327–358. https://doi.org/10.2307/2111021
- Gharib, C., Mefteh-Wali, S., & Jabeur, S. B. (2021). The bubble contagion effect of COVID-19 outbreak: Evidence from crude oil and gold markets. Finance Research Letters, 38, 101703. https://doi.org/10.1016/j.frl.2020.101703
- Granger, C. W. (1969). Investigating causal relations by econometric models and cross-spectral methods. Econometrica, 37(3), 424–438. https://doi.org/10.2307/1912791
- Granger, C. W. (1980). Testing for causality: A personal viewpoint. Journal of Economic Dynamics and Control, 2, 329–352. https://doi.org/10.1016/0165-1889(80)90069-X
- Granger, C. W., & Yoon, G. (2002). Hidden cointegration. Economics Working Paper. University of California.
- Hatemi-j, A. (2003). A new method to choose optimal lag order in stable and unstable VAR models. Applied Economics Letters, 10(3), 135–137. https://doi.org/10.1080/1350485022000041050
- Hatemi-j, A. (2012a). Asymmetric causality tests with an application. Empirical Economics, 43(1), 447–456. https://doi.org/10.1007/s00181-011-0484-x
- Hatemi-J, A. (2012b). Is the UAE stock market integrated with the USA stock market? New evidence from asymmetric causality testing. Research in International Business and Finance, 26(2), 273–280. https://doi.org/10.1016/j.ribaf.2012.01.002
- Hoffmann, R., Lee, C. G., Ramasamy, B., & Yeung, M. (2005). FDI and pollution: A granger causality test using panel data. Journal of International Development, 17(3), 311–317. https://doi.org/10.1002/jid.1196
- Ji, X., Zhang, Y., Mirza, N., Umar, M., & Rizvi, S. K. A. (2021). The impact of carbon neutrality on the investment performance: Evidence from the equity mutual funds in BRICS. Journal of Environmental Management, 297, 113228. https://doi.org/10.1016/j.jenvman.2021.113228
- Kilian, L., & Park, C. (2009). The impact of oil price shocks on the US stock market. International Economic Review, 50(4), 1267–1287. https://doi.org/10.1111/j.1468-2354.2009.00568.x
- Kim, Y. H., Nauright, J., & Suveatwatanakul, C. (2020). The rise of E-Sports and potential for Post-COVID continued growth. Sport in Society, 23(11), 1861–1871. https://doi.org/10.1080/17430437.2020.1819695
- Liang, C., Li, Y., Ma, F., & Wei, Y. (2021a). Global equity market volatilities forecasting: A comparison of leverage effects, jumps, and overnight information. International Review of Financial Analysis, 75, 101750. https://doi.org/10.1016/j.irfa.2021.101750
- Liang, C., Ma, F., Wang, L., & Zeng, Q. (2021b). The information content of uncertainty indices for natural gas futures volatility forecasting. Journal of Forecasting, 40(7), 1310–1324. https://doi.org/10.1002/for.2769
- Liang, C., Wei, Y., Li, X., Zhang, X., & Zhang, Y. (2020a). Uncertainty and crude oil market volatility: New evidence. Applied Economics, 52(27), 2945–2959. https://doi.org/10.1080/00036846.2019.1696943
- Liang, C., Wei, Y., & Zhang, Y. (2020b). Is implied volatility more informative for forecasting realized volatility: An international perspective. Journal of Forecasting, 39(8), 1253–1276. https://doi.org/10.1002/for.2686
- Li, Y., Liang, C., Ma, F., & Wang, J. (2020). The role of the IDEMV in predicting European stock market volatility during the COVID-19 pandemic. Finance Research Letters, 36, 101749. https://doi.org/10.1016/j.frl.2020.101749
- Li, J.-P., Naqvi, B., Rizvi, S. K. A., & Chang, H.-L. (2021). Bitcoin: The biggest financial innovation of fourth industrial revolution and a portfolio's efficiency booster. Technological Forecasting and Social Change, 162, 120383. https://doi.org/10.1016/j.techfore.2020.120383
- Lobato, M., Rodríguez, J., & Romero, H. (2021). A volatility-match approach to measure performance: The case of socially responsible exchange traded funds (ETFs). The Journal of Risk Finance, 22(1), 34–43. https://doi.org/10.1108/JRF-04-2020-0066
- Meek, A. (1997). An estimate of the size and supported economic activity of the sports industry in the United States. Sport Marketing Quarterly, 6, 15–22.
- Mirza, N., Hasnaoui, J. A., Naqvi, B., & Rizvi, S. K. A. (2020a). The impact of human capital efficiency on Latin American mutual funds during Covid-19 outbreak. Swiss Journal of Economics and Statistics, 156(1), 1–7. https://doi.org/10.1186/s41937-020-00066-6
- Mirza, N., Naqvi, B., Rahat, B., & Rizvi, S. K. A. (2020b). Price reaction, volatility timing and funds' performance during Covid-19. Finance Research Letters, 36, 101657. https://doi.org/10.1016/j.frl.2020.101657
- Mirza, N., Rahat, B., Naqvi, B., & Rizvi, S. K. A. (2020c). Impact of Covid-19 on corporate solvency and possible policy responses in the EU. The Quarterly Review of Economics and Finance, https://doi.org/10.1016/j.qref.2020.09.002
- Moritz, S., Gottschick, C., Horn, J., Popp, M., Langer, S., Klee, B., Purschke, O., Gekle, M., Ihling, A., Zimmermann, F., & Mikolajczyk, R. (2021). The risk of indoor sports and culture events for the transmission of COVID-19. Nature Communications, 12(1), 1–9. https://doi.org/10.1038/s41467-021-25317-9
- Naqvi, B., Mirza, N., Rizvi, S. K. A., Porada-Rochoń, M., & Itani, R. (2021). Is there a green fund premium? Evidence from twenty seven emerging markets. Global Finance Journal, 50, 100656. https://doi.org/10.1016/j.gfj.2021.100656
- Rizvi, S. K. A., Mirza, N., Naqvi, B., & Rahat, B. (2020a). Covid-19 and asset management in EU: A preliminary assessment of performance and investment styles. Journal of Asset Management, 21(4), 281–291. https://doi.org/10.1057/s41260-020-00172-3
- Rizvi, S. K. A., Yarovaya, L., Mirza, N., & Naqvi, B. (2020b). The impact of COVID-19 on valuations of non-financial European firms. Available at SSRN 3705462
- Savić, Z., Ranđelović, N., Stojanović, N., Stanković, V., & Šiljak, V. (2018). The sports industry and achieving top sports results. Facta Universitatis, Series: Physical Education and Sport, 15(3), 513–522. https://doi.org/10.22190/FUPES1703513S
- Sayyd, S. M., Zainuddin, Z. A., & Seraj, P. M. (2021). A scientific overview of the impact of COVID-19 pandemic on sports affairs: A systematic review. Physical Education of Students, 25(4), 221–229. https://doi.org/10.15561/20755279.2021.0403
- Scott Hacker, R., & Hatemi-J*, A. (2005). A test for multivariate ARCH effects. Applied Economics Letters, 12(7), 411–417. https://doi.org/10.1080/13504850500092129
- Sikiru, A. A., & Salisu, A. A. (2021). Hedging against risks associated with travel and tourism stocks during COVID‐19 pandemic: The role of gold. International Journal of Finance & Economics, https://doi.org/10.1002/ijfe.2513
- Sims, C. A. (1972). Money, income, and causality. The American Economic Review, 62, 540–552.
- Tiwari, A. K. (2014). The asymmetric Granger-causality analysis between energy consumption and income in the United States. Renewable and Sustainable Energy Reviews, 36, 362–369. https://doi.org/10.1016/j.rser.2014.04.066
- Umar, M., Ji, X., Mirza, N., & Naqvi, B. (2021a). Carbon neutrality, bank lending, and credit risk: Evidence from the Eurozone. Journal of Environmental Management, 296, 113156. https://doi.org/10.1016/j.jenvman.2021.113156
- Umar, M., Ji, X., Mirza, N., & Rahat, B. (2021b). The impact of resource curse on banking efficiency: Evidence from twelve oil producing countries. Resources Policy, 72, 102080. https://doi.org/10.1016/j.resourpol.2021.102080
- Umar, M., Rizvi, S. K. A., & Naqvi, B. (2021c). Dance with the devil? The nexus of fourth industrial revolution, technological financial products and volatility spillovers in global financial system. Technological Forecasting and Social Change, 163, 120450. https://doi.org/10.1016/j.techfore.2020.120450
- Umar, M., Su, C.-W., Rizvi, S. K. A., & Lobonţ, O.-R. (2021d). Driven by fundamentals or exploded by emotions: Detecting bubbles in oil prices. Energy, 231, 120873. https://doi.org/10.1016/j.energy.2021.120873
- Umar, M., Su, C.-W., Rizvi, S. K. A., & Shao, X.-F. (2021e). Bitcoin: A safe haven asset and a winner amid political and economic uncertainties in the US? Technological Forecasting and Social Change, 167, 120680. https://doi.org/10.1016/j.techfore.2021.120680
- Wang, L., Ma, F., Niu, T., & He, C. (2020). Crude oil and BRICS stock markets under extreme shocks: New evidence. Economic Modelling, 86, 54–68. https://doi.org/10.1016/j.econmod.2019.06.002
- Wang, L., Ma, F., Niu, T., & Liang, C. (2021). The importance of extreme shock: Examining the effect of investor sentiment on the crude oil futures market. Energy Economics, 99, 105319. https://doi.org/10.1016/j.eneco.2021.105319
- Wang, J., & Wang, X. (2021). Covid-19 and financial market efficiency: Evidence from an entropy-based analysis. Finance Research Letters, 42, 101888. https://doi.org/10.1016/j.frl.2020.101888
- Wang, Y., Wang, Y., & Li, M.-X. (2019). Regional characteristics of sports industry profitability: Evidence from China’s province level data. Physica A: Statistical Mechanics and Its Applications, 525, 946–955. https://doi.org/10.1016/j.physa.2019.03.066
- Wong, A. Y.-Y., Ling, S. K.-K., Louie, L. H.-T., Law, G. Y.-K., So, R. C.-H., Lee, D. C.-W., Yau, F. C.-F., & Yung, P. S.-H. (2020). Impact of the COVID-19 pandemic on sports and exercise. Asia-Pacific Journal of Sports Medicine, Arthroscopy, Rehabilitation and Technology, 22, 39–44. https://doi.org/10.1016/j.asmart.2020.07.006
- Yarovaya, L., Mirza, N., Abaidi, J., & Hasnaoui, A. (2021). Human capital efficiency and equity funds’ performance during the COVID-19 pandemic. International Review of Economics & Finance, 71, 584–591. https://doi.org/10.1016/j.iref.2020.09.017
- Yarovaya, L., Mirza, N., Rizvi, S. K. A., & Naqvi, B. (2020a). COVID-19 pandemic and stress testing the eurozone credit portfolios. Available at SSRN 3705474
- Yarovaya, L., Mirza, N., Rizvi, S. K. A., Saba, I., & Naqvi, B. (2020b, November 25). The resilience of Islamic equity funds during COVID-19: Evidence from risk adjusted performance, investment styles and volatility timing. In Investment Styles and Volatility Timing.
- Zhang, Y., Ma, F., & Wang, Y. (2019a). Forecasting crude oil prices with a large set of predictors: Can LASSO select powerful predictors? Journal of Empirical Finance, 54, 97–117. https://doi.org/10.1016/j.jempfin.2019.08.007
- Zhang, Y., Wei, Y., Zhang, Y., & Jin, D. (2019b). Forecasting oil price volatility: Forecast combination versus shrinkage method. Energy Economics, 80, 423–433. https://doi.org/10.1016/j.eneco.2019.01.010
- Zhu, S., Liu, Q., Wang, Y., Wei, Y., & Wei, G. (2019). Which fear index matters for predicting US stock market volatilities: Text-counts or option based measurement? Physica A: Statistical Mechanics and Its Applications, 536, 122567. https://doi.org/10.1016/j.physa.2019.122567