
 ?Mathematical formulae have been encoded as MathML and are displayed in this HTML version using MathJax in order to improve their display. Uncheck the box to turn MathJax off. This feature requires Javascript. Click on a formula to zoom.
Abstract
Since the debate concerning economic growth, energy consumption, and environmental degradation is a burning issue in the last few decades. Yet the outcomes are controversial and requires more empirical work. This study used novel research methods to investigate the said issue in case of China since is the leading energy importing and pollution emitting economy. The time series data covers the period from 1969 to 2018 is analyzed via employing the novel Quantile-on-Quantile regression methods. The estimated results unveil that fossil fuel consumption significantly enhances carbon emissions in the country in the lower and middle quantiles. Besides, the economic growth showed an inverted U-shaped impact on the carbon emissions, where the lower-medium quantiles showed positive and the upper quantiles exhibit negative impact on carbon emissions. Besides, the positive association between economic growth and fossil fuel emissions are also evident in the analysis. The Granger causality indicates that there is a bidirectional causality between the study variables – validating that economic growth and fossil fuel consumption are the primary sources of increased emissions level. On the basis of empirical results, this study suggests the adoption of energy efficient/saving products and services, diverting economic growth to renewable and environmentally friendly energy resources, technological innovation and increased investment in the research and development to reduce dependency on fossil fuel energy consumption and attain low carbon economy.
1. Introduction
Since the last few decades, the nexus between economic growth, energy consumption and carbon (CO2) emissions are the most burning issue across the world. Kraft and Kraft (Citation1978) were the first to investigate the link between economic growth, energy consumption, and CO2 emission in the United States. Afterwards, numerous additional studies have subsequently been published that look at different nations, regions, and groups of countries concerning the said nexus. The discussion over this topic is becoming more important in the literature on CO2 reduction and energy economics since empirical studies demonstrate that nations that generate and use more energy are the rich economies than the other economies (Owusu & Asumadu-Sarkodie, Citation2016). Similar is the case of China, which is the most populated country across the world (1.4 billion population as of 2019) and a rapidly developing economic strength, making it the global largest producer and consumer of energy (U.S. Energy Information Administration, 2019). With its crucial role in the regeneration and extension of the Belt and Road Initiative, and with several nations registering by the day to encourage trade as well as economic growth, it is becoming progressively concerned about the environmental impact. The reason for this is that China's energy demands are significantly reliant on coal, which is accounted for 58 percent of China's energy consumption in 2019 (U.S. Energy Information Administration, 2019). As a result, the necessity for important stakeholders and the authorities to understand the complex interrelationship and future pathways of the tested parameters would result in the construction and implementation of strong, efficient, and environmental policies. Since China is the leading energy importing economy across the world, this economy also got the title of the leading emitter in the world. In other words, the most polluted country is considered as China. Also, the rapid economic growth and industrial expansion further fuel the need of traditional non-renewable energy consumption. Which is quite alarming and need immediate action to tackle the issue. Therefore, any policy level change regarding the economic growth and environmental recovery could provide a path for the rest of the emerging economies.
Climate change has captured the interest of globally recognized organizations, governments, and scholars as one of the most severe environmental challenges of modern times. The overall CO2 emission that causes global warming is regulated by energy consumption intensity, economic growth, rising population, and the CO2 emissions intensity, as per the Kaya identity (Kaya & Yokoburi, 1997). Policymakers and researchers, on the other side, have ascribed the higher CO2 emissions intensity to increasing energy use as a result of fast economic expansion and greater usage of fossil fuels (Sohag et al., Citation2015). The entire cost of global warming due to CO2 emissions is predicted to be around 5% of GDP each year, currently and in the future, and even 20 percent if timely action is not performed (Stern & Stern, Citation2007). As a result, to minimize CO2 emissions, energy demand must be controlled (Martinho, Citation2016). On the other hand, it is also claimed that reducing CO2 emissions has macroeconomic consequences (Fan et al., Citation2010). As energy is a significant input in the factor of production, any attempt to restrict energy use in order to minimize CO2 emissions would put a downward influence on the growth of the economy. Economic, ecological, and energy efficiency strategies are all in conflict with one another as a result of these counterarguments.
As a result of such competing views, two significant streams of empirical research have emerged. The initial line of the empirical study looked at the environment-economic growth nexus, with the goal of proving the Environmental Kuznets curve (EKC) validity. According to the EKC, the environment's quality will first decrease as income rises, but will finally improve in the long run as income rises (Grossman & Krueger, Citation1995). Hence, a rise in economic development will initially boost CO2 emissions, but as economic growth improves, CO2 emissions will decline due to environmentally friendly resources consumption. The pollution-economic growth connection has been the subject of several scholarly research, with mixed results (see for instance, Soytas et al., Citation2007; Wen et al., Citation2021). In contrast, the link between economic growth and energy use has been the focus of the second strand of empirical investigations. As mentioned earlier, Kraft and Kraft (Citation1978) established this research in their project. However, an omitted variable bias might have resulting in contradictory estimations in previous versions of these experiments, which were done in bivariate models (see Yu & Hwang, Citation1984). On the other hand, recent research has used multivariate models and sophisticated time-series estimating methodologies, still, the results are mixed (Acheampong, Citation2018; Zhang & Cheng, Citation2009, among others).
Some experts propose that such two constituents of research should be combined since the causal link between CO2 emissions, economic growth, and energy consumption has significant policy consequences (Soytas & Sari, Citation2009). Energy use has a powerful effect on CO2 emissions (Ang, Citation2007), therefore knowing the correlations between these variables in parallel would aid in resolving any potential conflicts between policies regarding, environmental, economic and energy conservation measures.
This paper aims to analyze the influence of fossil fuel consumption on CO2 emissions in China. Since the causal association only is limited to direct the specific policy measures regarding energy and environment. Therefore, this study extensively measures the association between these variables by using a novel econometric approach. The contradictory results in relation of the economic growth and CO2 emissions help constitute the second aim of this study. In other words, this study aims to reinvestigate the influence of economic growth on CO2 emissions. Thirdly, this study analyzes the association of fossil fuel consumption and economic growth distinctly. Following the earlier studies, this study also aims to analyze the causal nexus of these mentioned variables in the extended available dataset. In order to achieve these objectives, this study uses a novel research method such as employing the Quantile-on-Quantile regressions, which is efficient in dealing the data with abnormality behavior. This study contributes to the existing literature by providing distinctive empirical evidence for fossil fuel energy and CO2 emissions, economic growth and CO2 emissions, economic growth and fossil fuel consumption. Although the earlier studies cover the said nexuses between the variables, yet the contribution of this study will help assure the true association between these variables. In addition, most of the earlier studies have considered limited datasets, that could lead to invalid or biased results. In this sense, the contribution of this study is worthy to the existing academic literature that providing empirical evidence for the extended dataset available – covering the period from 1969 to 2018 in China. Lastly, Hence, this study contributes to the existing literature by providing new policy insights and measures for effective policy making. Based on the results of this extended data, policy-makers and governors may be benefited to implement appropriate regulations that not only tackles the issue of emissions, but also economic sustainability.
The manuscript is further classified into four sections, where the relevant literature review is provided in Section-2; data and the methodological setup is presented in Section-3; the estimated results are provided and discussed in Section-4. While Section-5 presents the concluding remarks and policy implications.
2. Literature review
During the last three decades, extensive evidence has been provided regarding the association of energy consumption and environmental quality of various countries and regions. More specifically, empirical studies in the last two decades have considered energy consumption as a substantial factor of environmental degradation. The study of Soytas et al. (Citation2007) investigated United States concerning the causal association between energy consumption, economic growth and CO2 emissions. The empirical findings asserted that the income does not Granger causes CO2 emissions, whereas energy consumption does. Therefore, the study claimed that instead of income, energy related policies could be used as a tool for environmental recovery. In case of Turkey, Ozturk and Acaravci (Citation2010) analyzed the period from 1968 to 2005 and validates the long-run association between the variables (energy consumption, CO2 emissions and economic growth). The study asserted that income enhances energy consumption as well as CO2 emissions. On the contrary to Soytas et al. (Citation2007), this study revealed that no causal association exist and the environmental Kuznets curve (EKC) paradox is not valid in Turkey. On the other hand, Pao and Tsai (Citation2010) examined BRIC economies throughout 1971–2005 in order to examine the impact of energy and income on environmental quality. The examined results unveil that the energy consumption significantly enhances emissions. However, the influence of income or economic growth is found inverted U-shaped, that validates the EKC hypothesis in these economies. Besides, the study provides evidence of bidirectional causal nexus between energy consumption and emissions, and energy consumption and economic growth.
In the same line, Ang (Citation2007) used vector error correction modelling approach and demonstrates that economic growth significantly promotes energy use, that further enhances environmental pollution in France between 1960 and 2000. In case of the European economies, Acaravci and Ozturk (Citation2010) used autoregressive distributed lags model and asserted that energy consumption is the substantial factor of emissions in the region. The study also revealed that economic growth positively influences emissions, while squared economic growth exhibit negative influence on emissions in the region – validating EKC paradox in Denmark and Italy. Another study of Ang (Citation2008) analyzed the causal nexus of under discussion variables over the period from 1971 to 1999. The examined results asserted that the energy consumption and CO2 emissions are positively affecting economic growth in Malaysia. Besides, the authors claimed that there exists unidirectional causal association running from economic growth to use of energy in the long- and short-run. Generally, it is believed that energy consumption is dependent on the prices of energy. However, the study of Belke et al. (Citation2011) demonstrates that energy use in the 25 Organization of Economic Cooperation and Development (OECD) economies is price inelastic. However, the cointegration relationship exist between energy use and growth of economy. Besides, two-way causal association is validated between these two variables. Moreover, there are number of earlier studies that considers causal association as well as influence of fossil fuel energy consumption and economic growth on CO2 emissions in various countries and regions (see for instance Apergis & Payne, Citation2010; Aqeel & Butt, Citation2001; Hondroyiannis et al., Citation2002; Mehrara, Citation2007; Lee & Chang, Citation2008; Wolde-Rufael, Citation2009). However, these studies mentioned that the influence of renewable energy consumption on economic growth and environmental quality is positive in both developed and developing economies.
Beside the nexus of economic growth and energy use with the CO2 emissions, recent studies have also empirically tested the association of financial inclusion and environmental quality. Specifically, the study of Shahbaz et al. (Citation2022) examined the effects of financial inclusion collaborative emissions reduction on case of China throughout 2001–2017. The estimated results asserted that financial inclusion adversely affects emissions and improves environmental quality. Similar findings regarding the nexus of financial inclusion and pollution via quantile regression for the emerging seven economies is also provided by Qin et al. (Citation2021a). Beside financial inclusion, Shahbaz et al. (Citation2021) investigated the G-7 economies over the period 1870–2014 via employing time-varying cointegration approach. The estimated results asserted that financial development heterogeneously influences emissions of each country. Also, the study of Zhao et al. (Citation2021) examined financial risk in case of the RCEP and non-RCEP economies and concludes that financial risk and technological innovation heterogeneously affects global emissions level. On the other hand, Shahbaz et al. (Citation2015) and Dong et al. (Citation2021) argued that the development of foreign direct investments and energy resiliance leads to enhance environmental quality degradation, that validate the pollution haven hypothesis from the global perspective. In addition to that, imposing pollution fees could also reduce the level of emissions in China (Dong et al., Citation2022). As per the recent study of Shahzad et al. (Citation2021) and Qin et al. (Citation2021b), environmental legislations in the form of taxes and level of income, and financial development encourages the renewables generation in developed economies and China, which consequently reduces the level of emissions in the regions.
Apart from the earlier studies, number of recent studies also examined the nexus of energy consumption, economic growth and CO2 emissions. Specifically, Tang et al. (Citation2016) examined energy use and economic growth along with other macroeconomic variables in case of Vietnam throughout 1971–2011. Using cointegration and Granger causality approaches, the study found the existence of cointegration association between the variables in long-run. Also, the authors claim that energy use, foreign direct investment and capital stock are the primary factors of economic growth in the country. Besides, findings revealed that there is a unidirectional causality from energy use to economic growth, that validates Vietnam is an energy dependent economy. On the other hand, Acheampong (Citation2018) analyzed 116 economies throughout 1990–2014 and employed multivariate model. The estimated results illustrate that economic growth do not cause economic growth, whereas energy consumption has a unidirectional causal impact on economic growth. On the other hand, two-way causal nexus exists between emissions and economic growth. The study also identified the causal nexus of energy use and CO2 emissions. The recent study of Wen et al. (Citation2021) examined the impact of fossil energy, globalization, and economic growth on emissions of the South Asian countries between 1985–2018. Employing fully modified ordinary least square (FMOLS) approach, the estimated results reveal that globalization and fossil fuel energy consumption positively impact emissions in the region. However, economic growth asserted that there exists an inverted U-shaped relationship – validating EKC hypothesis in the region. In the same line, Ahmed et al. (Citation2022) examined 22 OECD economies over the period 1971–2020 via employing cross-sectionally augmented ARDL approach. The examined results concludes that militarization, non-renewable energy consumption, and economic growth positively and significantly affect CO2 emissions in the region. However, renewable energy promotes environmental quality improvement. In case of 22 top remittance receiving economies, Zafar et al. (Citation2021) unveils that although economic growth enhances the level of pollution. Still, remittances, renewable energy and export diversification helps reduce environmental degradation in the region. In case of the G-20 economies, Li et al. (Citation2020) examined the under-discussion association via applying the common correlated effect mean group (CCEMG) and augmented mean group (AMG) approaches. The study found that economic growth and energy use are bidirectionally connected to emissions in the region. This indicates that economic growth and energy use are the key factors of environmental degradation in these economies. However, foreign direct investment is unidirectionally connected to emissions. Salari et al. (Citation2021) studies the 1997–2016 period in case of the US and concludes consistent findings to the existing literature that fossil fuel energy (total, industrial, non-renewable, and residential) consumption encourages CO2 emissions in the country, while renewable energy reduces them. In addition, the study asserted the validity of EKC paradox in the US.
Apart from the EKC paradox validity, Luan et al. (Citation2022) uses econometric tools such AMG, FMOLS, and DOLS approaches and reveal that investment in new energy industry significantly reduces the level of harmful emissions in Chinese provinces. Where the green development could be a prominent source of emissions reduction in province like Anhui in China (Cai et al., Citation2022). Since China is an emerging economy and remained on the top of the list in energy imports and emissions. Therefore, scholars and policy-makers have provided empirical view on China in different periods. Specifically, Zhang and Cheng (Citation2009) examined the period from 1960–2007 by utilizing multivariate modelling approach. The estimated results asserted that there exists unidirectional causal influence from economic growth to energy use, and energy use to emissions. The study validates that both energy use and emissions are not the substantial factors of economic growth in the country. The recent study of Kongkuah et al. (Citation2021) examined the role of international trade and urbanization in the nexus of energy use, economic growth, and environmental degradation. Employing the FMOLS and vector error correction model (VECM), the results asserted that trade openness, energy use and economic growth are the factors of environmental degradation in China. However, urbanization exhibits negative and significant influence on the environmental quality degradation. In the same country, Zhao et al. (Citation2021) estimated the period 2000–2017 by utilizing panel vector autoregressive (PVAR) and system-generalized method of moments. The examined results asserted that economic growth and energy consumption are the significant factors of each other, where bidirectional causality also exists between them. Besides, economic growth contributes to environmental degradation in China. However, fixed asset investment substantially reduces environmental degradation. In case of 30 Chinese provinces, Zhang and Zhang (Citation2021) provide evidence from the VECM granger causality test that emissions and economic growth are bidirectionally connected in the long-run. Whereas, economic growth is bidirectionally associated to tourism only in the short-run.
3. Data and methodology
3.1. Data
Based on the objectives and above literature review, this study used three variables. Where the dependent variable is carbon dioxide (CO2) emissions. The greater part of greenhouse gas (GHG) emissions from the industry are CO2, but minor quantities of nitrous oxide (N2O) and methane (CH4) are also produced. Such hazardous gases are produced when fossil fuels such as natural gas, coal, and oil, are burned to generate power or electricity (US-EPA, 2019). Besides, China is among the top pollution emitter in the world. Since the CO2 emissions cover most of the GHG emissions in the country, therefore it is important to empirically investigate the CO2 emissions of China. The CO2 emissions are measured in kiloton (kt) In addition, two explanatory variables are taken into consideration. Firstly, the fossil fuel consumption (FFC), where coal, oil, petroleum, and natural gas products are examples of fossil fuels. Since fossil fuels take millions of years to develop and reserves are drained considerably quicker than new ones are created, they are non-renewable resources.Footnote1 Here, the variable FFC is measured as percent of total energy consumption. Secondly, this study used economic growth, which could be a substantial factor of CO2 emissions in China. In order to proxy economic growth, this study used the gross domestic product (GDP), which is the market value of all final services and goods produced in a particular time period in a country. Since the GDP considers consumption, investment, and government expenditures, therefore it could effectively represent economic growth and is measured at constant 2015 US dollars. Time series data for these variables cover China over the extended period from 1969 to 2018. For all the variables, the time series data is extracted from the World Development Indicators (World Bank, Citation2022)Footnote2.
3.2. Estimation strategy
3.2.1. Descriptive statistics and normality check
This study calculated the descriptive statistics of all the variables under study, i.e.,
and
in the selected country over the time. Specifically, evaluation for the variables’ mean and median values are provided for the period 1969–2018. Additionally, this study provides the standard deviation of each variable, that demonstrates variability of observation from the mean value and also indicates volatility of the concerned variables. Moreover, the skewness and Kurtosis values are also estimated that indicates normality of variable or data. However, in order to measure normality of the variable more comprehensively, we employed the normality test proposed by Jarque and Bera (Citation1987). This normality test ponders both the skewness and excess Kurtosis to deliver results of the data’s normality. The standard equation form of the Jarque and Bera (Citation1987) normality test is provided as follows:
(1)
(1)
Where the EquationEq. (1)(1)
(1) assumes that both the skewness and excess Kurtosis are equal to zero – null hypothesis. However, if the probability values for each variable is significant at 1%, 5%, or 10% levels, the null proposition could be rejected, which concludes that the data is not normally distributed.
3.2.2. Stationarity testing
Time series data stationarity is a typical issue. Before employing an econometric model, make sure that the variables are stationary. Conventional approaches of applied econometrics assessment are founded on the assumption of normality, which states that the mean and variance do not fluctuate over time (Khan et al., Citation2020). Many economic factors, however, do not have constant mean and variance, and these variables are referred to be unit root components. In the case of stationary data, the traditional technique [i.e., ordinary least square (OLS)] yields biased and inaccurate results. Dickey and Fuller (Citation1979) presented an augmented Dickey-Fuller (ADF) unit root testing approach, which we employed in our study. The ADF unit root test is used in our empirical study to ensure that each variable is stationary.
3.2.3. Quantile on quantile (QQ) regression
The Quantile-on-Quantile (QQ) approach is used in this work, as discussed and recommended by Sim and Zhou (Citation2015). This method, often known as the generalization of the conventional and standard quantile regression model, helps analyze the impact of one variable’s quantiles on the quantiles of another variable. It also employs two different methods: first, quantile regression, which examines the influence of indicators on the quantiles of dependent variables, and second, non-parametric estimation. Koenker and Bassett (Citation1978) proposed a more advanced version of basic ordinary least square (OLS) based linear regression, in which the averages of variable is matched to another variable’s averages. On the contrary, quantile regression may be able to describe more quantile variation, allowing analysts to forecast with fewer complications. Furthermore, as Stone (Citation1977) and Cleveland (Citation1979) explore and demonstrate, traditional regression decreases dimensionality to integrate a linear function, resulting in a loss of prediction ability. Once the explanatory factors' quantiles are matched to the quantiles of dependent variables, as enabled by the QQ approach, the forecasting ability improves since more variance between the elements are explained (Shahzad et al., Citation2017). The following is an expression for a non-parametric QQ regression model:
(2)
(2)
Where the above equation reveals that is carbon emissions in a particular time period, and
represents the vector that captures each independent variable utilized in this study, including
and
during the study period. Additionally,
shows the
quantile, which is opted based in the standard conditional distribution, and the error term is depicted by the vector
Here, the conditional
th is taken as equal to zero. Further,
demonstrates the unified function because of the lacking information regarding the between explanatory and dependent variable (
and
).
The QQ approach examines the association between numerous elements while determining the entire behavior of the ideas. Specifically, any positive or negative shock in has the same impact on
For e.g., the sorts of disturbances in
can be negative or positive, and the
can respond symmetrically or asymmetrically.
To examine the impact of quantile on the
th quantile, the priorly mentioned equation could be analyzed along with the
in a linear regression modelling. As the
function is unified, therefore the Taylor’s expansion first order function may be given as below:
(3)
(3)
From EquationEq. (3)(3)
(3) ,
represents the partial derivatives of
in terms of individual independent variable – also known as response of marginal effect. Such can be calculated likewise the traditional linear regression modelling approach. In addition, the parameters are double indexed, which can be seen on the latter equation, i.e.,
and
in relation of
and
Moreover, the function
indicates both
and
Here,
is the functional form of
revealing
and
both are the functional forms of
and
Further, the arrangement of both
and
is given as
and
appropriately. Hence, the transformed version of EquationEq. (5)
(5)
(5) could be expressed as follows:
(4)
(4)
However, the latter could be further organized as the final form is expressed as:
(5)
(5)
In the above EquationEq. (5)(5)
(5) , (*) is the conditional quantile (
) of carbon emissions depicted as
In the said conditional quantile, the parameters are indexed twice, ‘
’ and ‘
’ in terms of
and
correspondingly, whereas this shows the
quantile of dependent variable
with the explanatory variable’s
quantile. A fluctuation may exist among the
quantiles parameters of
and the explanatory variable’s
quantile. Furthermore, no prospects exist there between the said variable at any point in time. Consequently, the above-mentioned equation assesses the connection of the model that is distribution-based dependence of the study variables. Moreover, in the under-discussion equation, the predicted correspondents
and
could be replaced with the
and
respectively. Thus, the estimated coefficients (
and
), represented by
and
could be predicted via the linear regression model and the minimization problem may be used for estimation as given below:
(6)
(6)
From EquationEq. (6)(6)
(6) ,
represents quantile loss, and may be described as
Where the unusual indicator’s structure could be shown as I and the K (*) demonstrates the kernel function, while the kernel bandwidth parameter is represented by h.
In current study, the Gaussian kernel is used to estimate the weighting of neighborhood data. In economics and finance, the Gaussian kernel is among the most widely used, researched, and famous kernel functions, with the benefit of being easy to execute and assess. As it approaching 0, this kernel has the advantage of being symmetrical, with low weights applied to succeeding data. The mentioned weight and distance among the
distribution function is inversely related in this study, which could be expressed as
while the distribution function results are depicted by
which may deal with the
quantile.
3.2.5. Panel causality test
Employing the QQ regression approach led to provide the long-run association of each explanatory factor with the emissions at each specific quantile. Yet, this approach is limited in terms of causal properties between
and
emissions. Therefore, we employed the Granger causality test developed by Granger (Citation1969). Regression analysis often represent ‘simple’ correlation, but Granger (Citation1969) proposed that causality in economics might be evaluated by calculating the capacity to predict future values of a time series given previous values of some other time series. This test can be performed on the leveled or first differenced data. In order to analyze the null hypothesis of the said test that z does not Granger cause x, it is important to identify the proper lagged values of x to consider it in a univariate autoregression of x.
(7)
(7)
The augmentation of the autoregression via incorporating lagged values of z, given as:
(8)
(8)
All lagged values of z that remain singularly significant based on their t-statistics are retained in this model, given that they jointly add predictive power to the regression based on an F-test. Here, p is the minimum, and q is the largest, lag length whereby the lagging value of z is meaningful in the prior extended regression. If no lagging values of z are kept in the regression, the null hypothesis that z does not Granger cause x will be accepted.
4. Results and discussion
This study begins the empirical results section by providing the descriptive statistics and normality estimates of the variables under study, as reported in . Specifically, the mean values of all the three variables are positive, which indicates that economic growth, fossil fuel energy consumption, and carbon emissions followed a steady path of increase. Also, the median values are positive and for the median values are approximately the same to mean values. Besides, the standard deviation is found higher for all the three variables i.e.,
and
This reveals that these variables are fluctuating across the time. In addition, the skewness and Kurtosis values are also provided in the under-discussion table, which indicates that the statistical values are different than the tabulated values of skewness and Kurtosis for
and
On the other hand, the Jarque and Bera (Citation1987) normality test provides statistically significant estimates as shown by the probability values of
and
that rejects the null hypothesis of data being normal and asserted that data is non-normally distributed. However, the values of
is statistically insignificant, which holds the property of data’s normality. In order to tackle the data non-normality issue, this study uses a novel QQ regression approach that allows for data normality in a time series.
Table 1. Descriptive Statistics and Normality Test.
After the data normality check, this study tested the for the presence of unit root in the time series. In this regard, the estimated results of the ADF unit root test are provided in . The estimated results of variables at I(0) reports that all the variables are non-stationary and the unit root is present. This indicates that a structural break(s) is evident in the time series of
and
Since all the variables follows the property of non-stationary time series, therefore the said test is employed on the data at first difference. The I(1) statistics are found highly statistically significant at 1%, 5%, and 10% levels, that rejects the null hypothesis of the unit root presence. Instead, the variables are stationary.
Table 2. Augmented Dickey-Fuller test.
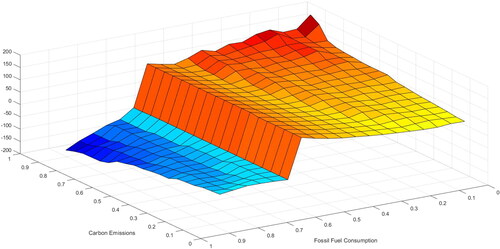
Since the Jarque and Bera (Citation1987) demonstrates the non-normal or irregular data distribution. This allows current study to utilize the QQ regression, which is an efficient estimator in tackling abnormality of the time series. reports the graphical display of the association between FFC and CO2 emissions in China. As per Xu et al. (Citation2021), the darker blue color demonstrates the lower coefficient value of the influence, whereas the darker red color indicates the higher magnitude value of an explanatory variable on the dependent variable. The estimated results revealed that the there is a positive impact of FFC on the CO2 emissions in the lower quantiles. However, the magnitude or the coefficient values becomes stronger while moving from Q0 to Q0.5. Here, the magnitude values range from 0 to 150 across the five quantiles. This positive association between fossil fuel energy consumption and CO2 emissions is consistent to the existing literature. That is, the study of Soytas et al. (Citation2007) and Ozturk and Acaravci (Citation2010) validates the positive impact of fossil energy consumption on emissions level in the United States and Turkey. Such findings are in line to the recent studies of Wen et al. (Citation2021) in the South Asian economies and Li et al. (Citation2020) in G20 economies, that reveals that energy consumption is the key factor of pollution emissions in these regions. Since China is an emerging economy that primarily focused on the industrial sector’s development and expansion. However, the primary energy source used in the industrial as well as household sectors are the fossil fuel energy consumption. On the one hand, this fossil fuel energy consumption fulfills the demand for energy requirements. On the other hand, combustion of such non-renewable energy sources produces CO2 emissions, which adversely affects environmental quality of China (Kongkuah et al., Citation2021). In other words, when fossil fuels such as oil, coal, and natural gas are used, they not only provide energy but also contribute to the present global warming catastrophe. Whenever fossil fuels are burnt, they release significant amounts of carbon dioxide into the atmosphere. Since the CO2 emissions trap heat in the atmosphere, they contribute to climate change. The combustion of fossil fuels, notably in the transport and energy sectors, is the leading source of carbon dioxide emissions in China. On the other hand, the fossil fuel consumption reported weaker coefficient values between quantile 0.6 to 0.9. This demonstrates that with the higher quantiles the magnitude of the influence is found negative. Still, the positive impact of FFC is stronger in case of China.
Figure 1. Quantiles on Quantiles Regression CO2-FFC.
Note: The z-axis indicates the coefficient values, the x-axis indicates FFC, and the y-axis represents CO2
Source: Authors own estimation on data obtained from given sources.
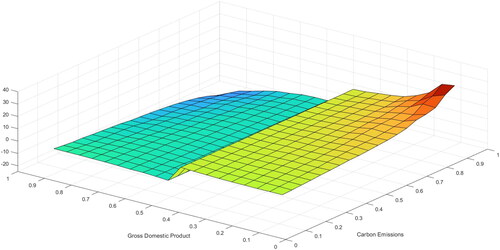
Concerning the association between economic growth and CO2 emissions, the relationship is found both positive and negative across the quantiles as shown in . Specifically, in the first five quantiles (Q0 – Q0.5), the GDP enhances CO2 emissions where the coefficient values range from 0 to 30. The highest magnitude of the coefficient value is reported in Q0.1 and Q0.2 of GDP and Q0.8 – Q1 of CO2 emissions. the positive association of GDP to that of CO2 emissions is consistent to the earlier studies of Ahmed et al. (Citation2022) in case of 22 OECD economies, Zafar et al. (Citation2021) in 22 to remittances receiving economies, Tang et al. (Citation2016) in case of Vietnam, and Ozturk and Acaravci (Citation2010) in Turkey. The extent of economic growth and development in any given nation is determined by a variety of variables. Different economic methods have been used to promote a rapid growth rate, with development dependent on the features of each specific nation and the prospective natural resources that are accessible. Growth has the potential to have detrimental effects on the environment in a variety of ways, including environmental conditions (pollution), which is now the most highlighted subject in the world. As the economy expands, more CO2 is generated, maybe as a result of an increase in industrial operations that do not apply ecologically friendly procedures that should improve environmental quality rather than degrade it. In the initial stages of economic development, economies are more concerned to the growth and expansion of industrial sector to achieve higher economic growth. In this regard, economies are more diverted towards the use of non-renewable energy consumption. Therefore, the large part of their investment and income are linked to the energy demand fulfillment. Similar is the case of China, where the policies are more growth oriented in the initial stage of development. Therefore, it is noted that the earlier stage of development leads to higher emissions of the CO2, which encourages climate change and environmental degradation. On the other hand, the upper quantiles showed the genitive values of coefficients on the CO2 emissions in China. Specifically, from Q0.6 to Q1, the coefficient value is found negative (around −10), indicating that enhancement in the economic growth is adversely affecting CO2 emissions and promote environmental sustainability. This demonstrates the existence of EKC paradox in China across the quantiles. That is, the lower quantiles report positive influence of economic growth on the CO2 emissions while the upper quantiles negatively and significantly affect CO2 emissions in case of China. Such findings are consistent to the studies of Soytas et al. (Citation2007) validates EKC hypothesis in Turkey, Pao and Tsai (Citation2010) in BRIC economies, Acaravci and Ozturk (Citation2010) in European economies, Wen et al. (Citation2021) in South Asian countries, and Salari et al. (Citation2021) in case of the US. Since these studies validates the EKC paradox in both developed and developing economies, whereas China is an emerging economy and rapidly expanding its economic growth at the cost of environment in the initial stages. However, after a threshold level of economic growth, China shifts to the adoption and promotion of environmentally friendly energy resources, which lowers CO2 emissions in the country and promote environmental sustainability.
Figure 2. Quantiles on Quantiles Regression CO2-GDP.
Note: The z-axis indicates the coefficient values, the x-axis indicates CO2, and the y-axis represents GDP.
Source: Authors own estimation on data obtained from given sources.
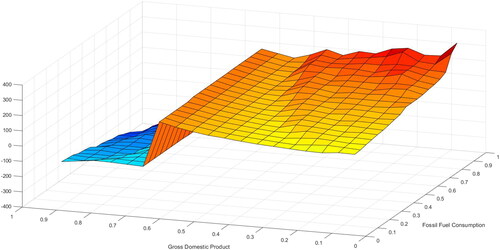
Since the earlier graphs revealed that both the energy consumption positively affects CO2 emissions, while the economic growth exhibits inverted U-shaped influence on the CO2 emissions in China. Since both these variables are in association to the CO2 emissions, whereas the literature refers that the association between economic growth and energy consumption also exists, therefore, this study also employed the QQ regression on the GDP and FFC nexus and the findings are reported in . The empirical results asserted that from lower to higher-middle quantiles, the influence of economic growth on consumption of fossil fuel is positive. Where the highest values are observed in the lower Q0 – Q0.4 of economic growth and higher quantiles of FFC, i.e., Q0.7 – Q1. The coefficient value is noticed positive range from 200 to 400. Whereas, the middle quantiles also indicate positive association of economic growth and consumption of fossil fuel, where the values range from 0 to 150 in Q0.5 – Q0.7 of economic growth and Q0 – Q0.6 of FFC. The positive nexus of economic growth and FFC is consistent to the existing study of Li et al. (Citation2020) in G-20 economies and Tang et al. (Citation2016) in Vietnam. Besides, these findings are also in line to the earlier studies of Ang (Citation2007) in France, Ang (Citation2008) in Malaysia, and Belke et al. (Citation2011) in 25 OECD economies. Since the earlier stage of development is an important indicator of the future development for a country, therefore economies are more diverted to the use of fossil fuel energy in order to run the industrial sector as well as fulfill the energy demand of residential and domestic sectors via enhancing the fossil fuel energy consumption. To be more specific, energy is a significant driver of economic development since it is used as a primary input in a wide range of consumption and manufacturing activities. Energy is among the most significant inputs in the process of developing an economy. When looked at from a purely physical standpoint, the utilization of energy is what drives industrial expansion and economic productivity, and it is essential to the functioning of any contemporary economy. The literature also argued that energy is responsible for nearly half of industrialization in a contemporary economy while accounting for less than one-tenth of the total manufacturing cost in the same country. However, after increase in income level up to the threshold level, the demand for fossil fuels starts declining, where economy diverted to environmental quality improvement. In this regard, economy like China uses environmentally friendly energy resources and reduces the use of non-renewables. Besides, there are many factors that contributes to the declination of fossil fuel energy. Specifically, higher level of economic growth helps in the enhancement of technological innovation, research and development culture, renewables production and adaptation, energy efficient products and services, financial inclusion (Qin et al., Citation2021a), environmental related technological innovation (Shahzad et al., Citation2021), which then help minimize fossil fuel consumption in China. As the graphical representation shows that at the higher quantiles (Q0.7 – Q1) of economic growth, the coefficient value is noted as negative and approximately equals 100. Therefore, it must be noted that China has already started initiatives of reducing fossil fuel energy consumption which helps structural transformation of the industrial sector to achieve low carbon economy and environmental sustainability.
Figure 3. Quantiles on Quantiles Regression GDP-FFC.
Note: The z-axis indicates the coefficient values, the x-axis indicates FFC, and the y-axis represents GDP.
Source: Authors own estimation on data obtained from given sources.
Since the QQ regression lacks the property of indicating any causal nexus between the variables, therefore this study employed the Granger (Citation1969) causality test to analyze the causal connection between the variables under consideration. The estimated results of the said test are reported in . The examined results revealed that there is a bidirectional causal association exist between FFC and CO2, GDP and CO2,. This demonstrates that although the fossil fuel consumption and economic growth are the causes of increased emissions in China. These findings are consistent to the study of Pao and Tsai (Citation2010), Li et al. (Citation2020), Zhao et al. (Citation2021), Zhang and Zhang (Citation2021). These studies also provide evidence of the bidirectional causal association between economic growth and emissions, energy consumption and emissions in various countries and regions during different time periods. Besides, the feedback effect is found between GDP and FFC, which replicate that enhancement in the fossil fuel consumption enhances economic growth and enhancement in the economic growth causes increase in the fossil fuel consumption, whereas both these variables are the strong factors of CO2 emissions in China. Hence, in order to attain low carbon economy in China, economic growth and fossil fuel consumption could be used as strong policy measures.
Table 3. Granger-Causality Test.
5. Conclusion and policy implications
5.1. Conclusion
This study examined the association of economic growth, fossil fuel consumption, and economic growth in China. Also, the relationship of economic growth and fossil fuel energy consumption is also investigated. Using the extended available dataset from 1969 to 2018, the data is obtained from the World Development Indicators of the World Bank (Citation2022). Since all the existing studies have provided extensive literature regarding the nexus of the said variables, yet this study adopted a novel approach for reinvestigating the said nexus in case of China. Specifically, we employed the novel quantile-on-quantile regression approach that deals the non-normality property of the data under consideration and provides visual estimates across the quantiles of dependent as well as explanatory variables. The empirical results reveals that there is a positive association of CO2 emissions and consumption of fossil fuel in the country. Also, enhancement in the economic growth causes a significant increase in the CO2 emissions in the lower and middle quantiles whereas negative affect in the higher quantiles. In addition, the economic growth also influences fossil fuel energy consumption in the lower and middle quantiles whereas negatively affects fossil fuel consumption in the upper quantiles. These associations depict that enhancement in the economic growth substantially increases fossil fuel consumption in the earlier stages, which can contribute to CO2 emissions in China. Latterly, after achieving a substantial level of economic growth, China reduces fossil fuel consumption by adopting energy saving technologies and renewable energy resources that helps industrial structural transformation in China to environmentally friendly energy resources. Therefore, the CO2 emissions also follows the declining path and the environmental quality started to improve. Besides, the bidirectional causal nexus between the variables asserted that economic growth and energy consumption are the primary causes of environmental degradation in China. This indicates that China is a fossil fuel energy dependent economy. Therefore, policies are recommended where energy consumption and fossil fuel consumption could be used as remedial measures for environmental recovery.
5.2. Policy implications
Based on the empirical evidence, this study suggests policies that could help emerging country like China towards environmental recovery and achieving carbon neutral economy. Firstly, policies are required that consider energy saving methods/products/services to reduce dependency on fossil fuel consumption. The reduced dependency on traditional fossil fuels will encourages environmentally friendly energy resources that speeds up environmental sustainability. Secondly, the empirical findings suggest that economic growth is more diverted to the adoption of fossil fuel consumption, which causes environmental quality degradation in China. Therefore, policies in the shape of enhancing and promoting renewable energy should be adopted that helps diverting the economic growth towards environmental sustainability. Nonetheless, the empirical results asserted that with the increase of income, the use of fossil fuel is also increased. Therefore, the rapid and increased economic growth of China shall be directed towards the structural transformation of the industrial sector, which is currently a heavy fossil fuel energy dependent sector and greatly contribute to the pollution emissions in the country. This transformation will help reduce demand for fossil fuel consumption, that will consequently lead the country to achieve the low carbon economy objectives. Moreover, China must stop or minimize subsidizing fossil fuel consuming and producing sectors. Instead, it is suggested that China should promote subsidizing energy efficient and environmentally friendly technological innovation and enhance investment in the renewable energy research and development sector. Since China is an emerging economy and the cost of such transformation could be costly, yet the outcome will be beneficial for the long-term economic growth as well as environmental sustainability.
| List of Abbreviations | ||
| CO2 | = | Carbon dioxide |
| EKC | = | Environmental Kuznets Curve |
| OECD | = | Organization of Economic Cooperation and Development |
| G-7 | = | Group of Seven |
| RCEP | = | Regional Comprehensive Economic Partnership |
| FMOLS | = | Fully-Modified Ordinary Least Square |
| DOLS | = | Dynamic Ordinary Least Square |
| ARDL | = | Autoregressive Distributed Lag |
| CCEMG | = | Common Correlated Effect Mean Group |
| AMG | = | Augmented Mean Group |
| VECM | = | Vector Error Correction Model |
| PVAR | = | Panel Vector Autoregressive |
| GHG | = | Greenhouse Gas |
| N2O | = | Nitrous Oxide |
| CH4 | = | Methane |
| FFC | = | Fossil Fuel Consumption |
Disclosure statement
No potential conflict of interest was reported by the authors.
Notes
2 For details and data, visit: https://databank.worldbank.org/source/world-development-indicators#
References
- Acaravci, A., & Ozturk, I. (2010). On the relationship between energy consumption, CO2 emissions and economic growth in Europe. Energy (Oxf), 35(12), 5412–5420. https://doi.org/10.1016/j.energy.2010.07.009
- Acheampong, A. O. (2018). Economic growth, CO2 emissions and energy consumption: What causes what and where? Energy Economics, 74, 677–692. https://doi.org/10.1016/j.eneco.2018.07.022
- Ahmed, Z., Ahmad, M., Murshed, M., Vaseer, A. I., & Kirikkaleli, D. (2022). The trade-off between energy consumption, economic growth, militarization, and CO2 emissions: Does the treadmill of destruction exist in the modern world? Environmental Science and Pollution Research, 29(12), 18063–18076. https://doi.org/10.1007/s11356-021-17068-3
- Ang, J. B. (2007). CO2 emissions, energy consumption, and output in France. Energy Policy, 35(10), 4772–4778. https://doi.org/10.1016/j.enpol.2007.03.032
- Ang, J. B. (2008). Economic development, pollutant emissions and energy consumption in Malaysia. Journal of Policy Modeling, 30(2), 271–278. https://doi.org/10.1016/j.jpolmod.2007.04.010
- Apergis, N., & Payne, J. E. (2010). Renewable energy consumption and economic growth: Evidence from a panel of OECD countries. Energy Policy, 38(1), 656–660. https://doi.org/10.1016/j.enpol.2009.09.002
- Aqeel, A., & Butt, M. S. (2001). The relationship between energy consumption and economic growth in Pakistan. Asia-Pacific Development Journal, 8(2), 101–110. https://www.unescap.org/sites/default/files/apdj-8-2-ResNote-1-AQEEL.pdf.
- Belke, A., Dobnik, F., & Dreger, C. (2011). Energy consumption and economic growth: New insights into the cointegration relationship. Energy Economics, 33(5), 782–789. https://doi.org/10.1016/j.eneco.2011.02.005
- Cai, X., Wang, W., Rao, A., Rahim, S., & Zhao, X. (2022). Regional sustainable development and spatial effects from the perspective of renewable energy. Frontiers in Environmental Science, 10 https://doi.org/10.3389/fenvs.2022.859523
- Cleveland, W. S. (1979). Robust locally weighted regression and smoothing scatterplots. Journal of the American Statistical Association, 74(368), 829–836. https://doi.org/10.1080/01621459.1979.10481038
- Dickey, D. A., & Fuller, W. A. (1979). Distribution of the estimators for autoregressive time series with a unit root. Journal of the American Statistical Association, 74(366a), 427–431. https://doi.org/10.1080/01621459.1979.10482531
- Dong, K., Dong, X., Jiang, Q., & Zhao, J. (2021). Assessing energy resilience and its greenhouse effect: A global perspective. Energy Economics, 104, 105659. https://doi.org/10.1016/j.eneco.2021.105659
- Dong, K., Shahbaz, M., & Zhao, J. (2022). How do pollution fees affect environmental quality in China? Energy Policy, 160, 112695. https://doi.org/10.1016/j.enpol.2021.112695
- Fan, Y., Zhang, X., & Zhu, L. (2010). Estimating the macroeconomic costs of CO2 emission reduction in China based on multi-objective programming. Advances in Climate Change Research, 1(1), 27–33. https://doi.org/10.3724/SP.J.1248.2010.00027
- Granger, C. W. J. (1969). Investigating causal relations by econometric models and cross-spectral methods. Econometrica, 37(3), 424. https://doi.org/10.2307/1912791
- Grossman, G. M., & Krueger, A. B. (1995). Economic growth and the environment. Quarterly Journal of Economics, 110(2), 353–377. https://doi.org/10.2307/2118443
- Hondroyiannis, G., Lolos, S., & Papapetrou, E. (2002). Energy consumption and economic growth: Assessing the evidence from Greece. Energy Economics, 24(4), 319–36. https://doi.org/10.1016/S0140-9883(02)00006-3
- Jarque, C. M., & Bera, A. K. (1987). A test for normality of observations and regression residuals. International Statistical Review, 55(2), 163. https://doi.org/10.2307/1403192
- Kaya, Y., & Yokobori, K. (Eds.). (1997). Environment, energy, and economy: Strategies for sustainability. United Nations University Press. https://www.researchgate.net/profile/Gilbert-Ahamer/publication/318589446_Decarbonization-_of_the_World_Representative_Countries_and_Regions/links/5971d7070f7e9b25e8606f35/Decarbonization-of-the-World-Representative-Countries-and-Regions.pdf.
- Khan, M. K., Khan, M. I., & Rehan, M. (2020). The relationship between energy consumption, economic growth and carbon dioxide emissions in Pakistan. Financial Innovation, 6(1), 1–13. https://doi.org/10.1186/s40854-019-0162-0
- Koenker, R., & Bassett, G. jr. (1978). Regression quantiles. Econometrica, 46(1), 33. https://doi.org/10.2307/1913643
- Kongkuah, M., Yao, H., & Yilanci, V. (2021). The relationship between energy consumption, economic growth, and CO2 emissions in China: The role of urbanisation and international trade. Environment, Development and Sustainability, 24, 1–25. https://doi.org/10.1007/s10668-021-01628-1
- Kraft, J., & Kraft, A. (1978). On the relationship between energy and GNP. Journal of Energy and Development, 3, 401–403.
- Lee, C.-C., & Chang, C.-P. (2008). Energy consumption and economic growth in Asian economies: A more comprehensive analysis using panel data. Resource and Energy Economics, 30(1), 50–65. https://doi.org/10.1016/j.reseneeco.2007.03.003
- Li, K., Hu, E., Xu, C., Musah, M., Kong, Y., & Mensah, I. A. (2020). A heterogeneous analysis of the nexus between energy consumption, economic growth and carbon emissions: Evidence from the Group of Twenty (G20) countries. Energy Exploration & Exploitation, 39(3), 815–837. https://doi.org/10.1177/0144598720980198
- Luan, S., Hussain, M., Ali, S., & Rahim, S. (2022). China’s investment in energy industry to neutralize carbon emissions: Evidence from provincial data. Environmental Science and Pollution Research 1–9. https://doi.org/10.1007/s11356-021-18141-7
- Martinho, V. J. P. D. (2016). Energy consumption across European Union farms: Efficiency in terms of farming output and utilized agricultural area. Energy (Oxf), 103, 543–556. https://doi.org/10.1016/j.energy.2016.03.017
- Mehrara, M. (2007). Energy consumption and economic growth: The case of oil exporting countries. Energy Policy, 35(5), 2939–2945. https://doi.org/10.1016/j.enpol.2006.10.018
- Owusu, P. A., & Asumadu-Sarkodie, S. (2016). A review of renewable energy sources, sustainability issues and climate change mitigation. Cogent Engineering, 3(1), 1167990. https://doi.org/10.1080/23311916.2016.1167990
- Ozturk, I., & Acaravci, A. (2010). CO2 emissions, energy consumption and economic growth in Turkey. Renewable and Sustainable Energy Reviews, 14(9), 3220–3225. https://doi.org/10.1016/j.rser.2010.07.005
- Pao, H.-T., & Tsai, C.-M. (2010). CO2 emissions, energy consumption and economic growth in BRIC countries. Energy Policy, 38(12), 7850–7860. https://doi.org/10.1016/j.enpol.2010.08.045
- Qin, L., Hou, Y., Miao, X., Zhang, X., Rahim, S., & Kirikkaleli, D. (2021b). Revisiting financial development and renewable energy electricity role in attaining China's carbon neutrality target. Journal of Environmental Management, 297, 113335. https://doi.org/10.1016/j.jenvman.2021.113335
- Qin, L., Raheem, S., Murshed, M., Miao, X., Khan, Z., & Kirikkaleli, D. (2021a). Does financial inclusion limit carbon dioxide emissions? Analyzing the role of globalization and renewable electricity output. Sustainable Development, 29(6), 1138–1154. https://doi.org/10.1002/sd.2208
- Salari, M., Javid, R. J., & Noghanibehambari, H. (2021). The nexus between CO2 emissions, energy consumption, and economic growth in the U.S. Economic Analysis and Policy, 69, 182–194. https://doi.org/10.1016/j.eap.2020.12.007
- Shahbaz, M., Destek, M. A., Dong, K., & Jiao, Z. (2021). Time-varying impact of financial development on carbon emissions in G-7 countries: Evidence from the long history. Technological Forecasting and Social Change, 171, 120966. https://doi.org/10.1016/j.techfore.2021.120966
- Shahbaz, M., Li, J., Dong, X., & Dong, K. (2022). How financial inclusion affects the collaborative reduction of pollutant and carbon emissions: The case of China. Energy Economics, 107, 105847. https://doi.org/10.1016/j.eneco.2022.105847
- Shahbaz, M., Nasreen, S., Abbas, F., & Anis, O. (2015). Does foreign direct investment impede environmental quality in high-, middle-, and low-income countries? Energy Economics, 51, 275–287. https://doi.org/10.1016/j.eneco.2015.06.014
- Shahzad, U., Radulescu, M., Rahim, S., Isik, C., Yousaf, Z., & Ionescu, S. A. (2021). Do environment-related policy instruments and technologies facilitate renewable energy generation? Exploring the contextual evidence from developed economies. Energies, 14(3), 690. https://doi.org/10.3390/en14030690
- Shahzad, S. J. H., Shahbaz, M., Ferrer, R., & Kumar, R. R. (2017). Tourism-led growth hypothesis in the top ten tourist destinations: New evidence using the quantile-on-quantile approach. Tourism Management, 60, 223–232. https://doi.org/10.1016/j.tourman.2016.12.006
- Sim, N., & Zhou, H. (2015). Oil prices, US stock return, and the dependence between their quantiles. Journal of Banking & Finance, 55, 1–8. https://doi.org/10.1016/j.jbankfin.2015.01.013
- Sohag, K., Begum, R. A., Abdullah, S. M. S., & Jaafar, M. (2015). Dynamics of energy use, technological innovation, economic growth and trade openness in Malaysia. Energy (Oxf), 90, 1497–1507. https://doi.org/10.1016/j.energy.2015.06.101
- Soytas, U., & Sari, R. (2009). Energy consumption, economic growth, and carbon emissions: Challenges faced by an EU candidate member. Ecological Economics, 68(6), 1667–1675. https://doi.org/10.1016/j.ecolecon.2007.06.014
- Soytas, U., Sari, R., & Ewing, B. T. (2007). Energy consumption, income, and carbon emissions in the United States. Ecological Economics, 62(3–4), 482–489. https://doi.org/10.1016/j.ecolecon.2006.07.009
- Stern, N., & Stern, N. H. (2007). The economics of climate change: The Stern review. Cambridge University Press.
- Stone, C. J. (1977). Consistent nonparametric regression. Annals of Statistics, 5, 595–620. https://doi.org/10.1214/aos/1176343886
- Tang, C. F., Tan, B. W., & Ozturk, I. (2016). Energy consumption and economic growth in Vietnam. Renewable & Sustainable Energy Reviews, 54, 1506–1514. https://doi.org/10.1016/j.rser.2015.10.083
- U.S. Energy Information Administration. (2019). Energy Information Administration Country Analysis Executive Summary: China. https://www.eia.gov/international/content/analysis/countries_long/Canada/canada_CAXS.pdf.
- US-EPA. (2019). The United States Environmental Protection Agency. https://www.epa.gov/ghgemissions/sources-greenhouse-gas-emissions
- Wen, J., Mughal, N., Zhao, J., Shabbir, M. S., Niedbała, G., Jain, V., & Anwar, A. (2021). Does globalization matter for environmental degradation? Nexus among energy consumption, economic growth, and carbon dioxide emission. Energy Policy, 153, 112230. https://doi.org/10.1016/j.enpol.2021.112230
- Wolde-Rufael, Y. (2009). Energy consumption and economic growth: The experience of African countries revisited. Energy Econ, 31(2), 217–224. https://doi.org/10.1016/j.eneco.2008.11.005
- World Bank. (2022). World Development Indicators. Retrieved from https://databank.worldbank.org/source/world-development-indicators
- Xu, B., Sharif, A., Shahbaz, M., & Dong, K. (2021). Have electric vehicles effectively addressed CO2 emissions? Analysis of eight leading countries using quantile-on-quantile regression approach. Sustain Prod Consum, 27, 1205–1214. https://doi.org/10.1016/j.spc.2021.03.002
- Yu, E. S. H., & Hwang, B.-K. (1984). The relationship between energy and GNP. Energy Economics, 6(3), 186–190. https://doi.org/10.1016/0140-9883(84)90015-X
- Zafar, M. W., Saleem, M. M., Destek, M. A., & Caglar, A. E. (2021). The dynamic linkage between remittances, export diversification, education, renewable energy consumption, economic growth, and CO2 emissions in top remittance‐receiving countries. Sustainable Development, 30(1), 165–175. https://doi.org/10.1002/sd.2236
- Zhang, X.-P., & Cheng, X.-M. (2009). Energy consumption, carbon emissions, and economic growth in China. Energy Economics, 68(10), 2706–2712. https://doi.org/10.1016/j.ecolecon.2009.05.011
- Zhang, J., & Zhang, Y. (2021). Tourism, economic growth, energy consumption, and CO2 emissions in China. Tourism Economics, 27(5), 1060–1080. https://doi.org/10.1177/1354816620918458
- Zhao, M., Lü, L., Zhang, B., & Luo, H. (2021). Dynamic relationship among energy consumption, economic growth and carbon emissions in China. Research of Environmental Sciences, 34(06), 1509–1522. https://doi.org/10.13198/j.issn.1001-6929.2020.12.20.
- Zhao, J., Shahbaz, M., Dong, X., & Dong, K. (2021). How does financial risk affect global CO2 emissions? The role of technological innovation. Technological Forecasting and Social Change, 168, 120751. https://doi.org/10.1016/j.techfore.2021.120751