
 ?Mathematical formulae have been encoded as MathML and are displayed in this HTML version using MathJax in order to improve their display. Uncheck the box to turn MathJax off. This feature requires Javascript. Click on a formula to zoom.
Abstract
In tandem with global initiatives to ‘go green’, China is undertaking a series of steps to achieve green economic growth. To investigate the dynamic nexus of green growth, green trade, and green energy (3 G) in China, an index is developed in this study to assess the level of provincial green growth by employing five types of indicators – economic growth, environmental pollution loss, carbon emissions loss, natural resource loss, and environmental and natural resource benefits. Then, this paper uses the SYS-GMM method to explore the influences of green trade and green energy on green growth by using data compiled from 30 provinces in China over the period 2007–2016. Furthermore, we check the potential heterogeneity, asymmetry, and internal mediating mechanism of the 3 G nexus. The main findings are highlighted as follows: (1) Green trade and green energy can accelerate China’s green growth; (2) enhancing medium- and high-technology green trade can contribute to improving local green growth; (3) this impact is heterogeneous in regions with different trade levels, and asymmetric at various quantiles for the full panel; (4) the positive investment effect, labour effect, and technical effect are effective mediators of the nexus between green trade and green growth.
1. Introduction
Many countries have experienced remarkable economic growth since the second industrial revolution (Panagiotis et al., Citation2017; Wang et al., Citation2022). In recent years, China’s rapid economic growth is driven by domestic industrialisation expansion, which relies heavily on burning fossil fuels such as coal (Duan & Yan, Citation2021; Li et al., Citation2021a; Citation2022). China has seen a marked increase in its total energy consumption over the last five years (Song et al., Citation2022; Zhu et al., Citation2022). This kind of industrial and energy structure poses challenges relating to the depletion of natural resources and degradation of the environment (Dong et al., Citation2021; Jiang et al., Citation2020; Ren et al., Citation2022a). How to balance economic development and environmental issues is an essential problem in China. Green growth refers mainly to the promotion of economic growth under conditions that ensure natural resources and environments can provide services that enhance citizens’ well-being and achieve sustainable development without harming the environment and natural resources (Hallegatte et al., Citation2012; Hallegatte & Corfee-Morlot, Citation2011; Li et al., Citation2021b). During COP26 held in November 2021, many countries pledged to achieve global net-zero emissions by the middle of the current century and limit the global rise in temperatures to 1.5 degrees by 2030. With the strong international effort to achieve these goals, countries all over the world have taken up the challenge to accelerate the reduction of carbon emissions and develop green growth (Ren et al., Citation2021, Citation2022b; Shahbaz et al., Citation2022). China is undertaking a series of steps to collaboratively achieve green growth in tandem with global initiatives to ‘go green’ (Liu et al., Citation2018, Citation2021a; Zhao et al., Citation2021).
There is a global search for green, sustainable, and economically attractive solutions. Studies on green growth are numerous, but no universally standard for measuring green growth exists. Therefore, a more comprehensive evaluation of China’s green growth and a clear understanding of China’s current situation is extremely important. On the one hand, emerging green product technologies have changed the development trajectory of domestic enterprises, leading to improved quality and efficiency of traded products, enabling them to be more competitive in international markets. The production and use processes of green products always require less energy and produce fewer emissions, and thus, are more environmentally friendly (Sun et al., Citation2021). Although it is widely accepted that international trade can promote national economic growth (Brini et al., Citation2017; Gokmenoglu et al., Citation2015; Rahman, Citation2021), the relationship between trade in green products and a green economy has not been studied. On the other hand, the transformation towards green energy is considered to be a good solution to the problem of fossil energy depletion and environmental degradation, and therefore attracts worldwide attention (Jiang et al., Citation2020; Liu et al., Citation2021b; Qin et al., Citation2022). Green energy refers to the clean energy generated from natural resources available all over the world, and includes hydro, wind, solar, biomass, and other sources of energy (Bhowmik et al., Citation2017; Dong et al., Citation2018; Troster et al., Citation2018). Since 2006, China has begun to implement a subsidy policy based on electricity prices for renewable energy power generation to accelerate the development of renewable energy. After 2012, subsidies are allocated out of government-managed funds. The 13th Five-Year Plan (2016–2020) in China emphasises the importance of developing green energy in the national energy structure. Furthermore, green energy is regarded as the energy source that can promote sustainable economic development due to its low carbon emissions (Apergis & Payne, Citation2010; Sadorsky, Citation2009; Sohag et al., Citation2019). While literature that focuses on the dynamic nexus among green trade, green energy, and green growth in China is scarce.
This paper first aims to evaluate the green growth in 30 provinces in China between 2007 and 2016. Based on the SYS-GMM method, this paper explores the nexus of green growth, green trade, and green energy (3 G). Furthermore, this study checks the potential heterogeneity, asymmetry, and internal mediation impact mechanism of the 3 G nexus. The study makes three important contributions to the literature: (1) We provide a new and reliable method for assessing provincial green growth. This is pretty important for comprehensively understanding the variation of green growth, green trade, and green energy nexus. (2) This paper is the first attempt to explore the dynamic 3 G nexus in China. Accordingly, this can benefit policymakers in China not only by helping them devise policies to accelerate local green growth, but also by helping them rationally adjust the energy structure and international trade structure. (3) this paper explores the potential heterogeneity and asymmetry of the impacts of green trade and green energy on green growth. We further check the internal mediation impact mechanism (i.e., investment, labour, and technical effects) of the impacts of green trade on green growth. This will not only facilitate an understanding of the differences in the technical levels of products and the provinces and the 3 G nexus, but will also provide local governments with new evidence to formulate specific policies to improve green growth, green trade, and green energy simultaneously.
Below is a summary of the rest of the study. Section 2 presents a review of the literature. Section 3 assesses the indicators of green growth. The model and data sources are described in Section 4. Section 5 shows the benchmark regression and the heterogeneous analysis. Section 6 presents further discussions, including asymmetric analysis and mediation analysis. Section 7 outlines the policy implications and conclusions.
2. Literature review
2.1. Green growth
Since green growth gain increasing attention over the past few years, many scholars focus on identifying actual and concrete green growth. Some studies analyse green growth from the perspective of production efficiency (Lin et al., Citation2013; Lin & Zhou, Citation2021; Wu et al., Citation2020; Xie et al., Citation2018; Zhao et al., Citation2021; Zhu et al., Citation2020). Most of them argue that green growth reduces unexpected output while improving desirable output. For instance, Zhao et al. (Citation2020) employ a super-SBM model to measure green economic efficiency in China. Some scholars also take green GDP as representative of the green economy (Li & Fang, Citation2014; Talberth & Bohara, Citation2006), which deducts environmental costs from traditional GDP (Kunanuntakij et al., Citation2017).
As for the concept of green growth and the factors considered in the existing literature, the core concept of green growth, according to Jacobs (Citation2012), is economic development through environmental protection. Furthermore, Green growth should be measured in terms of economic growth, job creation, and environmental improvement, according to Reilly (Citation2012). Jouvet and Perthuis (Citation2013) provide a stricter concept of green growth – green growth involves altering production and consumption processes to maintain or restore these regulatory functions of natural resources capital. Sohag et al. (Citation2019) propose a method for green growth and use it to measure green growth in Turkey. Specifically, green growth is defined as sustainable economic growth after deducting the damage caused by natural resource exploitation and greenhouse gas. Lin and Zhou (Citation2021) also consider carbon emissions intensity when constructing a comprehensive indicator system of green growth in China. Besides, they propose that water pollution, air pollution, and green space are also important indicators that need to be considered (Lin & Zhou, Citation2021).
2.2. Green growth-trade-energy (3 G) nexus
The second part focuses mainly on the nexus of 3 G. A focus of trade research has always been the nexus of trade and economic growth. Explanations among the existing studies of the mediation channels from international trade on economic growth include three main aspects: (1) The foreign exchange income brought by export trade and fixed assets formed by importing advanced equipment accelerate capital accumulation, thereby promoting economic growth (Jones & Manuelli, Citation1990); (2) the human capital accumulation effect of trade can improve the human capital of trading countries and enhance the absorption capacity of foreign advanced technology, therefore improving economic growth (Grossman & Helpman, Citation1991; Young, Citation1991); (3) trade will lead to a technology spill-over effect through imitation and other behaviours to improve the technological levels of importing countries, thereby promoting economic growth (Grossman & Helpman, Citation1991).
Another focus of this paper is the influence of green energy on green growth. Sources of green energy include hydro, wind, solar, and biomass. Political, economic, social, and technological factors jointly influence the development of green energy (Biresselioglu et al., Citation2018; Wüstenhagen et al., Citation2007). Green energy is regarded as the energy source that can promote sustainable economic development because it has zero or very little carbon emissions in the energy-production process (Sohag et al., Citation2019). Furthermore, some scholars suggest that increasing the production of green energy can reduce pressure on the regional balance of payments, increase income per capita, and achieve sustainable economic growth (Apergis & Payne, Citation2010; Sadorsky, Citation2009). Besides, the development of green energy is impervious to the geopolitical risks of fossil energy exporters and the depletion of local natural resources, which can ensure global energy security and is a suitable solution for achieving carbon neutrality (Elliot, Citation2007; Ferguson, Citation2007; Menegaki, Citation2011; Sohag et al., Citation2019).
2.3. Literature gaps
Despite the extensive literature on green growth, there is no universally agreed standard for measuring green growth. Therefore, a more comprehensive evaluation of China’s green growth and a clear understanding of China’s current situation is extremely important. Besides, it is important to consider the development trend and distribution of green growth. As far as we know, few scholars have measured the level of provincial green trade in China, and studies that focus on the nexus of green trade and green growth are scarce. Despite the fact that some researchers focus on the nexus between sustainable economic development and green energy, the literature on the 3 G nexus is rather scanty. Additionally, the regional heterogeneous, symmetric, and internal mediation impact mechanism of the 3 G nexus is conducive to making policies that take regional differences into consideration. Accordingly, this study proposes two hypotheses as follows.
Hypothesis 1: Green trade and green energy can accelerate green growth.
Hypothesis 2: The indirect influences of green trade on green growth mainly through the investment effect, labour effect, and technical effect.
3. Assessing green growth in China
The goals of green growth include two aspects: developing the economic level and improving environmental quality (Jouvet & Perthuis, Citation2013; Song et al., Citation2019). Given that there is no uniform standard in the existing literature for measuring green growth, China’s green growth is measured in this study by combining the methodology of some scholars and global organisations. In general, green growth (GGR) includes five types of indicators: economic growth (GDP), environmental pollution loss (VEP), carbon emissions loss (VCE), natural resource loss (VNR), and environmental and natural resource benefits (EBE). The definition of GGR is as follows:
(1)
(1)
Environmental pollution loss
The value of environmental pollution loss usually includes two aspects: the monetary value of air pollution emissions loss and water pollution emissions loss. The loss values per unit of air and water pollution emissions can be represented by pollution discharge fees. The monetary value of environmental pollution loss (VEP) is obtained as follows:
(2)
2. Carbon emissions loss
The monetary value of carbon emissions loss (VCE) accounting is obtained as follows:
where CO2 denotes the amount of carbon emissions, γ represents the exchange rate, and P3 is the carbon taxes rate. Europe is one of the most mature parts of the world for the carbon taxes mechanism. Considering the current situation of carbon emissions reduction stress in China, this study chooses the carbon taxes rate of Sweden (i.e., the price per unit of CO2 emissions adopted 139 USD/tons in 2018), which is relatively higher in the existing global carbon taxes rate, as P3 (World Bank, Citation2018). The carbon taxes rate is converted into RMB according to the average annual exchange rate of the USD. The data on CO2 emissions is obtained from CEAD (Citation2018).
3. Natural resource depletion loss
The value of natural resource depletion loss (VNR) accounting usually includes two aspects: the monetary value of water resource depletion loss (WRD) and energy resource depletion loss (ERD), and can be defined as follows:
where WPR denotes the price of water, and TWC indicates total water consumption. WPR is estimated in an internationally accepted method – OVW is the output value in the water industry, which is roughly evaluated by provincial GDP due to data limitations. WRE indicates the total amount of water resources, α denotes the willingness of consumers to pay for water consumption. This coefficient is recommended to be 1% − 3%, due to the water shortage China is currently facing, and α is assumed to be 3% in this study (Song et al., Citation2019). The value of TWC is obtained through the expression
Besides, WCP is the water consumption per capita, and RPO denotes the resident population. Furthermore, TEC is total energy consumption, and PER denotes the price of the energy resource (i.e., 1,133 RMB/ton of standard coal). The original data of OVW, WRE, WCP, RPO, and TEC used in this study are obtained from the CSY (Citation2020).
4. Environmental and natural resource benefits
The value of environmental and natural resource benefits can be classified into four aspects in this study: the value of SO2 absorbed (VSA), dust removal (VDR), carbon sequestration (VCS), and investment in industrial pollution control (IPC). Following Song et al. (Citation2019), the industrial SO2 absorption cost, dust removal cost, and carbon sequestration cost of green space are used to replace the economic value of VSA, VDR, and VCS, respectively. The ENB can be calculated as follows:
where GSA represents green space area, φ denotes the annual average SO2 absorbed capacity of urban green space (i.e., 0.296 ton/hm2), η is the unit reduction cost of the SO2 absorption amount (i.e., 600 RMB/ton), β denotes the annual dust capacity of green space (i.e., 10.9 ton/hm2), δ is the dust removal cost (i.e., 170 RMB/ton), γ represents the exchange rate, and P3 is the carbon taxes rate. The data of GSA and IPC are derived from the CSY (Citation2020).
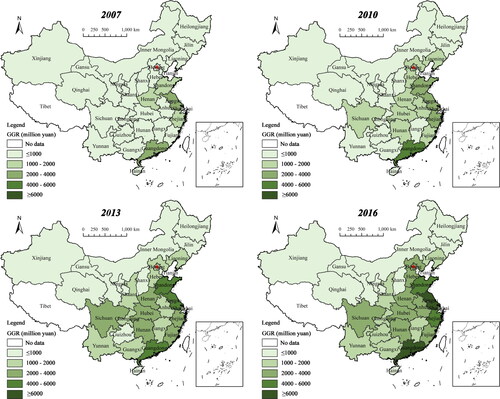
shows the green growth calculated in this study. From this figure, one can see that the green growth index in southern China presents a significant strengthening trend from 2007 to 2016. The provinces with high GGR are mainly located in the southeastern coastal areas; and the provinces with low GGR are in the northwest areas. For instance, Jiangsu, Guangdong, Zhejiang, and Shandong have experienced high green growth in the past decade. Furthermore, in the northwest regions, such as Gansu, Qinghai, Ningxia, and Xinjiang, a lower level of green growth is found. The main reason for this phenomenon may be the relatively lower level of economic development.
Figure 1. Spatial distribution of GGR for selected years.
Source: Self-Calculated following Section 3.
4. Models and data
4.1. Empirical model
To explore the influences of green trade and green energy on GGR in China, this study takes green trade and green energy as the core explanatory variables, and green growth as the explained variable. Furthermore, this study introduces control variables, including financial development, urbanisation rate, energy structure, and industrial structure upgrading. The dynamic multivariate framework can be defined as follows in this study:
(6)
(6)
where i and t represent the provinces and years, respectively. GGR denotes green growth, GTR is green trade, GEN denotes green energy, FD represents financial development, UR is urbanisation rate, ES represents energy structure, and ISU denotes industrial structure upgrading. To avoid fluctuations in the data and eliminate potential heteroscedasticity, all the variables are logarithmically processed. Therefore, the model can be defined as follows:
(7)
(7)
where
is the intercept term,
-
are the coefficients of each variable, and X refers to control variables (i.e., FD, UR, ES, and ISU).
4.2. Data
To quantitatively analyse the influence of GTR and GEN on GGR, balanced panel data covering 30 provinces in China (i.e., due to data availability, Tibet, Hong Kong, Macau, and Taiwan are excluded) from 2007 to 2016 is employed for empirical analysis in this study. The reason for us to use the study period is that the earliest year for one of the essential indicators of green growth is 2007; and the latest year for the data of green trade, specifically, the CCIED (Citation2017) is 2016. As the dependent variable, the indexes of green growth (GGR) are from Section 3. Furthermore, the indexes of green trade (GTR), green energy (GEN), and control variables are measured as follows.
Green trade (GTR): A forthcoming study combines the lists of green products of four organisations (i.e., APEC, Citation2012, UNESCAP, Citation2011, ICTSD, Citation2017, World Bank, Citation2008) to produce a list of 142 green products. The original trade data of trade value are derived from CCIED (Citation2017). GTR can be defined as follows:
IMG and EXG are the green import and export value, imp and exp are the trade value of each product p in firm f and province i. Furthermore, following Lall (Citation2000), the products are divided into the resource-based and low-technology (LGT), medium-technology (MGT), and high-technology (HGT) level green trade based on the technical level.
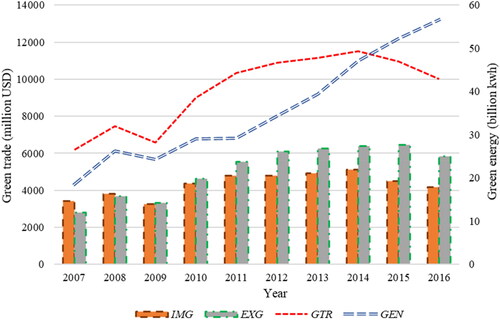
Green energy (GEN): This paper uses the green energy index mainly to measure the level of provincial renewable energy development. Electricity generated from renewable energy is better for the environment than traditional thermal power, which is generated by burning fossil fuels. Following the work of Wang et al. (Citation2021) and Destek and Aslan (Citation2017), the green energy index can be measured by power generation other than thermal power. The data can be derived from the CSY (Citation2020). This paper further draws the maps of GTR and GEN indexes (see ) and China’s average GTR, GEN, IMG, and EXG (see ). As can be seen from , the green trade value in the eastern region is relatively high, while the green energy development level in the western region is high. From , one can see that China’s average green energy is growing rapidly during the study period; after a short decline in 2008, average green trade began to rise rapidly from 2009 to 2014, and began to decline for the second time in 2014.
Figure 2. Spatial distribution of GTR and GEN for selected years.
Source: Self-Calculated according to CCIED (2017) and CSY (2020).
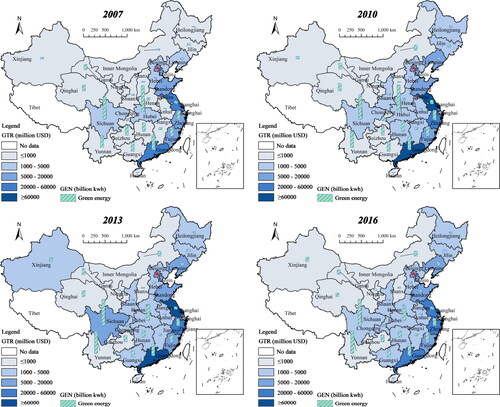
Figure 3. Average GTR, GEN, IMG, and EXG of China.
Source: Self-Calculated according to CCIED (2017) and CSY (2020).
Control variables: FD is measured by the added value of financial industry, UR denotes the ratio of the urban to total population, ES represents the ratio of coal to total energy consumption, and ISU is the ratio of the added value in tertiary to secondary industry. The data on FD, UR, UR, and ISU are from the CSY (Citation2020). Furthermore, the original data of IMG, EXG, LGT, MGT, and HGT are from the CCIED (Citation2017). The data of investment effect (INE), labour effect (LAE), and technical effect (TEE) are from the CSY (Citation2020). shows the interpretation and descriptive statistics for variables.
Table 1. Descriptive statistics of the variables.
5. Results and discussions
5.1. Cross-sectional dependence tests
The Pesaran CD test (Pesaran, Citation2004), and the Frees test (Frees, Citation2004) are employed in this study to examine the cross-sectional dependence (see for the test results). In the null hypothesis, panel data are not cross-sectional dependent. One can see that the p-values of the tests in are significant, which shows that cross-sectional dependence must be considered; otherwise, it may result in inconsistent estimates.
Table 2. Results of the cross-sectional dependence tests.
5.2. Benchmark regression
This paper employs the SYS-GMM method as the benchmark regression to investigate the impacts of green trade and green energy on green growth (Arellano & Bover, Citation1995). A dynamic panel data estimation method based on SYS-GMM is appropriate for large cross-sectional dependence and short periods. Furthermore, due to that the influencing factors of the green economy are complex in reality, the endogeneity caused by omitted explanatory variables will destroy the consistency of parameter estimation. To a certain extent, this method can also solve estimation bias caused by potential endogeneity. Two static panel data estimation methods, including the FE and RE methods, are also used in this paper to ensure that the benchmark regression results are robust (see Columns (1) and (2) of ). This study employs green imports (IMG) and green exports (EXG) to replace green trade (GTR) to further ensure the robustness of the results; the results are displayed in Columns (3) and (4), respectively. The benchmark regression results are in Column (5) of . The results in show that our empirical results are robust.
Table 3. Results of the GTR, GEN, and GGR nexus.
One can see from the bottom of Columns (3) – (5) of , the p-value of the AR (1) is lower than 0.1, and that of the AR (2) is higher than 0.1. These results of A-B tests show that the premise for using the SYS-GMM model is met. Furthermore, the p-value of Sargan tests is higher than 0.1, which indicates that all the instrumental variables are effective. For one of the key independent variables, green trade, the estimated coefficient of GTR is positive, which shows that green trade is positively related to green growth. A 1% increase in green trade can promote 0.0569% green growth approximately. Furthermore, combining the estimation results with Columns (3) and (4), one can see that increased green imports and green exports can significantly improve local green growth. For another one of the key independent variables, the gradual increase of green energy (GEN) can significantly improve green growth. To be more specific, a 1% increase in green energy can promote green growth by approximately 0.019%. Furthermore, the finding of the benchmark regression confirms the first hypotheses. In terms of FD, UR, ES, and ISU, both FD and UR have a positive impact on green growth, while both the increased ES and ISU will lead to a decline in green growth.
5.3. Heterogeneous analysis
5.3.1. Products’ heterogeneous analysis
In this section, green trade is divided into three types (LGT, MGT, and HGT). This study empirically explores the heterogeneity of the products in terms of the influence of GTR on GGR (see ). The results of A-B and the Sargan tests are all as expected, which indicates that the SYS-GMM method is suitable for the regression, and all instrumental variables are effective.
Table 4. Results of the products’ heterogeneous analysis.
One can see from that the improvement of LGT has no significant impact on green growth, while the increased MGT and HGT can contribute to green growth in China. A 1% increase in MGT can result in a 0.0540% increase in green growth, and a 1% increase in HGT can improve green growth by 0.0579%. From these results, we can conclude that upgrading the trade structure and increasing the MGT and HGT can significantly improve the promotion effect of GTR on GGR. Besides, the signs and significance of the results of green energy, financial development, urbanisation rate, energy structure, and industrial structure upgrading are all consistent with that in the benchmark regression, which also proves the robustness of the benchmark regression.
5.3.2. Regional heterogeneous analysis
From , one can see that significant differences exist in green trade and green energy among the regions in China. This paper further explores the regional heterogeneous influences of green trade and green energy on green growth. The sample is divided into four regions based on the levels of green trade and green energy. Region I refers to regions whose green trade and green energy are higher than the median level (i.e., high GTR and high GEN); Region II refers to regions in which green trade is lower than the median level and green energy is higher than the median level (i.e., low GTR and high GEN); Region III refers to regions in which green trade and green energy are both lower than the median level (i.e., low GTR and low GEN); Region IV refers to regions in which green trade is higher than the median level and green energy is lower than the median level (i.e., high GTR and low GEN). As can be seen from the division results in , the results of regional heterogeneous analysis based on the FE method are shown in .
Figure 4. Regional division based on GTR and GEN.
Source: Self-Calculated.
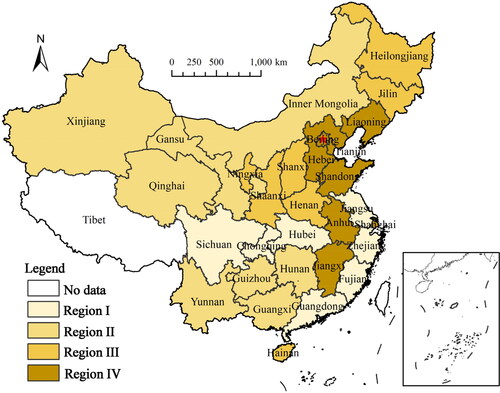
Table 5. Results of the regional heterogeneous analysis.
shows that a significant positive impact exists between GTR and GGR in the high-GEN regions (i.e., Region I and II), while in the low-GEN regions, the impact of green trade is insignificant. Specifically, a 1% increase in GTR can significantly improve GGR in Regions I and II, by 0.152% and 0.0637%, respectively. From the results, we can conclude that increased GTR plays an essential role in GGR in regions with high levels of green energy development. Positive impact of GTR on GGR is greatest in Region I, which also indicates that green trade in Region I needs to be improved. Furthermore, shows that the impact of GEN on GGR is statistically significant in Regions II, III, and IV; while it is insignificant in Region I. Specifically, the estimated coefficients of GEN on GGR are 0.0817, 0.119, and 0.0267 in Regions II, III, and IV, respectively. Combining the results of regional heterogeneous analysis, in regions with higher levels of GEN, it is more effective to improve green products production and enhance the GTR; in Regions II, III, and IV, it is essential to accelerate the local green energy industry development to improve GGR. As for the control variables, it is worth noting that increased financial development in all four regions has a positive influence on local green growth, especially in regions with a lower level of green energy development (i.e., Regions III & IV). This may be due to improved financial markets favouring the financing capacity of emerging, environmentally friendly companies. Furthermore, the urbanisation rate has a negative impact on GGR in Region IV (e.g., Hebei and Shandong), which indicates that the improved urbanisation rate is not conducive to GGR in regions with relatively high green trade and low green energy. These results further show that the sufficient development of green energy is the key to regional green growth.
5.4. Discussions
Based on the benchmark regression results, it is emphasised that green trade refers to trade in technologies and products that are environment-friendly and resource-saving in the process of production and utilisation. Therefore, the growth of green trade is conducive to fewer emissions and less consumption of resources, which results in green economic growth. The positive nexus between green trade and green growth in this study is consistent with the findings of Talebzadehhosseini and Garibay (Citation2022), who conclude that the increase of green products contributes to the overall green growth performance of the country. The results in this study also indicate that increased green energy development can significantly promote China’s green growth, which can promote macroeconomic growth, the green transition of energy consumption structure, and considerable environmental synergy benefits. Similar conclusions can be found in Sohag et al. (Citation2019) and Dai et al. (Citation2016). Furthermore, the positive nexus between financial development in this study shows that the improvement in financial development benefits the financing environment for emerging enterprises. To be more specific, financial constraints serve as a major barrier to some companies and citizens using cleaner energy, and thus is not conducive to regional green economic development among such citizens (Baulch et al., Citation2018). Besides, this study concludes that energy consumption structure dominated by coal will exacerbate pollution emissions and the greenhouse effect in China, thereby hindering green growth.
As for the estimation results of heterogeneous analysis, one can see that MGT and HGT can accelerate green growth in China, and the impacts of GTR and GEN on GGR are heterogeneous in regions with different levels of green trade and green energy. Higher technological green products have also been shown to be more energy efficient and emit fewer emissions than traditional products. As can be seen from and , China’s green trade and green energy have achieved unprecedented performance in recent years, especially in the southeastern coastal regions. However, the level of development of green trade and green energy in northwest China is relatively lower due to the uneven regional distribution of technological levels and financing levels in the country. This situation not only hinders the improvement of the economy’s green and sustainable development, but also restricts the coordinated development of the 3Gs (i.e., green growth, green trade, and green energy) in China. According to the existing literature, environmental regulation plays a significant role in promoting the development of green energy, improving green product innovation, and accelerating green growth (Song et al., Citation2020; Wang & Shao, Citation2019; Zhao et al., Citation2022).
6. Further discussion
6.1. Asymmetric analysis
This paper employs the quantile regression approach to further explore the asymmetric characteristics of the impact of GTR and GEN on GGR in China. The results of which are reported in and .
Figure 5. Coefficients of quantile regression.
Notes: The conditional quantiles of GGR is shown in the x-axis; various variables are shown by the y-axis.
Source: Self-Calculated.
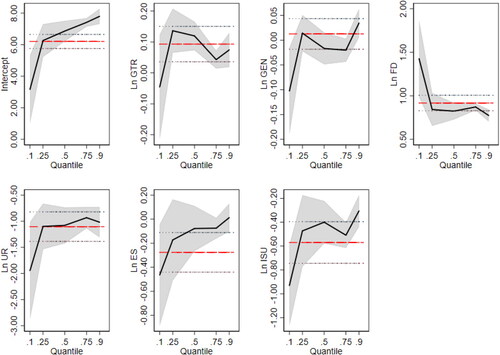
Table 6. Results of the quantile regression.
From and , one can see that the impacts of financial development, urbanisation rate, and industrial structure upgrading on green growth are consistent, while green trade, green energy, and energy structure affect green growth asymmetrically. Specifically, at the 10th quantile, GTR has no significant impact on GGR. The positive influence of GEN on GGR exists at the 90th quantile. In terms of the control variables, the influence of FD on GGR is statistically significant both in the regions with high and low green growth, which reflects the universality of financial development. It is also worth noting that the positive influence of FD on GGR is greatest in regions with low levels of green growth, which also indicates that the financial development of these regions needs to be improved. Besides, the significant influence of energy structure on green growth exists only at the 10th and 75th quantiles, and the elastic coefficient at the 10th quantile is much higher than that at the 75th quantile. There is an urgent need to promote energy transition in regions with low green growth, such as Qinghai, Gansu, and Ningxia. In addition, regions with low green growth are not suitable for vigorously developing green trade and the green energy industry, but can focus on improving the level of financial development and upgrading the energy structure, thereby improving local green growth. The main possible reason is that local green growth may be restricted by the relatively backward level of economic development and financing environment and energy consumption habits, and the fact that equipment cannot be easily changed. As the financial environment improves, residents and enterprises are able to replace equipment such as coal-fired boilers with green energy.
6.2. Mediating mechanism
6.2.1. Approach
The impact of GEN on GGR is relatively intuitive, while the indirect influence of GTR on GGR is worth discussing. Furthermore, this paper uses a mediation analysis approach based on SYS-GMM to empirically investigate the mediation impact mechanism between GTR and GGR. Following the literature review in Section 2.2, this paper proposes the indirect impact of GTR on GGR mainly through the following three effects: the investment effect (Jones & Manuelli, Citation1990), labour effect (Grossman & Helpman, Citation1991; Young, Citation1991), and technical effect (Grossman & Helpman, Citation1991). The identifying assumption functions are defined as follows:
(9)
(9)
(10)
(10)
(11)
(11)
(12)
(12)
where GGR denotes green growth, GTR is green trade, GEN represents green energy, X is the control variables (i.e., FD, UR, ES, and ISU). M denotes the mediating variables, including investment effect (INE), measured by the registered capital of foreign-invested enterprises, labour effect (LAE), measured by the number of undergraduate graduates in institutions of higher learning, and technical effect (TEE), measured by the number of local patents granted. α2 denotes the total effects (Baron and Kenny, Citation1986), α5 is the direct effect of GTR on GGR, and
denotes the indirect effect (mediation effect) of each mediator (i.e., M) if
and
are statistically significant. Furthermore, MER is the mediation effect ratio.
6.2.2. Results of mediating analysis
The regression results based on Eqs. (9) – (11) are shown in . This table can serve as a basis for drawing several conclusions.
Table 7. Results of the mechanism analysis.
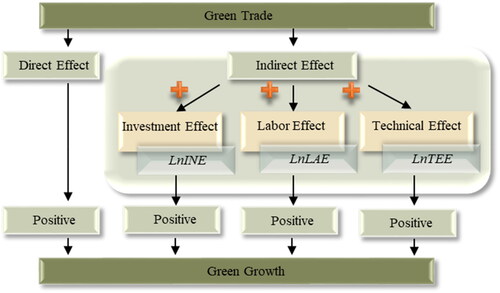
First, one can see from Columns (2) – (4) that the estimated elastics of GTR on INE, LAE, and TEE are all positive and statistically significant, which shows that increased green trade can significantly promote investment, labour capital, and technology development. A 1% increase in the GTR can improve foreign investment by 0.0115%, improve highly educated labour capital by 0.0148%, and improve technological development by 0.0873%. Second, Column (5) shows that the results of INE, LAE, and TEE on GGR are all positive (i.e., 0.115, 0.199, and 0.0346, respectively). These results show that improving foreign investment, highly educated labour capital, and technology development are all effective methods for increasing green growth. Third, combining the estimation results with Eq. (12), the mediation effect ratios of INE, LAE, and TEE are 2.3%, 5.2%, and 5.3%, respectively. These results indicate that the investment effect, labour effect, and technical effect are all positive and effective mediators between green trade and green growth. To be more specific, the increased trade value of green products can improve green growth by increasing local foreign investment, highly educated labour capital, and technology development. This conclusion is consistent with the second hypothesis. According to the above mediation effect analysis, the specific mediation impact mechanism is shown in .
Figure 6. Mediating mechanism of GTR on GGR.
Source: Self-Calculated.
7. Conclusions and policy implications
7.1. Conclusions
To empirically investigate the 3 G nexus in China, this paper measures provincial green growth by employing five types of indicators – economic growth, environmental pollution loss, carbon emissions loss, natural resource loss, and environmental and natural resource benefits. A balanced panel dataset covering 30 provinces in China is used for analysis. Furthermore, we discuss the heterogeneity of products and regions, asymmetry, and the mediation impact mechanism in the 3 G nexus. This paper reaches the following major conclusions:
(1) The benchmark regression results indicate that green trade and green energy can significantly accelerate green growth in China. Furthermore, the products’ heterogeneous analysis shows that increasing MGT and HGT can contribute to green growth. The regional heterogeneous analysis indicates that a significant positive impact exists between GTR and GGR in the regions with a high level of green energy development (i.e., Region I and II); and the positive impacts of green energy on green growth are statistically significant in Regions II, III, and IV. (2) Influences of green trade, green energy, and energy structure on green growth differ across quantiles, which shows the symmetricity; while the impacts of financial development, urbanisation rate, and industrial structure upgrading on green growth are consistent. (3) The mediating analysis indicates that the investment effect, labour effect, and technical effect are positive mediators of the nexus between GTR and GGR. Specifically, the increased trade value of green products can improve green growth by increasing foreign investment, highly educated labour capital, and technology development.
7.2. Policy implications and limitations
Following are the policy implications of this study. (1) China should increase its support for green trade and green energy development, thereby effectively achieving green growth. Improving financial development, increasing the urbanisation rate, and reducing coal’s share of total energy consumption are also essential for the improvement of green growth and the achievement of sustainable development. (2) China needs to increase input in scientific and technological innovation, actively promote the implementation of green technology innovation achievements, thereby improving the production efficiency of products and raising the technological level in the trade products. Furthermore, to improve green economic growth, Chinese governments must develop differentiated policies according to conditions. For instance, provinces in Regions II, III, and IV can make full use of their advantages and vigorously develop the renewable energy industry, thereby enhancing the positive impacts of green energy on green growth. (3) Given that the positive investment effect, labour effect, and technology effect are the effective mediators between green trade and green growth, governments can accelerate the green economic growth in China through improving investment, talent introduction policy, and the technological innovation subsidy. For instance, efforts must be made to improve the local financial development and accelerate green energy transition by subsidising the replacement of energy-intensive household equipment with energy-efficient equipment. This will improve the financing level and energy consumption habits of households and small businesses, thus making them more conducive to achieving green growth.
The paper still has several shortcomings. First, the index of green trade is measured by the provincial trade value of green products in this study. In future research, the diversity of green products and the diversification of trade cooperation countries can be taken into account, and formulate a comprehensive index of green trade to comprehensively measure the relationship between green trade and green growth. Second, this study only employs three dimensions of investment, labour, and technical effects in exploring the internal mediation impact mechanism. A more in-depth analysis can be carried out by investigating the mediation mechanism of the impacts of green trade on green growth from more dimensions. More importantly, the spatial spill-over effects of green trade and green energy on green growth can be further investigated.
Acknowledgements
The authors gratefully acknowledge the helpful reviews and comments from the editors and anonymous reviewers, which improved this manuscript considerably. Certainly, all remaining errors are our own.
Disclosure statement
No potential conflict of interest was reported by the authors.
Data availability statement
The data that support the findings of this study are available from the corresponding author upon reasonable request.
Additional information
Funding
References
- APEC. (2012). Asia-pacific economic cooperation, APEC List of Environmental Goods. https://www.apec.org/.
- Apergis, N., & Payne, J. E. (2010). Renewable energy consumption and economic growth: evidence from a panel of OECD Countries. Energy Policy, 38(1), 656–660. https://doi.org/10.1016/j.enpol.2009.09.002
- Arellano, M., & Bover, O. (1995). Another look at the instrumental variable estimation of error-components models. Journal of Econometrics, 68(1), 29–51. https://doi.org/10.1016/0304-4076(94)01642-D
- Baron, R.M., & Kenny, D.A. (1986). The moderatormediator variable distinction in social psychological research: conceptual, strategic, and statistical considerations. Journal of Personality and Social Psychology, 5, 1173–1182. https://doi.org/10.1037/0022-3514.51.6.1173
- Baulch, B., Do, T. D., & Le, T. H. (2018). Constraints to the uptake of solar home systems in Ho Chi Minh City and some proposals for improvement. Renewable Energy, 118, 245–256. https://doi.org/10.1016/j.renene.2017.10.106
- Bhowmik, C., Bhowmik, S., Ray, A., & Pandey, K. M. (2017). Optimal green energy planning for sustainable development: A review. Renewable and Sustainable Energy Reviews, 71, 796–813. https://doi.org/10.1016/j.rser.2016.12.105
- Biresselioglu, M. E., Nilsen, M., Demir, M. H., Røyrvik, J., & Koksvik, G. (2018). Examining the barriers and motivators affecting European decision-makers in the development of smart and green energy technologies. Journal of Cleaner Production, 198, 417–429. https://doi.org/10.1016/j.jclepro.2018.06.308
- Brini, R., Amara, M., & Jemmali, H. (2017). Renewable energy consumption, International trade, oil price and economic growth inter-linkages: The case of Tunisia. Renewable and Sustainable Energy Reviews, 76, 620–627. https://doi.org/10.1016/j.rser.2017.03.067
- CCIED. (2017). China customs import and export database. http://www.customs.gov.cn/.
- CEAD. (2018). China emission accounts and datasets. http://www.ceads.net/data/inventory-by-sectoral-approach/.
- CSY. (2020). National Bureau of Statistics, China Statistical Yearbook. http://www.stats.gov.cn/tjsj/ndsj/.
- Dai, H. C., Xie, X. X., Xie, Y., Liu, J., & Masui, T. (2016). Green growth: The economic impacts of large-scale renewable energy development in China. Applied Energy, 162, 435–449. https://doi.org/10.1016/j.apenergy.2015.10.049
- Destek, M. A., & Aslan, A. (2017). Renewable and non-renewable energy consumption and economic growth in emerging economies: Evidence from bootstrap panel causality. Renewable Energy, 111, 757–763. https://doi.org/10.1016/j.renene.2017.05.008
- Dong, K. Y., Ren, X. H., & Zhao, J. (2021). How does low-carbon energy transition alleviate energy poverty in China? A nonparametric panel causality analysis. Energy Economics, 103, 105620. https://doi.org/10.1016/j.eneco.2021.105620
- Dong, K. Y., Sun, R. J., Jiang, H. D., & Zeng, X. G. (2018). CO2 emissions, economic growth, and the environmental Kuznets curve in China: What roles can nuclear energy and renewable energy play? Journal of Cleaner Production, 196, 51–63. https://doi.org/10.1016/j.jclepro.2018.05.271
- Duan, Y. W., & Yan, B. Q. (2021). Has processing trade made China’s exports cleaner? A regional level analysis. Energy Economics, 96, 105150. https://doi.org/10.1016/j.eneco.2021.105150
- Elliot, D. (2007). Nuclear or Not? Does nuclear Power have a place in sustainable energy future? Palgrave Macmillan.
- Ferguson, C. (2007). Nuclear energy: Balancing benefits and risks. Council of Foreign Relations.
- Frees, E. W. (2004). Longitudinal and panel data: Analysis and applications in the social sciences. Cambridge University Press.
- Gokmenoglu, K. K., Amin, M. Y., & Taspinar, N. (2015). The Relationship among international trade, financial development and economic growth: The case of Pakistan. Procedia Economics and Finance, 25, 489–496. https://doi.org/10.1016/S2212-5671(15)00761-3
- Grossman, G. M., & Helpman, E. (1991). Innovation and growth in the global economy. MIT Press.
- Hallegatte, S., & Corfee-Morlot, J. (2011). Understanding climate change impacts, vulnerability and adaptation at city scale: An introduction. Climate Change, 1, 1–12. https://doi.org/10.1007/s10584-010-9981-8
- Hallegatte, S., Heal, G., Fay, M., & Treguer, D. (2012). From growth to green growth – A framework. NBER Working Papers 17841, National Bureau of Economic Research. https://www.nber.org/papers/w17841
- ICTSD. (2017). International centre for trade and sustainable development, HS Codes and the renewable energy sector.
- Jacobs, M. (2012). Green growth: Economic theory and political discourse. Centre for Climate Change Economics. http://www.lse.ac.uk/GranthamInstitute/wp-content/uploads/2012/10/WP92-green-growth-economic-theory-political-discourse.pdf.
- Jiang, H. D., Dong, X. C., Jiang, Q. Z., & Dong, K. Y. (2020). What drives China’s natural gas consumption? Analysis of national and regional estimates. Energy Economics, 87, 104744. https://doi.org/10.1016/j.eneco.2020.104744
- Jiang, H. D., Hao, W. T., Xu, Q. Y., & Liang, Q. M. (2020). Socio-economic and environmental impacts of the iron ore resource tax reform in China: A CGE-based analysis. Resources Policy, 68, 101775. https://doi.org/10.1016/j.resourpol.2020.101775
- Jones, L. E., & Manuelli, R. (1990). A convex model of equilibrium growth: Theory and policy implications. Journal of Political Economy, 98(5, Part 1), 1008–1037. https://doi.org/10.1086/261717
- Jouvet, P., & Perthuis, C. (2013). Green growth: From intention to implementation. International Economics, 134, 29–55. https://doi.org/10.1016/j.inteco.2013.05.003
- Kunanuntakij, K., Varabuntoonvit, V., Vorayos, N., Panjapornpon, C., & Mungcharoen, T. (2017). Thailand green GDP assessment based on environmentally extended input-output mode. Journal of Cleaner Production, 167, 970–977. https://doi.org/10.1016/j.jclepro.2017.02.106
- Lall, S. (2000). The technological structure and performance of developing country manufactured exports, 1985–98. Oxford Development Studies, 28, 337–369. https://doi.org/10.1080/713688318
- Li, J. M., Dong, X. C., & Dong, K. Y. (2021a). Do pollutant discharge fees affect labour demand? Evidence from China’s industrial enterprises. Applied Economics, 54, 170–188. https://doi.org/10.1080/00036846.2021.1963662
- Li, J. M., Dong, X. C., Jiang, Q. Z., & Dong, K. Y. (2022). Urban natural gas demand and factors analysis in China: Perspectives of price and income elasticities. Petroleum Science, 19, 429–440.. https://doi.org/10.1016/j.petsci.2021.12.028
- Li, J. M., Dong, X. C., Jiang, Q. Z., Dong, K. Y., & Liu, G. X. (2021b). Natural gas trade network of countries and regions along the belt and road: Where to go in the future? Resources Policy, 71, 101981. https://doi.org/10.1016/j.resourpol.2020.101981
- Li, G., & Fang, C. (2014). Global mapping and estimation of ecosystem services values and gross domestic product: a spatially explicit integration of national ‘green GDP’ accounting. Ecological Indicators, 46, 293–314. https://doi.org/10.1016/j.ecolind.2014.05.020
- Lin, E. Y. Y., Chen, P. Y., & Chen, C. C. (2013). Measuring green productivity of country: a generlized metafrontier Malmquist productivity index approach. Energy, 55, 340–353. https://doi.org/10.1016/j.energy.2013.03.055
- Lin, B. Q., & Zhou, Y. C. (2021). Measuring the green economic growth in China: Influencing factors and policy perspectives. Energy, 3, 122518. https://doi.org/10.1016/j.energy.2021.122518
- Liu, G. X., Dong, X. C., Jiang, Q. Z., Dong, C., & Li, J. M. (2018). Natural gas consumption of urban households in China and corresponding influencing factors. Energy Policy, 122, 17–26. https://doi.org/10.1016/j.enpol.2018.07.016
- Liu, G. X., Dong, X. C., Kong, Z. Y., & Dong, K. Y. (2021a). Does national air quality monitoring reduce local air pollution? The case of PM2.5 for China. Journal of Environmental Management, 296, 113232. doi:10.1016/j.jenvman.2021.113232.
- Liu, G. X., Dong, X. C., Kong, Z. Y., Jiang, Q. Z., & Li, J. M. (2021b). The role of China in the East Asian natural gas premium. Energy Strategy Reviews, 33, 100610. https://doi.org/10.1016/j.esr.2020.100610
- Menegaki, A. N. (2011). Growth and renewable energy in Europe: a random effect model with evidence for neutrality hypothesis. Energy Economics, 33(2), 257–263. https://doi.org/10.1016/j.eneco.2010.10.004
- NDRC. (2020). National development and reform commission. https://www.ndrc.gov.cn/.
- Panagiotis, F., Sotiris, K., & Dimitrios, A. (2017). The relationship between energy demand and real GDP growth rate: The role of price asymmetries and spatial externalities within 34 countries across the globe. Energy Economics, 66, 69–84. https://doi.org/10.1016/j.eneco.2017.05.027
- Pesaran, M. H. (2004). General diagnostic tests for cross section dependence in panels. Cambridge Working Papers in Economics 69, 1240. http://www.dspace.cam.ac.uk/handle/1810/446.
- Qin, Y., Xu, Z. S., Wang, X. X., & Škare, M. (2022). Green energy adoption and its determinants: A bibliometric analysis. Renewable and Sustainable Energy Reviews, 153, 111780. https://doi.org/10.1016/j.rser.2021.111780
- Rahman, M. M. (2021). The dynamic nexus of energy consumption, international trade and economic growth in BRICS and ASEAN countries: A panel causality test. Energy, 229, 120679. https://doi.org/10.1016/j.energy.2021.120679
- Reilly, J. M. (2012). Green growth and the efficient use of natural resources. Energy Economics, 34, 85–93. https://doi.org/10.1016/j.eneco.2012.08.033
- Ren, X. H., Cheng, C., Wang, Z., & Yan, C. (2021). Spill-over and dynamic effects of energy transition and economic growth on carbon dioxide emissions for the European Union: A dynamic spatial panel model. Sustainable Development, 29(1), 228–242. https://doi.org/10.1002/sd.2144
- Ren, X. H., Duan, K., Tao, L. Z., Shi, Y. K., & Yan, C. (2022b). Carbon prices forecasting in quantiles. Energy Economics, 108, 105862. https://doi.org/10.1016/j.eneco.2022.105862
- Ren, X. H., Li, Y. Y., Shahbaz, M., Dong, K. Y., & Lu, Z. D. (2022). Climate risk and corporate environmental performance: Empirical evidence from China. Sustainable Production and Consumption, 30, 467–477. https://doi.org/10.1016/j.spc.2021.12.023
- Sadorsky, P. (2009). Renewable energy consumption and income in emerging economies. Energy Policy, 37(10), 4021–4028. [Database] https://doi.org/10.1016/j.enpol.2009.05.003
- Shahbaz, M., Li, J. M., Dong, X. C., & Dong, K. Y. (2022). How financial inclusion affects the collaborative reduction of pollutant and carbon emissions: The case of China. Energy Economics, 107, 105847. https://doi.org/10.1016/j.eneco.2022.105847
- Sohag, K., Taşkın, F. D., & Malik, M. N. (2019). Green economic growth, cleaner energy and militarisation: Evidence from Turkey.
- Song, M. L., Peng, L. C., Shang, Y. P., & Zhao, X. (2022). Green technology progress and total factor productivity of resource-based enterprises: A perspective of technical compensation of environmental regulation. Technological Forecasting and Social Change, 174, 121276. https://doi.org/10.1016/j.techfore.2021.121276
- Song, M. L., Wang, S. H., & Zhang, H. Y. (2020). Could environmental regulation and R&D tax incentives affect green product innovation? Journal of Cleaner Production, 258, 120849. https://doi.org/10.1016/j.jclepro.2020.120849
- Song, X. G., Zhou, Y. X., & Jia, W. (2019). How do economic openness and R&D investment affect green economic growth?—Evidence from China. Resources, Conservation & Recycling, 146, 405–415. https://doi.org/10.1016/j.resconrec.2019.03.050
- Sun, Y., Li, M., Zhang, M., Khan, H. S. U. D., Li, J., Li, Z., Sun, H., Zhu, Y., & Anaba, O. A. (2021). A study on China's economic growth, green energy technology, and carbon emissions based on the Kuznets curve (EKC)). Environmental Science and Pollution Research International, 28(6), 7200–7211. https://doi.org/10.1007/s11356-020-11019-0
- Talberth, J., & Bohara, A. K. (2006). Economic openness and green GDP. Ecological Economics, 58(4), 743–758. https://doi.org/10.1016/j.ecolecon.2005.09.002
- Talebzadehhosseini, S., & Garibay, I. (2022). The interaction effects of technological innovation and path-dependent economic growth on countries overall green growth performance. Journal of Cleaner Production, 333, 130134. https://doi.org/10.1016/j.jclepro.2021.130134
- Troster, V., Shahbaz, M., & Uddin, G. S. (2018). Renewable energy, oil prices, and economic activity: A Granger-causality in quantiles analysis. Energy Economics, 70, 440–452. https://doi.org/10.1016/j.eneco.2018.01.029
- UNESCAP. (2011)., United Nations Economic and Social Communication for Asia and the Pacific, Climate-Smart Trade and Investment in Asia and the Pacific. https://www.un.org/zh/.
- Wang, X. L., & Shao, Q. L. (2019). Non-linear effects of heterogeneous environmental regulations on green growth in G20 countries: Evidence from panel threshold regression. The Science of the Total Environment, 660, 1346–1354. https://doi.org/10.1016/j.scitotenv.2019.01.094
- Wang, S. H., Wang, X. Q., & Lu, B. B. (2022). Is resource abundance a curse for green economic growth? Evidence from developing. Resources Policy, 75, 102533. https://doi.org/10.1016/j.resourpol.2021.102533
- Wang, J., Zhang, S. L., & Zhang, Q. J. (2021). The relationship of renewable energy consumption to financial development and economic growth in China. Renewable Energy, 170, 897–904. https://doi.org/10.1016/j.renene.2021.02.038
- World Bank. (2008). International trade and climate change: Economic, legal and institutional perspectives institute. Washington DC: World Bank Publications, 52–72. www.worldbank.org/.
- World Bank. (2018). State and trends of carbon pricing 2018. https://www.worldbank.org.
- Wu, H. T., Hao, Y., & Ren, S. Y. (2020). How do environmental regulation and environmental decentralization affect green total factor energy efficiency: Evidence from China. Energy Economics, 91, 104880. https://doi.org/10.1016/j.eneco.2020.104880
- Wüstenhagen, R., Wolsink, M., & Bürer, M. J. (2007). Social acceptance of renewable energy innovation: An introduction to the concept. Energy Policy, 35(5), 2683–2691. https://doi.org/10.1016/j.enpol.2006.12.001
- Xie, H. L., Chen, Q. R., Wang, W., & He, Y. F. (2018). Analysing the green efficiency of arable land use in China. Technological Forecasting and Social Change, 133, 15–28. https://doi.org/10.1016/j.techfore.2018.03.015
- Young, A. (1991). Learning by doing and dynamic effects of international trade. Journal of Political Economy, 106, 369–405.
- Zhao, X., Mahendru, M., Ma, X. W., Rao, A., & Shang, Y. P. (2022). Impacts of environmental regulations on green economic growth in China: New guidelines regarding renewable energy and energy efficiency. Renewable Energy, 187, 728–742. https://doi.org/10.1016/j.renene.2022.01.076
- Zhao, J., Shahbaz, M., & Dong, K. Y. (2021). How does energy poverty eradication promote green growth in China? The role of technological innovation. Technological Forecasting and Social Change, 11, 121384. https://doi.org/10.1016/j.techfore.2021.121384
- Zhao, P. J., Zeng, L. E., Lu, H. Y., Zhou, Y., Hu, H. Y., & Yuan, X. W. (2020). Green economic efficiency and its influencing factors in China from 2008 to 2017: based on the super-SBM model with undesirable outputs and spatial Dubin model. The Science of the Total Environment, 741, 140026. https://doi.org/10.1016/j.scitotenv.2020.140026
- Zhu, Q. Y., Chen, X. F., Song, M. L., Li, X. C., & Shen, Z. Y. (2022). Impacts of renewable electricity standard and Renewable Energy Certificates on renewable energy investments and carbon emissions. Journal of Environmental Management, 306, 114495. https://doi.org/10.1016/j.jenvman.2022.114495
- Zhu, B. Z., Zhang, M. F., Huang, L. Q., Wang, P., Su, B., & Wei, Y. M. (2020). Exploring the effect of carbon trading mechanism on China’s green development efficiency: A novel integrated approach. Energy Economics, 85, 104601. https://doi.org/10.1016/j.eneco.2019.104601
Appendix A
Table A1. List of abbreviations.