
 ?Mathematical formulae have been encoded as MathML and are displayed in this HTML version using MathJax in order to improve their display. Uncheck the box to turn MathJax off. This feature requires Javascript. Click on a formula to zoom.
Abstract
The issue of climate change and environmental degradation has been prevailing for the last few decades. Yet economies are further expanding due to free trade agreement which accelerates the trade of energy and carbon intensive commodities across the regions. A prominent example of such free trade is the Regional Comprehensive Economic Partnership (R.C.E.P.), which mostly remains ignored. The current research study explores the influence of financial development (F.D.) and energy efficiency (E.N.E.F.) on carbon emissions in the R.C.E.P. economies. Also, this study analyses the role of economic growth and renewable energy on environmental quality during the period from 1990 to 2020. Panel data approaches such as slope heterogeneity, cross-section dependence, and the second-generation panel unit root test are used. The non-normally distributed variables are found cointegrated. Therefore, a novel method of moments quantile regression is used. The results demonstrate that F.D. and economic growth are positively associated with CO2 emissions. At the same time, E.N.E.F. and renewable energy consumption (R.E.C.) significantly reduce the emissions level and promote a green environment in all quantiles. The environmental Kuznets curve is found valid in the R.C.E.P. economies. These results are robust as validated by Fully-Modified Ordinary Least Square – a parametric approach. A two-way significant causal association exists between carbon-economic growth, carbon-F.D., carbon-R.E.C., and carbon-E.N.E.F.. The findings suggest an enhancement in R.E.C., improvement in the E.N.E.F. approaches, and implications for green F.D. in the region.
1. Introduction
Financial development (F.D.) excites the economy and has a fundamental role in the growth of the country (Dai et al., Citation2022; Song et al., Citation2020). However, increasing F.D. cause intensive energy consumption which inversely affects the environment (Shah et al., Citation2022; Shahzad et al., Citation2022). The rise of economic activities proportionally impacts energy consumption and pollutes the environment. Attributable to this, a continuous increase in F.D. leads to a growth in credits for energy consumption affecting the environment. The world is confronting concerns related to environmental development combined with economic development, which affects the continued existence of living beings (Akram et al., Citation2022; Bashir et al., Citation2020).
The emissions of carbon dioxide substantially impact environmental quality. Numerous studies analysed the determinants of emissions and ecological deficits (Fatima et al., Citation2021; Shah et al., Citation2022). However, F.D. is another determinant of carbon emissions despite the fact still the association between F.D. and carbon emissions is ambiguous in the existing literature. Few of the recent studies (Abbasi & Riaz, Citation2016; Shahzad et al., Citation2022; Umar et al., Citation2020) have examined the relationships between trade, F.D. and environment. The findings demonstrated a positive association indicating that F.D. is harmful to sustainable environmental development (Ji, Chen et al., Citation2021; Nazir et al., Citation2018). It forces people to spend on energy-intensive technologies that hamper the environmental quality, ultimately escalating emissions in the country (Khan et al., Citation2022). In disparity, few studies quoted the opposite. The findings established that increasing F.D. could help the economy achieve a maintainable environment (Li et al., Citation2020). They are introducing and adopting green technologies and technological, financial systems and implementing low-carbon economy measures aid in lessening the degradation of the environment (Ji, Zhang et al., Citation2021; Li et al., Citation2021; Umar, Ji et al., Citation2021).
Environmental protection is one of the Sustainable development Goals (climate action) goals. According to a novel study on A.S.E.A.N. countries (Malaysia, Indonesia, Thailand, Vietnam, and the Philippines), improvements in F.D. in the aforementioned economies have a beneficial impact on environmental quality and performance (Ielasi et al., Citation2018). The findings suggested that renewable energy and eco-friendly environmental policies aid in acquiring sustainable green and low-carbon economies (Adeel-Farooq et al., Citation2022). In the case of Singapore, the country is encouraging and implementing supportable al strategies for an eco-friendly economy (Chew, Citation2016; Yuen, Citation2008). Development is essential for the economy, but it has adverse impacts on the environmental eminence (Kaiser & Welters, Citation2019). For this reason, Vietnam has adopted sustainable environmental goals for reducing carbon emissions in all country sectors (Tien et al., Citation2019). Moreover, countries like Denmark, India, Japan, China, and European nations are concentrating on minimising greenhouse gasses, encouraging green technologies, and also emphasising green entrepreneurship (Bhandari & Sharma, Citation2022; Su, Xi, et al., Citation2022; Wang, Ahmad et al., Citation2021).
In the case of Australia, the country is utilising green technologies to reduce its carbon footprint for a sustainable environment. The economic and social gauges represent improved performance, whereas the environmental indicators represent the opposite (Baxter, Citation2021; Wood & Garnett, Citation2010). China is the largest emitter of carbon emissions, though it is difficult to analyse all the determinants of emissions in the country. However, studies by Abbasi et al. (Citation2022) and Zahoor et al. (Citation2022) found that fossil fuel consumption aggravates the CO2 emissions but clean and green energy aid in mitigating those harmful emissions' environmental footprint. Malaysia has also followed green strategies for clean environmental development. The Malaysian economy is adopting measures to maintain a green environment (Yusof et al., Citation2022). Even Indonesia has taken initial steps to adapt toward a green, low-carbon economy, while Myanmar's efforts are to confront environmental apprehensions about climate change (Martawardaya et al., Citation2021; Zain et al., Citation2022).
The study is significant in succeeding ways. F.D. is a broader concept than financial inclusion. Therefore, the study employs Domestic Credit to the Private Sector by Banks as a variable for F.D. to examine its impact on carbon emissions in R.E.C.P. economies (Ferrat et al., Citation2022). Second, the study's findings are imperative for developing a consensus on the influence of F.D. on the green environment that supports policy-making for a sustainable environment (Aristovnik et al., Citation2020). The research aims to analyse the influence of F.D. on environmental quality, taking ‘Regional Comprehensive Economic Partnership’ economies from the period 1990 to the year 2020. Further, renewable energy consumption (R.E.C.) and energy efficiency (E.N.E.F.) are also evaluated in the green environment with F.D. alongside (Su, Khan, et al., Citation2021). Furthermore, the study considers two models for in-depth analysis of the concept. The first model is measured without E.K.C., while the second model is tested for E.K.C. by including gross domestic product (G.D.P.) (Sq) intended for scrutinising the R.E.C.P. economies.
The study contributes in subsequent ways. To the best of the authors' knowledge, it contributes to the literature by covering the role of F.D., considering carbon dioxide emissions as an environmental quality/performance indicator for examining the green environment in R.E.C.P. countries. These countries include Australia, China, Indonesia, Japan, South Korea, Malaysia, Myanmar, New Zealand, the Philippines, Singapore, Thailand, and Vietnam, which contribute approximately 29% of the world's G.D.P. and are expected to further rise their G.D.P. value by 2030 (Dai et al., Citation2022). Second, the current study extends the debate on F.D. as academicians and scholars have not determined a consensus on whether F.D. degrades the environment or aids in improving the environment. Third, the study examines the influence of F.D., E.N.E.F., and R.E.C. as control factors on carbon emissions, employing novel econometric approaches.
The rest of the article is structured as follows. The literature review is documented in Section 2 of the article. Section 3 elaborates on the model and methodology used in research to understand the concept. Section 4 is about results and their particular discussion, whereas Section 5 designs the conclusion and implications based on the findings.
2. Literature review
The empirical underpinnings are documented and summarised in this section.
2.1. Financial development and financial inclusion
In accord with the World Bank Group, F.D. is ‘overcoming the costs incurred in the financial system’. Different financial institutions and markets come under this area. Financial inclusion is a part of F.D. and facilitates economic growth and development. It is defined as access and availability of financial resources to individuals and businesses (World Bank, Citation2020).Footnote1
2.2. Financial development and carbon emissions
Zhang (Citation2011) determined the complex association between F.D. and carbon emissions in China. The results from econometric techniques indicated that F.D. encourages carbon emissions. Abbasi and Riaz (Citation2016) investigated the impact of F.D. on carbon emissions. The findings established that F.D. does not help in limiting carbon emissions. Ahmed et al. (Citation2021) support the Environmental Kuznets hypothesis in Japan and the impact of F.D. and globalisation encouraging carbon emissions. Jiang and Ma (Citation2019) explored a global perspective for the association of F.D. with CO2 emissions. The empirical findings in developing or emerging economies are substantially positive, while it is insignificant or has no impact on developed economies. The development of the stock market and financial institutions has a more vigorous impact on emissions. They also stated that in consort with the development of the economy, the positive effect of the developing country will be offset by the negative impact. Shen et al. (Citation2021) considered the determinants of carbon emissions in China. The findings demonstrated that F.D. and rent of natural resources increase the emissions while green investment is inversely associated with carbon dioxide emissions, i.e., it decreases emissions. More recently, Sheraz et al. (Citation2022) also confirmed the positive impact of F.D. on carbon emissions. Extreme reliance on natural resources further harms the economy’s financial systems (Umar, Rizvi et al., Citation2021; Yang et al., Citation2021). In contrast, Studies like Park et al. (Citation2018) and Zaidi et al. (Citation2019) reported the negative influence of F.D. on carbon dioxide emissions. The studies suggested that the rise of F.D. helps reduce carbon emissions. There is the existence of a feedback effect between the observed variables. However, the findings of Charfeddine and Kahia (Citation2019) established the slight impact of F.D. on carbon dioxide emissions. They described the reason as there is a weak contribution of F.D. to improve the environmental quality and growth of the economy.
2.3. Does financial inclusion promote a green environment?
Financial inclusion is substantial for clean and green energy and imperative for F.D. (Rehman et al., Citation2022). It improves E.N.E.F., and low-carbon energy sources play a crucial part in economic development (Chenet et al., Citation2019; Le et al., Citation2021; Su, Li, et al., Citation2022). Ahmad et al. (Citation2022) examined the granger causality between financial inclusion and environmental degradation in B.R.I.C. economies. The findings represented that financial inclusion escalates carbon emissions. However, green openness and technological innovation assist in enhancing a sustainable environment (Fareed et al., Citation2022; Wang, Umar et al., Citation2021). Integrating financial inclusion intended for effective environmental policies might contribute to achieving climate-related goals. In contrast, Dai et al. (Citation2022) investigated the role of financial inclusion in a sustainable environment from the year 2004 to 2019. The results indicated a positive impact of financial inclusion in promoting a green environment in R.E.C.P. economies. It gives easy access to financial structures because financial organisations have a greater impact on the environment, thereby promoting financial inclusion, green and clean technology can be utilised. Further, China increases green economic efficiency and proficiency for sustainable development and boosts the environment (Liu et al., Citation2022; Su, Meng, et al., Citation2021). Dou and Li (Citation2022) inspected the positive association between financial inclusion and carbon emissions. Qin et al. (Citation2021) confirmed the long-run connection between financial inclusion and efficient energy over carbon dioxide emissions. In consonance with A.F.I. global, financial inclusion is linked with environmental sustainability, and it can help build resilience in mitigating climatic effects (AFI, Citation2021). Zaidi et al. (Citation2021) inspected the dynamic connections between financial inclusions and emissions of carbon in O.E.C.D. economies. The findings revealed inverse associations between emissions and financial inclusion. Increasing financial inclusion reduces the emissions in the country. Moreover, Li et al. (Citation2022) explored the transmissions channels of financial inclusion for renewable energy and non-R.E.C. in China. They emphasised that raising financial inclusion to limit energy consumption can help the country promote a sustainable environment. Further, Tao et al. (Citation2022) accentuated green funds for promoting zero-carbon investment growth for a sustainable environment. Investors must pay a premium for environment-friendly investment and focus on developing fintech green funds for reducing carbon emissions. As per they are risk-adjusted, low-carbon footprint, aid in better performance of assets/institutions, and promote zero-carbon investment standards (Dorfleitner & Grebler, Citation2022; Mirza et al., Citation2020; Naqvi et al., Citation2021; Umar, Rizvi et al., Citation2021).
2.4. Energy efficiency and a sustainable environment
E.N.E.F. has a substantial role in limiting carbon emissions for a sustainable environment (Fareed et al., Citation2021; Rehman et al., Citation2021). Lei et al. (Citation2022) explored the dynamic influence of E.N.E.F. and renewable energy on carbon dioxide emissions in China. The findings suggested that a positive shock on E.N.E.F. negatively impacts carbon emissions in the short run (Ferrat et al., Citation2022). Whereas, a positive surprise in E.N.E.F. negatively influences carbon dioxide emissions in the long run. The negative shock in the short run has an unobservable effect on emissions, while the positive surprise, in the long run, favors negatively effects the emissions. Zakari et al. (Citation2022) inspected the association between E.N.E.F. and sustainable economic development in Asian and Pacific region countries. The findings show a positive association, i.e., an increase in E.N.E.F. increases sustainable development, which is important for a sustainable environment. There is also a positive relationship between E.N.E.F. and green innovation. Enhancing an efficient form of energy is operative in combating carbon emissions (Endo, Citation1993). For this reason, it plays a necessary part in reducing carbon and greenhouse gas emissions for sustainable development (Bibi et al., Citation2021; Paramati et al., Citation2022; Sharma et al., Citation2021). Dou and Li (Citation2022) emphasised diversifying the energy mix and enhancing E.N.E.F. for reducing emissions for a clean and green environment.
2.5. Literature summary & research gap
F.D. and financial inclusion play a momentous role in impacting carbon dioxide emissions through improving or degrading environmental eminence. More than a few studies (Musah et al., Citation2022; Su, Song, et al., Citation2021; Umar et al., Citation2020) reported sustainable financial inclusion is important for acquiring E.N.E.F. that helps in the reduction of emissions together with boosting environmental quality. While the case of F.D. is considered, it upsurges carbon emissions. However, if F.D. aids in improving green finance for sustainable development, it will be beneficial for improving the environment and limiting carbon emissions (Dai et al., Citation2022; Zaidi et al., Citation2019). For a sustainable green environment, it is essential to endorse low-carbon-footprint finance and encourage energy-efficient sources to limit harmful greenhouse gas and carbon emissions.
The current research focuses on the role of F.D. in preserving the environment in the economies of the R.C.E.P. The current study also covers the gap by expanding the debate by employing novel variables and practices on F.D. in R.E.C.P. economies. To accomplish the research target, carbon dioxide emissions are taken into account to scrutinise the environment's performance, unlike prior studies like Dai et al. (Citation2022) and Dou and Li (Citation2022). The study realises the relationship deeply through the role of E.N.E.F. and R.E.C. as novel control variables for the indemnity of the green environment in RECP economies.
3. Data and methodology
3.1. Data and variables specifications
Following the literature and given objectives mentioned in the first section, this study uses carbon dioxide (CO2, measured in kt) emissions as a proxy for a green environment. Nonetheless, various types of gases emissions determine the quality of the environment. Yet, CO2 is the most widely used measure of environmental quality as it has a considerable portion of greenhouse gas emissions. On the other hand, F.D. and E.N.E.F. are the focused variables. Specifically, the proxy for F.D. used here is the domestic credit to the private sector by banks and measured as a percent of gross domestic product (G.D.P.), Whereas E.N.E.F. is the G.D.P. per unit of energy use, which is measured in constant 2017 P.P.P. dollars per kg of oil equivalent. In addition, two controlled variables are also used in this study, namely: economic growth, which is captured via G.D.P. and measured in constant US$2015 prices, and R.E.C. – measured as a percent of total energy use. Data for all these variables is extracted from the World Development Indicators (World Bank, Citation2020), covering the extended period of the last three decades, i.e., from 1990 to 2020. The data is particularly extracted for a panel of Regional Comprehensive Economic Partnership (R.C.E.P.) economies that includes 12 economies: Australia, Vietnam, Japan, Singapore, China, Malaysia, the Philippines, Indonesia, South Korea, Myanmar, New Zealand, and Thailand. Since these economies include both developed and emerging economies, the primary objective of the R.C.E.P. is to promote free trade in these economies, which could substantially impact their environmental quality. However, since the last two decades, the free trade between these economies has been observed to accelerate. Due to which energy use surges for industrial sector’s running, causes climate change (Shahzad et al., Citation2020). Therefore, it is important to investigate these economies in the last three decades to comprehensively analyse their environmental situation and to provide appropriate policy measures for obtaining a low carbon economy.
Following the study of Ahmed et al. (Citation2021) and Jiang and Ma (Citation2019), this study constructed the following model:
Model-1
(1)
(1)
where Model-1 demonstrates that G.D.P., F.D., R.E.C., and E.N.E.F., combinedly determine CO2 emissions. To test for the environmental Kuznets curve, this study also included the squared term of G.D.P. in the model, given as Model-2:
Model-2 (EKC)
(2)
(2)
where
is intercepted in the models, while
and
are the coefficients to estimate for each variable. Further, the ‘i’ and ‘t’ in the subscript describe cross-section and time period. However,
is the random error term of the model.
3.2. Estimation strategy
This research uses descriptive statistics such as the mean, median, and range values to summarise data. Where the range values further indicate the minimum and maximum intervals of time series observations during a particular period. Additionally, this research examines each variable's standard deviation, which is used to characterise the fluctuation of observation(s) from the mean values and is a general measure of volatility in a series of data. The most critical section of the description section explains the variables' normality. In this regard, the present research calculates the skewness and Kurtosis, respectively, compared to the critical values 1 and 3. To conduct a more extensive analysis of the data's normality, this research used (Jarque & Bera, Citation1987) normality test, which considers skewness and excess Kurtosis to be equal to zero. The typical formula for this examination is as follows:
(3)
(3)
Until statistically significant results are obtained, the Jarque-Bera test demonstrates a time series’ normal distribution.
This research examines panel data properties, including slope coefficient heterogeneity (S.C.H.) and panel cross-sectional dependence (C.D.). If these two issues are not addressed, the results will be unreliable and biased (Wei et al., Citation2022). During the Industrial Revolution, globalisation and trading flourished, causing some nations to specialise while others expanded. This is because some economies rely on other governments and countries to achieve their environmental, economic, and technical goals. Authorities plan and execute methods that make economies seem the same, enhancing the probability of slope homogeneity's econometric issue. Nonetheless, ignoring panel data issues may result in ineffective and imprecise estimates (Breitung, Citation2005). Using the S.C.H. test devised by Pesaran and Yamagata (Citation2008), this study resolved the issue. This test is better since it produces both the ordinary S.C.H. and the adjusted S.C.H. (A.S.C.H.), as follows:
(4)
(4)
(5)
(5)
In the first equation, denotes the slope coefficient homogeneity, whereas
denotes the A.S.C.H. The null hypothesis of the above test also shows that the slope coefficients are homogeneous up to significance.
Trade and cross-border rivalry enable governments to specialise in high-demand goods and/or services, boosting their economies' dependence on other economies. Ignoring C.D. may lead to contradictory exploratory study findings (Campello et al., Citation2019). In this context, we employ (Pesaran & Smith, Citation1995) C.D. test to assess the nations' cross-sectional dependency. Dependency of cross-sections could be measured as follows:
(6)
(6)
The null hypothesis implies that cross-sections are independent. On the other hand, significant statistics demonstrate cross-sectional dependency and reject the null hypothesis.
Using panel data, the current work uses a unit root estimator to address S.C.H. and C.D. issues. Specifically, the study uses the (Pesaran, Citation2007) cross-sectional I.P.S. (C.I.P.S.) test. A factor modelling specification for cross-sectional dependency was presented by Pesaran (Citation2006). This strategy examines unexplained cross-sectional averages. Pesaran (Citation2007) modifies A.D.F. regression by including mean and first difference lag cross-sections. This approach generates cross-sectional dependence even if the panel is unbalanced (N > T or N < T). The ADF cross-section is defined mathematically as:
(7)
(7)
From the equation, it is noted that is the observations' mean of (N). To manage serial correlation, the first differenced lags of
and
may be added to the equation as mentioned above, while the transformed equation is given as:
(8)
(8)
Summary: The CIPS (Pesaran, Citation2007) may be examined across R.C.E.P. countries by aggregating the t-statistics for each cross-sectional unit (CADFi). The standard C.I.P.S. equation is as follows, which assumes a unit root in the time series as a null hypothesis:
(9)
(9)
This research uses (Westerlund, Citation2007) error correction model to analyse long-run equilibrium relationships among variables. This test gives reliable estimates despite cross-sectional reliance and slope fluctuation by combining group mean and panel statistics. The following is a commonly used approach for analysing group mean and panel statistics:
(10)
(10)
(11)
(11)
where EquationEquations (10)
(10)
(10) and Equation(11)
(11)
(11) estimate the group means statistics.
(12)
(12)
(13)
(13)
where the above EquationEquations (12)
(12)
(12) and Equation(13)
(13)
(13) estimate panel statistics.
Initially, Koenker and Bassett (Citation1978) used panel quantile regression specifications to calculate the dependent mean and conditional variability. Quantile regression works well when the dataset's distribution is asymmetric. Due to this issue, Machado and Silva (Citation2019) devised the method of moments quantile regression (M.M.Q.R.). This unique approach analyses the quantile values' distribution (Sarkodie & Strezov, Citation2019). EquationEquation (14)(14)
(14) provides the conditional quantile location-scale variant [
]:
(14)
(14)
where the probability
equals one. Whereas
and
are the coefficients estimated. The subscript ‘i’ shows a fixed effect – captured by
and
(where
). The k-vector is the distinctive element of R – captured by vector ‘Z’. While
shows a unique variation, as presented below:
(15)
(15)
From equation above, is distributed identically and independently for fixed ‘i’ as well as time (t), which is orthogonal to ‘i’ and ‘t’, as per (Machado & Silva, Citation2019). Hence, exterior factors and reserves are stabilised. As a result, EquationEquations (1)
(1)
(1) and Equation(2)
(2)
(2) may adopt new forms, given as:
(16)
(16)
Above EquationEquation (16)(16)
(16) reveals that
is collectively representing all the regressors, including G.D.P., R.E.C., F.D., and E.N.E.F. in Model-1, while including G.D.P.S. for the E.K.C. hypothesis in Model-2 and the mentioned variables, taken in the natural logarithm. Additionally,
indicates
’s quantile distribution, which is
emissions that depends upon the location of the quantile. Furthermore, the scalar coefficient [
] represents the steady influence of
quantiles on i. At the same time, the individual effect of the quantile does not impact the intercept. Due to the factors’ non-time-dependent alignment, different effects are capable of altering. Lastly,
Indicates the
quantiles’ sample, i.e., 25th, 50th, 75th and 90th. Hence, this research utilises the following equation for quantile:
(17)
(17)
where
represents the check function.
Since the outcomes of M.M.Q.R. provide important statistical estimates, this study uses the panel fully-modified ordinary least square (F.M.O.L.S.) approach as a robustness test to validate the empirical findings of the earlier estimator. Lastly, current research also uses (Dumitrescu & Hurlin, Citation2012) Granger panel causality heterogeneity test to identify the causal nexus between the dependent variable and regressors.
4. Results and discussion
This section discusses the estimated outcomes of the estimation strategy. Firstly, the descriptive statistics are given in . The computed outcomes of mean, median, and range values are found positive, which indicates all the variables are in the increasing phase. Specifically, carbon emissions, economic growth, R.E.C., F.D., and E.N.E.F. increase in R.C.E.P. economies. Yet a considerable difference has been observed in the range values of these variables. This demonstrates the inconsistency of these variables over time. Hence, the standard deviation is also evaluated, which indicates fluctuations of observations from the mean values of each respective variable. Economic growth and carbon emissions are the most volatile variables in the selected variables, as indicated by the standard deviation. Furthermore, this study also analyses the normality of the variables via skewness and Kurtosis. The empirical values of these tests are found to be different from their respective critical values – indicating the non-normal distribution of the data across the period. This study also evaluates the statistical values of (Jarque & Bera, Citation1987) normality test, which provides statistically significant estimates to reject the null hypothesis to conclude the non-normal o irregular distribution of data under consideration.
Table 1. Descriptive statistics and normality.
Once empirics confirm the non-normal distribution of data, this study analyses the panel data concerns such as slope heterogeneity and cross-section dependence. The estimated results for these concerns are provided in and , respectively. From the former, slope heterogeneity results asserted that the values of and
are statistically significant at a 1% level for both the models. Therefore, the proposition of homogenous slope coefficients could be rejected and concluded that the slopes coefficients are heterogeneous. As per the letter (cross-section dependence), the examined outcomes asserted that CO2, G.D.P., G.D.P.S., R.E.C., F.D., and E.N.E.F. hold highly significant values. Therefore, the null hypothesis of no cross-section dependence could be rejected. As mentioned earlier, globalisation and international trade significantly promote the transfer of goods and services across borders. Where this transfer enhances the dependence of economies on each other. As a result, economies reliance on other countries boosted, which led them to implement policies similar to their trading partners. Hence, the issues of slope heterogeneity and cross-section dependence may occur, which must be considered before empirical investigation.
Table 2. Slope heterogeneity.
Table 3. Cross-section dependence.
The prevalence of slope heterogeneity and cross-section dependence leads to adopting an appropriate stationarity estimator. Particularly, this study employs the (Pesaran, Citation2007) C.I.P.S. unit roots test that allows for both discussed panel data concerns. The estimated outputs of the said test are given in . The results appeal that only R.E.C. and E.N.E.F. are the variables that do not hold unit at the levelled data. Whereas CO2, G.D.P. and F.D. satisfy the null hypothesis of non-stationary. Therefore, these variables are tested on the first difference, where all these variables become significant and reject the null proposition. Hence, all the variables are found stationary, allowing this study to examine the long-run cointegration relationship between the variables considered.
Table 4. Unit root testing (Pesaran, Citation2007).
This study employs the (Westerlund, Citation2007) error correction model to analyse whether the long-run equilibrium relationship exists between the variables. The estimated results of the said test are provided in . From the Model-1, the statistical values of
and
are significant at a 1% level, while in the Model-2,
and
are significant at the 1% level. Such significant values reject the null hypothesis that the error correction term equals zero. Instead, the non-zero error correction, in this case, reveals that the long-run equilibrium connection exists between the model.
Table 5. Cointegration results (Westerlund, Citation2007).
Since the cointegration association allows the current study to examine the specific influence of regressors on CO2 emissions, the irregular data distribution leads to adopting a novel and appropriate non-parametric estimation method, which could deal with the issue of abnormality in the data. In this sense, the current study employs the M.M.Q.R. approach, and the results are displayed in . The results noted that economic growth and F.D. are the significant factors of increased CO2 emissions in the R.C.E.P. economies. Specifically, a one percent increase in the G.D.P. and F.D. enhances environmental degradation of the R.C.E.P. economies by 0.841–0.723 and 0.111–0.226% across all the quantiles. The primary reason for these two variables being the contributing factors is that enhancement in economic growth and financial activities enhances the income level of the industrialists and households. As a result, the enhanced income level further encourages demand for goods and services, which increases industrial production. Also, industrial expansion occurs due to increased demand for goods consumption. In this sense, the investors are attracted to invest more in the industrial sector to create and expand their industrial setup. F.D. provides an ease to this channel via providing more financial resources in the shape of loans and investments. Due to the increased and expanded industrial sector, the energy demand surges, particularly the use of coal, oil, and natural gas, speed up. While using such non-renewable energy resources leads to more greenhouse gas emissions and carbon emissions. Hence, environmental sustainability is adversely affected by these two measures. These findings showed consistency with the existing studies of Abbasi and Riaz (Citation2016), Shen et al. (Citation2021) and Zhang (Citation2011). The estimated statistics of the location of G.D.P. and F.D. further confirm these variables' positive influence on CO2 emissions.
Table 6. Estimates of quantile regression–MMQR (Model-1).
On the other hand, R.E.C. and E.N.E.F. are negatively associated with CO2 emissions. Specifically, enhancement in R.E.C. and E.N.E.F. reduces environmental degradation via mitigation of CO2 emissions. These results are consistent and statistically significant at a 1% level across the quantiles. In other words, renewable energy uses resources other than the exploitable natural resources, including wind, water, sun, etc. Energy obtained from these resources is considered environmentally friendly because these resources do not emit carbon or other greenhouse gases, which are harmful to environmental sustainability. Besides, renewable energy is a substitute for traditional fossil fuel energy. Where implication of renewable energy fulfills the energy requirement and promotes environmental sustainability. Furthermore, efficient energy use reveals using less energy for performing production or other activities. Due to reduced energy consumption, CO2 emissions and environmental sustainability increase. Li also provides similar findings to Lei et al. (Citation2022) and Li et al. (Citation2022) regarding the negative influence of renewable energy and E.N.E.F. on CO2 emissions. As shown in the bracket, the standard error shows that these results are reliable since these values are small.
Apart from the statistical values, this study provides the coefficient value of each explanatory variable on the graph (see ).
Figure 1. Quantiles coefficients (Model-1).
Source: Authors own estimations on data obtained from the given sources.
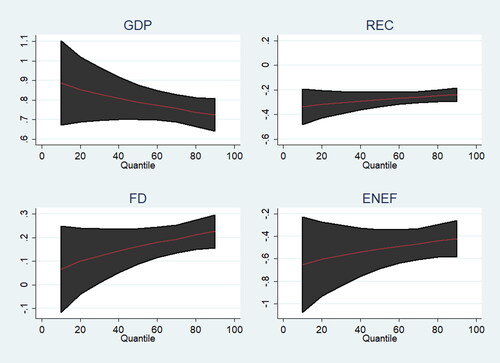
provides the empirical estimates of Model-2, where the squared term of G.D.P. (G.D.P.S.) is used to determine whether the environmental Kuznets curve exist in the panel of R.C.E.P. economies. The estimated results asserted that both the economic growth (G.D.P.) and F.D. increase CO2 emissions, yet only significant in the upper (Q0.75) quantile. The association is positive but insignificant in the lower (Q0.25, Q0.50) quantiles. On the other hand, R.E.C. and E.N.E.F. are found inversely related to CO2 emissions, significant only in the upper quantile. Yet the results are consistent with the earlier discussed Model-1. Besides, the increased economic growth (G.D.P.S.) is also found to be negatively associated with CO2 emissions. However, the results are insignificant in all the quantiles. The insignificant influence of G.D.P.S. reveals that R.C.E.P. economies require substantial economic growth to transform the positive impact of economic growth into a negative one. Instead, these economies should pay more attention to enhancing and adopting renewable energy and E.N.E.F. to attain environmental sustainability.
Table 7. Estimates of quantile regression–MMQR (Model-2).
provides the estimated outcomes of the robustness test, which are estimated via employing the fully-Modified ordinary least square approach. The estimated results validated the empirical findings of M.M.Q.R. Since the results report that there is a positive and significant impact of G.D.P. and F.D. on CO2 emissions. At the same time, R.E.C. and E.N.E.F. significantly reduce environmental degradation. Therefore, the results are robust and reliable. On the other hand, the G.D.P.S. reveals a significant negative impact on CO2 emissions, which validates the presence of E.K.C. in the R.C.E.P. economies. The major reason for the insignificant estimates of M.M.Q.R. and significant estimates of F.M.O.L.S. for G.D.P.S. is that the former is a non-parametric test, while the latter is a parametric test, which reveals the average value of regressors.
Table 8. Robustness test (F.M.O.L.S.).
Since the M.M.Q.R. and F.M.O.L.S. do not allow an analysis of the causal linkage of the variables under consideration, this study employs the (Dumitrescu & Hurlin, Citation2012) Granger panel causality test, and the results are provided in . The estimated results reveal a bidirectional causal association between the CO2 emissions and the explanatory variables. Here the bidirectional causality affirms that economic growth and F.D. are the key factors of CO2 emissions, which is consistent with the existing study of Ahmad et al. (Citation2022) in the case of B.R.I.C.S. economies. Also, the empirical results suggest that G.D.P.S., R.E.C., and E.N.E.F. are causing CO2 emissions and vice versa – indicating that these measures could be used as policy instruments to attain a low carbon economy in the longer term.
Table 9. Dumitrescu-Hurlin panel causality.
5. Conclusion and policy implications
This study analyses the factors of a green environment in the R.C.E.P. economies during the last three decades. In this regard, the current study examines F.D., E.N.E.F., economic growth, and renewable energy in CO2 emission abatement. This study uses the G.D.P. squared term in a separate model to test for the environmental Kuznets curves. Various panel econometric approaches are used for empirical work, including slope heterogeneity, panel cross-section dependence, second-generation unit root and the cointegration test. To comprehensively analyse the factors, this study uses a non-parametric technique known as the method of moments quantile regression. The obtained results reveal that economic growth and F.D. are the significant factors of environmental degradation. While R.E.C. and E.N.E.F. are the factors of a green environment, these variables significantly reduce the level of CO2 emissions in the region. Nonetheless, higher economic growth and F.D. motivate the industrial sector’s expansion and increased production. Due to this, the region or country is headed toward higher energy demand. Since the R.C.E.P. economies are heavily reliant on fossil fuel energy. Therefore, increased fossil fuel consumption leads to higher carbon emissions – considered a major factor of environmental degradation. However, after reaching a threshold level of income, these economies substantially start transforming towards R.E.C. and energy efficient products and equipment usage. As a result, the CO2 emissions decrease, and environmental quality tends to improve. This suggests the validity of the environmental Kuznets curve in the R.C.E.P. economies, which is proved significant in the parametric (F.M.O.L.S.) approach while insignificant in the non-parametric approach. The results are robust, while a two-way causal association exists between the CO2 and all explanatory variables.
Based on the empirical results, this study suggests the increased use of renewable energy and energy-efficient products and services in the R.C.E.P. economies. This will reduce demand for fossil fuel, but the former could also be used as a substitute for fossil fuel, which can be used for industrial and other domestic operational activities. Further, the increased E.N.E.F. will help the R.C.E.P. economies in two ways: first, the cost of fossil fuel will be minimised, which could be diverted to other environmentally friendly approaches, such as renewable energy generation, green technological innovation, renewable energy research and development, and E.N.E.F. promotion. Secondly, the increased E.N.E.F. could reduce CO2 emissions due to reduced fossil fuel consumption, particularly in the industrial sector. Additionally, economic growth and F.D. are found to be factors of environmental degradation in the R.C.E.P. economies. Therefore, these economies must focus on green F.D. and growth by providing financial strength to the industrial sector for structural transformation towards renewable energy, issuing green bonds, green loans and green technical support.
Disclosure statement
No potential conflict of interest was reported by the authors.
Notes
References
- Abbasi, F., & Riaz, K. (2016). CO2 emissions and financial development in an emerging economy: An augmented VAR approach. Energy Policy, 90, 102–114. https://doi.org/10.1016/j.enpol.2015.12.017
- Abbasi, K. R., Shahbaz, M., Zhang, J., Irfan, M., & Lv, K. (2022). Analyze the environmental sustainability factors of China: The role of fossil fuel energy and renewable energy. Renewable Energy, 187, 390–402. https://doi.org/10.1016/j.renene.2022.01.066
- Adeel-Farooq, R. M., Raji, J. O., & Qamri, G. M. (2022). Does financial development influence the overall natural environment? An environmental performance index (EPI) based insight from the ASEAN countries. Environment, Development and Sustainability, 1–17.
- AFI. (2021). Disaster Resilience through Financial Inclusion. https://www.afiglobal.org/wp-content/uploads/2021/02/AFI_IGF_disasterresilience_AW_1304.21_digital.pdf
- Ahmad, M., Ahmed, Z., Bai, Y., Qiao, G., Popp, J., & Oláh, J. (2022). Financial inclusion, technological innovations, and environmental quality: Analyzing the role of green openness. Frontiers in Environmental Science, 80.
- Ahmed, Z., Zhang, B., & Cary, M. (2021). Linking economic globalization, economic growth, financial development, and ecological footprint: Evidence from symmetric and asymmetric ARDL. Ecological Indicators, 121, 107060. https://doi.org/10.1016/j.ecolind.2020.107060
- Akram, R., Umar, M., Xiaoli, G., & Chen, F. (2022). Dynamic linkages between energy efficiency, renewable energy along with economic growth and carbon emission. A case of MINT countries an asymmetric analysis. Energy Reports, 8, 2119–2130. https://doi.org/10.1016/j.egyr.2022.01.153
- Aristovnik, A., Keržič, D., Ravšelj, D., Tomaževič, N., & Umek, L. (2020). Impacts of the COVID-19 pandemic on life of higher education students: A global perspective. Sustainability, 12(20), 8438. https://doi.org/10.3390/su12208438
- Bashir, M. A., Sheng, B., Doğan, B., Sarwar, S., & Shahzad, U. (2020). Export product diversification and energy efficiency: Empirical evidence from OECD countries. Structural Change and Economic Dynamics, 55, 232–243. https://doi.org/10.1016/j.strueco.2020.09.002
- Baxter, G. (2021). Mitigating an airport’s carbon footprint through the use of “green” technologies: The case of Brisbane and Melbourne Airports, Australia. International Journal of Environment, Agriculture and Biotechnology, 6(6), 029–039. https://doi.org/10.22161/ijeab.66.4
- Bhandari, R., & Sharma, D. (2022). Green entrepreneurship: Towards sustainable future. Inter-Disciplinary Entrepreneurship and Innovation Studies, 135.
- Bibi, A., Zhang, X., & Umar, M. (2021). The imperativeness of biomass energy consumption to the environmental sustainability of the United States revisited. Environmental and Ecological Statistics, 28(4), 821–841. https://doi.org/10.1007/s10651-021-00500-9
- Breitung, J. (2005). A parametric approach to the estimation of cointegration vectors in panel data. Econometric Reviews, 24(2), 151–173. https://doi.org/10.1081/ETC-200067895
- Campello, M., Galvao, A. F., & Juhl, T. (2019). Testing for slope heterogeneity bias in panel data models. Journal of Business & Economic Statistics, 37(4), 749–760. https://doi.org/10.1080/07350015.2017.1421545
- Charfeddine, L., & Kahia, M. (2019). Impact of renewable energy consumption and financial development on CO2 emissions and economic growth in the MENA region: A panel vector autoregressive (PVAR) analysis. Renewable Energy, 139, 198–213. https://doi.org/10.1016/j.renene.2019.01.010
- Chenet, H., Zamarioli, L., Kretschmer, B., & Narvaez, R. (2019). From transformational climate finance to transforming the financial system for climate. Horizon Societal Challenge, 5.
- Chew, V. (2016). Singapore green plan. Singapore Infopedia. https://eresources.nlb.gov.sg/infopedia/articles/SIP_1370_2008-11-22.html
- Dai, X., Qian, S., & Zhang, J. (2022). Sustainable financial inclusion as a source of green environment? Evidence from selected regional comprehensive economic partnership countries. Economic Research-Ekonomska Istraživanja, 1–20. https://doi.org/10.1080/1331677X.2022.2035244
- Dorfleitner, G., & Grebler, J. (2022). Corporate social responsibility and systematic risk: International evidence. The Journal of Risk Finance, 23(1), 85–120. https://doi.org/10.1108/JRF-07-2020-0162
- Dou, D., & Li, L. (2022). Does sustainable financial inclusion and energy efficiency ensure green environment? Evidence from BRICS countries. Economic Research-Ekonomska Istraživanja, 1–16. https://doi.org/10.1080/1331677X.2022.2032785
- Dumitrescu, E. I., & Hurlin, C. (2012). Testing for Granger non-causality in heterogeneous panels. Economic Modelling, 29(4), 1450–1460. https://doi.org/10.1016/j.econmod.2012.02.014
- Endo, E. (1993). A method for evaluating effects of energy efficiency improvement on carbon dioxide emission reduction. Electrical Engineering in Japan, 113(6), 35–47. https://doi.org/10.1002/eej.4391130604
- Fareed, Z., Rehman, M. A., Adebayo, T. S., Wang, Y., Ahmad, M., & Shahzad, F. (2022). Financial inclusion and the environmental deterioration in Eurozone: The moderating role of innovation activity. Technology in Society, 69, 101961. https://doi.org/10.1016/j.techsoc.2022.101961
- Fareed, Z., Salem, S., Adebayo, T. S., Pata, U. K., & Shahzad, F. (2021). Role of export diversification and renewable energy on the load capacity factor in Indonesia: A Fourier quantile causality approach. Frontiers in Environmental Science, 434.
- Fatima, T., Shahzad, U., & Cui, L. (2021). Renewable and nonrenewable energy consumption, trade and CO2 emissions in high emitter countries: Does the income level matter? Journal of Environmental Planning and Management, 64(7), 1227–1225. https://doi.org/10.1080/09640568.2020.1816532
- Ferrat, Y., Daty, F., & Burlacu, R. (2022). Short- and long-term effects of responsible investment growth on equity returns. The Journal of Risk Finance, 23(1), 1–13. https://doi.org/10.1108/JRF-07-2021-0107
- Ielasi, F., Rossolini, M., & Limberti, S. (2018). Sustainability-themed mutual funds: An empirical examination of risk and performance. The Journal of Risk Finance, 19(3), 247–261. https://doi.org/10.1108/JRF-12-2016-0159
- Jarque, C. M., & Bera, A. K. (1987). A test for normality of observations and regression residuals. International Statistical Review/Revue Internationale de Statistique, 55, 163–172.
- Ji, X., Chen, X., Mirza, N., & Umar, M. (2021). Sustainable energy goals and investment premium: Evidence from renewable and conventional equity mutual funds in the Euro zone. Resources Policy, 74, 102387. https://doi.org/10.1016/j.resourpol.2021.102387
- Ji, X., Zhang, Y., Mirza, N., Umar, M., & Rizvi, S. K. A. (2021). The impact of carbon neutrality on the investment performance: Evidence from the equity mutual funds in BRICS. Journal of Environmental Management, 297, 113228.
- Jiang, C., & Ma, X. (2019). The impact of financial development on carbon emissions: A global perspective. Sustainability, 11(19), 5241. https://doi.org/10.3390/su11195241
- Kaiser, L., & Welters, J. (2019). Risk-mitigating effect of ESG on momentum portfolios. The Journal of Risk Finance, 20(5), 542–555. https://doi.org/10.1108/JRF-05-2019-0075
- Khan, M. K., Babar, S. F., Oryani, B., Dagar, V., Rehman, A., Zakari, A., & Khan, M. O. (2022). Role of financial development, environmental-related technologies, research and development, energy intensity, natural resource depletion, and temperature in sustainable environment in Canada. Environmental Science and Pollution Research International, 29(1), 622–638.
- Koenker, R., & Bassett, G. (1978). Regression quantiles. Econometrica, 46(1), 33. https://doi.org/10.2307/1913643
- Le, T.-L., Abakah, E. J. A., & Tiwari, A. K. (2021). Time and frequency domain connectedness and spill-over among fintech, green bonds and cryptocurrencies in the age of the fourth industrial revolution. Technological Forecasting and Social Change, 162, 120382.
- Lei, W., Xie, Y., Hafeez, M., & Ullah, S. (2022). Assessing the dynamic linkage between energy efficiency, renewable energy consumption, and CO2 emissions in China. Environmental Science and Pollution Research International, 29(13), 19540–19552. https://doi.org/10.1007/s11356-021-17145-7
- Li, C., Liu, X., Bai, X., & Umar, M. (2020). Financial development and environmental regulations: The two pillars of green transformation in China. International Journal of Environmental Research and Public Health, 17(24), 9242. https://doi.org/10.3390/ijerph17249242
- Li, J.-P., Naqvi, B., Rizvi, S. K. A., & Chang, H.-L. (2021). Bitcoin: The biggest financial innovation of fourth industrial revolution and a portfolio’s efficiency booster. Technological Forecasting and Social Change, 162, 120383. https://doi.org/10.1016/j.techfore.2020.120383
- Li, Y., Chen, J., & Sohail, M. T. (2022). Financial inclusion and their role in renewable energy and non-renewable energy consumption in China: Exploring the transmission channels. Research Square.
- Liu, H., Yao, P., Latif, S., Aslam, S., & Iqbal, N. (2022). Impact of Green financing, FinTech, and financial inclusion on energy efficiency. Environmental Science and Pollution Research International, 29(13), 18955–18966. https://doi.org/10.1007/s11356-021-16949-x
- Machado, J. A., & Silva, J. S. (2019). Quantiles via moments. Journal of Econometrics, 213(1), 145–173. https://doi.org/10.1016/j.jeconom.2019.04.009
- Martawardaya, B., Rakatama, A., Junifta, D. Y., & Maharani, D. A. (2021). Green economy post COVID-19: Insights from Indonesia. Development in Practice, 32, 1–9.
- Mirza, N., Naqvi, B., Rahat, B., & Rizvi, S. K. A. (2020). Price reaction, volatility timing and funds’ performance during Covid-19. Finance Research Letters, 36, 101657.
- Musah, M., Owusu-Akomeah, M., Kumah, E. A., Mensah, I. A., Nyeadi, J. D., Murshed, M., & Alfred, M. (2022). Green investments, financial development, and environmental quality in Ghana: Evidence from the novel dynamic ARDL simulations approach. Environmental Science and Pollution Research, 1–30.
- Naqvi, B., Mirza, N., Rizvi, S. K. A., Porada-Rochoń, M., & Itani, R. (2021). Is there a green fund premium? Evidence from twenty seven emerging markets. Global Finance Journal, 50, 100656. https://doi.org/10.1016/j.gfj.2021.100656
- Nazir, M. R., Nazir, M. I., Hashmi, S. H., & Fareed, Z. (2018). Financial development, income, trade, and urbanization on CO2 emissions: New evidence from Kyoto annex countries. Journal on Innovation and Sustainability. RISUS, 9(3), 17–37. https://doi.org/10.24212/2179-3565.2018v9i3p17-37
- Paramati, S. R., Shahzad, U., & Doğan, B. (2022). The role of environmental technology for energy demand and energy efficiency: Evidence from OECD countries. Renewable and Sustainable Energy Reviews, 153, 111735. https://doi.org/10.1016/j.rser.2021.111735
- Park, Y., Meng, F., & Baloch, M. A. (2018). The effect of ICT, financial development, growth, and trade openness on CO2 emissions: An empirical analysis. Environmental Science and Pollution Research International, 25(30), 30708–30719.
- Pesaran, M., & Smith, R. (1995). General diagnostic test for cross sectional independence in panel. Journal of Econometrics, 68(1), 79–113. https://doi.org/10.1016/0304-4076(94)01644-F
- Pesaran, M. H. (2006). Estimation and inference in large heterogeneous panels with a multifactor error structure. Econometrica, 74(4), 967–1012. https://doi.org/10.1111/j.1468-0262.2006.00692.x
- Pesaran, M. H. (2007). A simple panel unit root test in the presence of cross‐section dependence. Journal of Applied Econometrics, 22(2), 265–312. https://doi.org/10.1002/jae.951
- Pesaran, M. H., & Yamagata, T. (2008). Testing slope homogeneity in large panels. Journal of Econometrics, 142(1), 50–93. https://doi.org/10.1016/j.jeconom.2007.05.010
- Qin, L., Raheem, S., Murshed, M., Miao, X., Khan, Z., & Kirikkaleli, D. (2021). Does financial inclusion limit carbon dioxide emissions? Analyzing the role of globalization and renewable electricity output. Sustainable Development, 29(6), 1138–1154. https://doi.org/10.1002/sd.2208
- Rehman, M. A., Fareed, Z., Salem, S., Kanwal, A., & Pata, U. K. (2021). Do diversified export, agriculture, and cleaner energy consumption induce atmospheric pollution in Asia? application of method of moments quantile regression. Frontiers in Environmental Science, 9, 487. https://doi.org/10.3389/fenvs.2021.781097
- Rehman, M. A., Fareed, Z., & Shahzad, F. (2022). When would the dark clouds of financial inclusion be over, and the environment becomes clean? The role of national governance. Environmental Science and Pollution Research, 1–13.
- Sarkodie, S. A., & Strezov, V. (2019). A review on environmental Kuznets curve hypothesis using bibliometric and meta-analysis. Science of the Total Environment, 649, 128–145. https://doi.org/10.1016/j.scitotenv.2018.08.276
- Shah, M. H., Ullah, I., Salem, S., Ashfaq, S., Rehman, A., Zeeshan, M., & Fareed, Z. (2022). Exchange rate dynamics, energy consumption, and sustainable environment in Pakistan: New evidence from nonlinear ARDL cointegration. Frontiers in Environmental Science, 607.
- Shah, S. A. A., Shah, S. Q. A., & Tahir, M. (2022). Determinants of CO2 emissions: Exploring the unexplored in low-income countries. Environmental Science and Pollution Research, 1–9.
- Shahzad, U., Ferraz, D., Doğan, B., & Aparecida, D. (2020). Export product diversification and CO2 emissions: Contextual evidences from developing and developed economies. Journal of Cleaner Production, 276, 124146. https://doi.org/10.1016/j.jclepro.2020.124146
- Shahzad, U., Ferraz, D., Nguyen, H., & Cui, L. (2022). Investigating the spill overs and connectedness between financial globalization, high-tech industries and environmental footprints: Fresh evidence in context of China. Technological Forecasting and Social Change, 174(2), 121205. https://doi.org/10.1016/j.techfore.2021.121205
- Sharma, G. D., Ibrahim, M., Shahzad, U., Jain, M., & Chopra, R. (2021). Exploring the nexus between agriculture and greenhouse gas emissions in BIMSTEC region: The role of renewable energy and human capital as moderators. Journal of Environmental Management, 297(May), 113316. https://doi.org/10.1016/j.jenvman.2021.113316
- Shen, Y., Su, Z.-W., Malik, M. Y., Umar, M., Khan, Z., & Khan, M. (2021). Does green investment, financial development and natural resources rent limit carbon emissions? A provincial panel analysis of China. Science of the Total Environment, 755, 142538. https://doi.org/10.1016/j.scitotenv.2020.142538
- Sheraz, M., Deyi, X., Mumtaz, M. Z., & Ullah, A. (2022). Exploring the dynamic relationship between financial development, renewable energy, and carbon emissions: A new evidence from belt and road countries. Environmental Science and Pollution Research International, 29(10), 14930–14947.
- Song, Y., Chen, B., Tao, R., Su, C.-W., & Umar, M. (2020). Too much or less? Financial development in Chinese marine economic growth. Regional Studies in Marine Science, 37, 101324. https://doi.org/10.1016/j.rsma.2020.101324
- Su, C.-W., Khan, K., Umar, M., & Zhang, W. (2021). Does renewable energy redefine geopolitical risks? Energy Policy, 158, 112566. https://doi.org/10.1016/j.enpol.2021.112566
- Su, C.-W., Li, W., Umar, M., & Lobonţ, O.-R. (2022). Can green credit reduce the emissions of pollutants? Economic Analysis and Policy, 74, 205–219. https://doi.org/10.1016/j.eap.2022.01.016
- Su, C. W., Meng, X.-L., Tao, R., & Umar, M. (2021). Policy turmoil in China: A barrier for FDI flows? International Journal of Emerging Markets. https://doi.org/10.1108/IJOEM-03-2021-0314
- Su, C.-W., Song, Y., & Umar, M. (2021). Financial aspects of marine economic growth: From the perspective of coastal provinces and regions in China. Ocean & Coastal Management, 204, 105550. https://doi.org/10.1016/j.ocecoaman.2021.105550
- Su, C.-W., Xi, Y., Umar, M., & Oana-Ramona, L. (2022). Does technological innovation bring destruction or creation to the labor market? Technology in Society, 68, 101905. https://doi.org/10.1016/j.techsoc.2022.101905
- Tao, R., Su, C.-W., Naqvi, B., & Rizvi, S. K. A. (2022). Can Fintech development pave the way for a transition towards low-carbon economy: A global perspective. Technological Forecasting and Social Change, 174, 121278. https://doi.org/10.1016/j.techfore.2021.121278
- Tien, N. H., Phu, P. P., Phuc, N. T., Duc, L. D. M., & Thuc, T. D. (2019). Sustainable development and environmental management in Vietnam. International Journal of Research in Finance and Management, 3(1), 72–79.
- Umar, M., Ji, X., Kirikkaleli, D., Shahbaz, M., & Zhou, X. (2020). Environmental cost of natural resources utilization and economic growth: Can China shift some burden through globalization for sustainable development? Sustainable Development, 28(6), 1678–1688. https://doi.org/10.1002/sd.2116
- Umar, M., Ji, X., Mirza, N., & Naqvi, B. (2021). Carbon neutrality, bank lending, and credit risk: Evidence from the Eurozone. Journal of Environmental Management, 296, 113156.
- Umar, M., Rizvi, S. K. A., & Naqvi, B. (2021). Dance with the devil? The nexus of fourth industrial revolution, technological financial products and volatility spillovers in global financial system. Technological Forecasting and Social Change, 163, 120450. https://doi.org/10.1016/j.techfore.2020.120450
- Wang, K.-H., Umar, M., Akram, R., & Caglar, E. (2021). Is technological innovation making world “Greener"? An evidence from changing growth story of China. Technological Forecasting and Social Change, 165, 120516. https://doi.org/10.1016/j.techfore.2020.120516
- Wang, L., Ahmad, F., Luo, G., Umar, M., & Kirikkaleli, D. (2021). Portfolio optimization of financial commodities with energy futures. Annals of Operations Research, 1–39.
- Wei, J., Rahim, S., & Wang, S. (2022). Role of environmental degradation, institutional quality, and government health expenditures for human health: Evidence from emerging seven countries. Frontiers in Public Health, 10, 870767. https://doi.org/10.3389/fpubh.2022.870767
- Westerlund, J. (2007). Testing for error correction in panel data. Oxford Bulletin of Economics and Statistics, 69(6), 709–748. https://doi.org/10.1111/j.1468-0084.2007.00477.x
- Wood, R., & Garnett, S. (2010). Regional sustainability in Northern Australia – A quantitative assessment of social, economic and environmental impacts. Ecological Economics, 69(9), 1877–1882. https://doi.org/10.1016/j.ecolecon.2010.05.006
- World Bank. (2020). Global economic prospects, June 2020. The World Bank.
- Yang, J., Rizvi, S. K. A., Tan, Z., Umar, M., & Koondhar, M. A. (2021). The competing role of natural gas and oil as fossil fuel and the non-linear dynamics of resource curse in Russia. Resources Policy, 72, 102100. https://doi.org/10.1016/j.resourpol.2021.102100
- Yuen, B. (2008). Conclusion: Beyond sustainable development? In Spatial planning for a sustainable Singapore (pp. 205–209). Dordrecht: Springer.
- Yusof, R., Yusof, M. I. M., Ab Rahman, F. A., & Harsono, D. (2022). Review on Southeast Asian sustainable development goals (SDGs) localisation strategies. Environment-Behaviour Proceedings Journal, 7(19), 315–321. https://doi.org/10.21834/ebpj.v7i19.3260
- Zahoor, Z., Khan, I., & Hou, F. (2022). Clean energy investment and financial development as determinants of environment and sustainable economic growth: Evidence from. Environmental Science and Pollution Research International, 29(11), 16006–16016.
- Zaidi, S. A. H., Hussain, M., & Zaman, Q. U. (2021). Dynamic linkages between financial inclusion and carbon emissions: Evidence from selected OECD countries. Resources, Environment and Sustainability, 4, 100022. https://doi.org/10.1016/j.resenv.2021.100022
- Zaidi, S. A. H., Zafar, M. W., Shahbaz, M., & Hou, F. (2019). Dynamic linkages between globalization, financial development and carbon emissions: Evidence from Asia Pacific Economic Cooperation countries. Journal of Cleaner Production, 228, 533–543. https://doi.org/10.1016/j.jclepro.2019.04.210
- Zain, M. K., Otsuyama, M. S., & Shaw, R. (2022). Climate change adaptation in Myanmar. In Climate change adaptation in Southeast Asia (pp. 117–127). Singapore: Springer.
- Zakari, A., Khan, I., Tan, D., Alvarado, R., & Dagar, V. (2022). Energy efficiency and sustainable development goals (SDGs). Energy, 239, 122365. https://doi.org/10.1016/j.energy.2021.122365
- Zhang, Y.-J. (2011). The impact of financial development on carbon emissions: An empirical analysis in China. Energy Policy, 39(4), 2197–2203. https://doi.org/10.1016/j.enpol.2011.02.026