
 ?Mathematical formulae have been encoded as MathML and are displayed in this HTML version using MathJax in order to improve their display. Uncheck the box to turn MathJax off. This feature requires Javascript. Click on a formula to zoom.
Abstract
The well-functioning domestic institutions are very important for the global value chains to have its positive impact on environment. This article provides an empirical assessment of the impact of domestic institutional arrangements along the way to participate in global value chains on environmental performance index for sustainability goals for 41 Asian countries over 2001–2018 period. Most recent empirical studies assumes that causality runs to environmental measures through trade and governance but inverse relationship is also feasible and none of the previous studies have discussed about it. Using instrumental variable strategy to closing these gaps, we analyse the mechanism of direct and indirect impact of participation in global value chains on environmental performance index. Our results show that environmental performance index is negatively affected by participation in global value chains and this relationship overturns when participation in global value chains is accompanied by governance facilitation. Further, the findings suggest that governance-augmented participation in global value chains is a tool of environmental sustainability.
1. Introduction
Since last two decades, Asian economies become the centre of gravity by converting from one of the world’s poorest regions to its centre of economic gravity. Almost all Asian economies are now at least middle-income, yet they are also among the most heavily affected by natural hazards that become disasters and the most exposed to the consequences of climate change. In particular, when production sharing or business activities across the borders become popular in today’s global economy, it is much needed to discuss about the environmental consequences of participation in global value chains. Although advanced and developing countries alike are exposed to various types of environmental risk, the consequences tend to be more severe in developing countries, where it affect the long run development (Oosterhof, Citation2018). A recent report published by United Nations’ Sustainable Development Goals emphasizes the impact of GVCs on environment by arguing that global supply chain has an important role in pressing environmental stresses and social struggle.
The long term sustained development of Asian countries is on risk due to climatic change and environmental degradation. The roots of these environmental fluctuations do not happen in isolation, but linked to the fast economic activities. So for widely understanding the reasons of environmental changes, it requires multidimensional understanding. The carbon emission is increasing in line with GVCs participation in the Asia-Pacific region (Assamoi et al., Citation2020; Wu et al., Citation2020). There is another group of researchers who agree that renewable energy provides a solution to stimulate CO2 emission reduction. A widespread use of renewable energy resources and advancement of energy technologies are advantageous to decreasing CO2 emission (Gosens & Lu, Citation2013; Rafindadi & Ozturk, Citation2017). At the same time, it is argued that integration into GVCs ladder plays an important role in assessing and enhancing innovation abilities to develop an eco-technology and use of renewable energy resources (Matsuo & Schmidt, 2019). To address the environmental issues due to integration in GVCs of the Asia-Pacific has become a critical challenge in research, policy and practice.
For a sustainable global supply chain, it requires the countries to understand the missing factor that make the environment sustainable. Recently, the importance of institutions has been emphasized within the third dimension of sustainable development goals (SDG) regarding environmental sustainability and economic actors in any economy, e.g., industries and consumers—the supply and the demand regulate their behavior according to institutional requirements. Economically sustained economies are dependent on quality of the institution, the level of democracy and good governance are what make a country. Well-functioning domestic institutional arrangements can reduce the gap between environmental policies formulation and its implementation and also stability among environment and value chain activities. Instead, there is a growing attention to the importance of governance to manage the wide range of environmental challenges and impacts under growing global supply chain activities.
The contribution of this article to address the question that how the quality of current domestic institutions of the Asia-Pacific countries are effective in positively enhancing the relationship between GVCs participation and EPI. We will see the direct impact while interacting with participation in GVCs and indirect impact of governance for EPI by SYS-GMM while controlling for the endogeneity in an isolated way. For further understanding and robustness of the results, we will see the impact of the individual dimensions of governance to modify the role of participation in GVCs for EPI.
The article is structured as follows: Section 2 presents the brief literature review, Section 3 discusses data and methodology used, Section 4 presents the results interpretation and section 5 contains conclusion.
2. Literature review
A very few studies are available for the support of relationship between participation in GVCs and environment and also to back the role of institutions to modify its impact for environment. Dispersion of business activities across the borders and the natural environment are viewed as both conflicting and cooperative concepts. Previous researchers have doubts about this smooth relationship. They looked for the other related forces that bring the balance among the sustainable global supply chains of intermediate factors and environment. This section reviews the literature that has examined the relationship among institutions, participation in GVCs and environment.
Participation in global value chains has variety of impacts on environment. Wu et al. (Citation2020) concluded that GVCs policies lead to environmental damage in Asia-Pacific region. It is argued that policies aimed to protect environment from negative externalities of production sharing firms causes an increase participation in value chain activities through industrial innovations leads to environmental degradation. Davis and Caldeira (Citation2010) stated that accounting of CO2 emissions under production sharing activities demonstrates the potential of international trading of CO2 emissions. Besides, Meng et al. (Citation2015) and Spaiser et al. (Citation2019) considered that participation of developing countries in GVCs exported a large amount of final products in early stages of value-added activities produce a large amount of CO2 emissions and make them bear the degradation of their natural environment.
However, not all the impacts of participation in GVCs are equally harmful for environmental protection. Chiou et al. (Citation2011) argued that a close working relationship among supply chain partners promotes environmental friendly production innovations creating a better quality product advantage over rival firms across the borders. Khattak et al. (2017) concluded that a regular interaction among production sharing firms creates a knowledge spill over for innovated output resulting in environmental up gradation. Pathikonda and Farole (Citation2017) examined the impact of GVCs on environment and claimed that GVCs have changed the nature of international trade and offer opportunities for countries to raise productivity, access new production technologies and expand their exports without hurting their environment.
Then, researchers tried to make a link between environment and the different characteristics of institutions and end up with diverse results. Al-Mulali and Ozturk (2015) stated that political stability lessens environmental degradation in the long-run while other factors such as industrial development, trade openness and urbanization have negative impact on environment. There is a general perception that traditional energy utilization leads toward environmental cost in developing countries. To link the quality of institutions and energy consumption, Godil et al. (Citation2021) argued that an improvement in institutional quality in likely to decrease in energy consumption.
The importance of institutions for environmental maintenance has been growing with a positive outcome. Mavragani et al. (Citation2016) also concluded with a positive relationship between country’s economic growth, strong governance and environmental performance index. But they consider the linear indirect relationship of governance with EPI. Cheng et al. (Citation2021) measured the effect of environmental governance as proxy for environmental expenditure as a part of GDP expenditure and made a comparison between European and Asian countries. They conclude that the government should spend more on environmental related expenditures and must improve governance for sustainable growth of Asia. As governance is the important factor for making the other actors of sustainability interlinked, many researchers tried to measure its effect in different way. It is stipulated by many studies that the quality of domestic institutional arrangements is pivotal for protecting environment and sustainable business activities across the countries (Abid, Citation2017; Wang et al., Citation2021; Xu et al., Citation2019). Likewise the study of Nguyen and Su (Citation2021) associated the quality of institutions with environmental sustainability and concluded that regulatory quality, control of corruption, government effectiveness and rule of law are found to be supportive environmental sustainability.
3. Aggregate correlational relationship among variables
The value chain activities of the selected countries expanded relatively fast from 1995 to 2018, except 2008–2009 global financial crises followed by slow-down with a speedy recovery after the crises. We attempt to trace out the moderators of those global supply chain activities across the borders that could have damaging arrangements during this period. The trend of correlation of each factor which could have impact on EPI is reported in –6 and most of the patterns are noteworthy here. In fact, the previous theoretical literature suggests that the positive/negative correlations between our possible variables and EPI could arise for several reasons, including policy and non-policy measures for participation in GVCs impacts on environment. However, to discuss the correlational trends is not in the scope of our study but we find some interesting facts behind these aggregate correlational and linear and nonlinear relationships among the variables.
Figure 1. GVCs Participation Index and EPI across countries. Constant = 0.671, Coef = –0.0622, t-stat = 4.21, p-value = .000, R2 = 0.41, N = 738.
Source: Author's own creation.
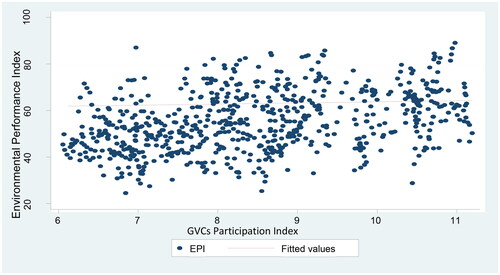
In , the aggregate relationship between participation in GVCs and environmental performance index (EPI) is presented for a cross section of 41 countries. The aggregate relationship suggests a negative relationship between GVCs and EPI since countries with higher level of participation in GVCs have a negative significant impact on their environmental performance. In particular, each additional percentage point increase in GVCs is associated with −0.06 percentage point degradation in their environment. This estimated result is statistically significant at 1% level, whereas the level participation explains about 41% of cross-country variance of their environmental performance.
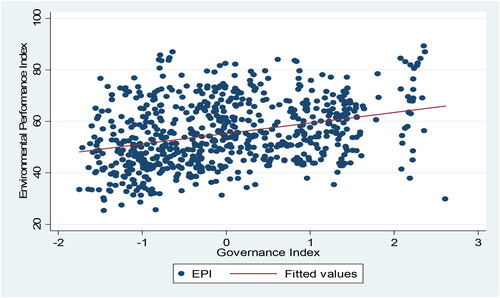
In , the aggregate relationship between governance and EPI score is presented for a cross-section of 41 countries. The results showing a positive aggregate relationship between governance and EPI. We can say that each additional change in governance quality would increase by 0.29 points increase in EPI. The point estimate is statistically significant at 1% and financial development explains 57% cross-country variance in environmental performance.
Figure 2. Governance index and EPI across countries. Constant = 0.612, Coef = 0.2901, t-stat = 4.87, p-value = .000, R2 = 0.57, N = 738.
Source: Author's own creation.
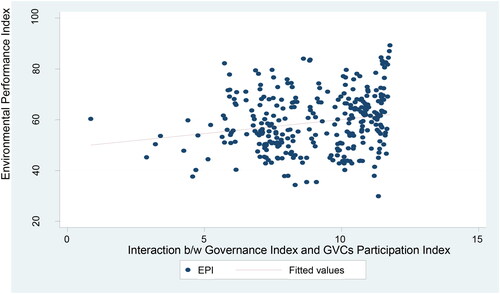
In , a graph is plotted between EPI and an interaction of governance index and GDP per capita to provide preliminary analysis of direct impact of governance on EPI through GDP across countries under analysis. The estimated results confirm a robust link each additional unit of interaction term is associated with 0.07 percentage points in EPI. The relationship is statistically significant at 5% and this direct relationship is tending to explain 73% variance in cross-country EPI.
Figure 3. Interaction between Governance and GVCs Participation Index and EPI across countries. Constant = 0.377, Coef = 0.0730, t-stat = 2.88, p-value = .049, R2 = 0.73, N = 738.
Source: Author's own creation.
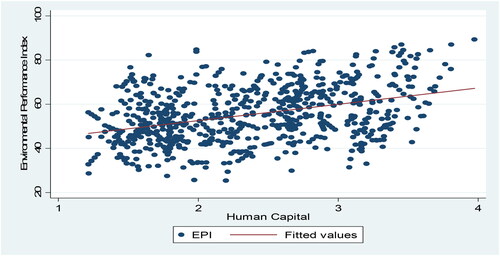
In , the aggregate relationship between human capital and environmental performance index is presented for a cross section of 41 countries. The aggregate relationship suggests a positive relationship between human capital and EPI since countries with higher human development could enjoy a significant environmental performance. In particular, each additional percentage point increase in HC is associated with 0.10 points increase in EPI. This estimated point is statistically significant at 1% level, whereas the level of Human capital explains about 14% of cross-country variance of EPI.
Figure 4. Human Capital and EPI across countries. Constant = 0.271, Coef = 0.1019, t-stat = 9.62, p-value = .000, R2 = 0.14, N = 738.
Source: Author's own creation.
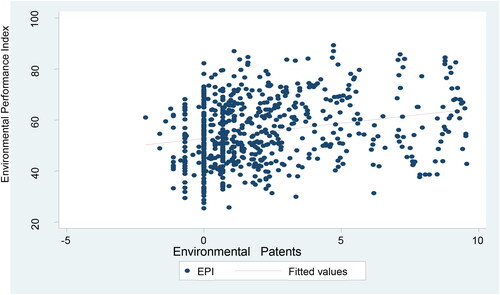
In , environmental technology (patents) is plotted against EPI to provide preliminary analysis of EPI and Impact of high technology research across countries under analysis. Each additional unit of environmental technology research associated with 0.13 percentage points increase in EPI. The relationship is statistically significant at 1% and high technology exports tend to explain 38% variance in cross-country environmental performance.
Figure 5. Environmental Patents and EPI across countries. Constant = 0.320, Coef = 0.1393, t-stat = 3.62, p-value = .004, R2 = 0.38, N = 738.
Source: Author's own creation.
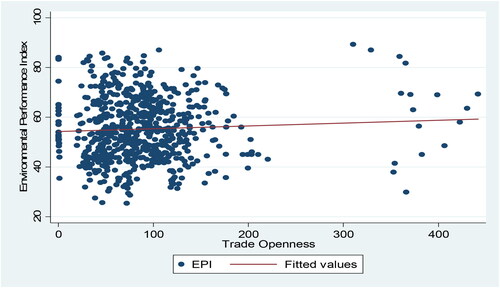
In , the aggregate relationship between trade openness and EPI is presented. From these results, we cannot infer any significant relationship between these two variables at this stage.
Figure 6. Tradeopenness and EPI across countries. Constant = 0.444, Coef = –0.0834, t-stat = 1.09, p-value = .785, R2 = 0.43, N = 738.
Source: Author's own creation.
After analysing the patterns of aggregate relationship in –6, we consider these variables as possible factors in emerging countries of Asia over the last two decades. A number of recent studies have examined the possible factors that could be the reason of climatic changes and environmental destructions. However, none of these papers suggested these policy and non-policy variables as the factors to affect the EPI while controlling for the problem of endogeneity for Asian countries.
4. Variables description and econometric methodology
4.1. Data and variables description
To meet the objectives of our study, we set a theoretical model where environmental performance index is our dependent variable and governance, GVCs participation, human capital development, environmental patents and trade openness are our independent variables. The explanation and data sources of the above mentioned variables are given below. Complete data description and variables construction has been provided in .
4.1.1. Environmental performance index
EPI is calculated by the Yale Centre for Environmental Law and Policy (YCELP), and it measures the environmental performance of 178 countries. It measures “a country's distance to target” and is calculated by two main indicators: Environmental Health with 30% weightage and Ecosystem Vitality (70%). EPI is a positive indicator and higher the value of index the better the country’s environmental performance. It’s quite popular in measuring environmental degradation because it is the most complete and appropriate indicator for the overall measurement of environmental performance.
4.1.2. Governance
For measuring the governance behaviour, we are using the composite index which we called WGI. Its consist of six indicators of governance covering over 200 countries and that are Voice and Accountability, Political Stability and Absence of Violence/Terrorism, Government Effectiveness, Regulatory Quality, Rule of Law and Control of Corruption. These indicators are based on different data sources, capturing governance perceptions as described by survey respondents, nongovernmental organizations, commercial business information providers and public sector organizations worldwide. Data has been taken from World Bank data base (2017).
4.1.3. GVCs participation index
As there is no direct statistical data for all the countries, so for measuring GVCs participation index we follow Koopman et al. (Citation2010) and the relevant data was obtained by following formula:
where
is domestic value added and
is foreign value added in country i at time t. DVX identify the share of domestic sector to the exports of other countries and is considered as a measure of forward participation. FVA identify the share of country’s exports with intermediate inputs produced in other countries and is considered as a measure of backward participation. The forward GVCs participation and backward GVCs participation gives us a comprehensive GVCs participation index of a particular country and
is gross exports.
4.1.4. Human capital development
We control for the human capital development as this variable is very important and has an effect on environmental sustainability as argued by Shahabadi (Citation2017). As the people with more education are additional conscious of and concerned about environmental issues so they tend to engage in actions that approve and support political decisions that protect the environment. So this article includes the Average Years of Schooling and the Average Return to Schooling in this index for our research purpose from the Penn world database (2017).
4.1.5. Environmental patents
Technological progress is an important factor that has the capacity for a sustainable environment. Policy maker consider innovations as important factor to be consider for climate change policy and regarded as a solution to overcome the problems of environment due to GVCs participation (Bretschger, Citation2015). So we have used the data of Total Patents Registered for Technology and Innovation Related to Environment) OECD database (2018).
4.1.6. Trade openness
This study considers the sum of export and import of goods and services measured as a share of GDP as a measure of trade openness. Many studies suggest a relationship between trade openness and environmental quality and results are quite diverse. Studies like Le et al. (Citation2016) stated that the impact of trade openness on the environment differs according to the income level of countries.
All the variables in this article were taken in log form to avoid heteroscedasticity and increase the consistency and reliability of the results.
4.2. Econometric methodology
Based upon the variables selected to test the proposed hypotheses, we defined the following Model (1) in which the environmental performance index is a function of the socioeconomic and institutional factors of a country. The purpose is to predict the impact of our explanatory variables, on a country’s environmental performance according to the environmental performance index.
Environmental Performance Index = f (human capital, trade openness, environmental patents, participation in GVCs, governance index)(1)
Model (1) can be estimated empirically with EquationEquations (2)(2)
(2) and Equation(3)
(3)
(3) :
(2)
(2)
(3)
(3)
where EPI is the environmental performance index;
is GVCs participation index;
is vector of our control variables;
is the world governance index, represented and made by Kaufman et al. (Citation2008) for the World Bank;
quadratic term for governance quality;
is the interaction term between GVCs participation and governance;
is the error term
The first step is to apply the principal component analysis (PCA) in order to compose the six governance indicators as done by Dragos et al. (Citation2017) to obtain the overall governance score, as WGI variable. Our method of PCA will be authenticated by few post and pre-estimation tests, such as the KMO value and the Bartlett’s test of spharicity and the Cronbach’s Alpha coefficient. The WGI will be computed by formula used by Dragos et al. (Citation2017), e.g., where
the coefficient is obtained through the principal component analysis and
is each of the six governance indicators. Second step is to analyze empirically the effect of governance and participation in GVCs on environmental performance.
To analyze empirically the effect of governance and participation in GVCs on environmental performance and income distribution in our panel dataset poses some econometric issues that can be illustrated in the context of a simple dynamic equation:
(4)
(4)
(5)
(5)
Here, K is a set of controlled variables and Z is a vector of our explanatory variables. The terms and
are, respectively, denote an unobserved common factor affecting all countries, and a country effect capturing unobserved country characteristics. The second equality follows from defining
and
For the above equations, E denotes environmental performance index (EPI). The EquationEquation (5)(5)
(5) , is a simplified version of the above expression with α = −1, so that the lagged dependent variable drops out from both sides.
Our EquationEquation (5)(5)
(5) estimation has potential problem of endogeneity of the regressors and it affects both the standard determinants of growth in K (e.g., variables such as human capital, environmental patents etc.) as well as the governance and GVCs measures in Z, since it can be argued that these are jointly determined with the rest of the economy’s endogenous variables. In the above equation, the lagged dependent variable
is also endogenous due to the country-specific effect issues.
For dealing with endogeneity, we need suitable instruments. However, apart from the terms of urbanization rate, FDI and population growth which we shall assume strictly exogenous, there are no exogenous variables at hand to build them, that is why we shall depend on internal instruments, as done by Arellano and Bond (Citation1991). For internal instruments we will take the lags of the variables. In principle, however, note that the presence of unobserved country characteristics likely means that and hence, lagged levels of the regressors are not valid instruments for EquationEquation (5)
(5)
(5) Therefore, we first eliminate the country specific effect by taking first-differences of EquationEquation (5)
(5)
(5) :
(6)
(6)
Assuming that the ε, time-varying disturbance is not serially correlated, secondly the explanatory variables are weak exogenous (i.e., they are uncorrelated with future realizations of the time-varying error term), our valid instruments are lagged values of the endogenous and exogenous variables. In equation form we can assume as:
(7)
(7)
(8)
(8)
These equations are defining the GMM-difference estimator conditions. But there are potential issues that when explanatory variables are determined over time, their lagged levels are weak instruments for the regression equation in differences (Alonso-Borrego & Arellano, Citation1996; Blundell & Bond, Citation1998). Then, due to the asymptotic variance of the estimator, small-sample biasness created.
To deal with these problems, now we will use a system estimator that combines both the regression in differences and in levels (Arellano & Bover, Citation1995; Blundell & Bond, Citation1998). The instruments for the regression in differences are the same as above. For the regression in levels its instruments are the lagged differences of the corresponding variables. These are better instruments under the additional assumption of no correlation between the differences of these variables and the country-specific effect. So our assumption
(9)
(9)
(10)
(10)
This leads to additional moment conditions for the regression in levels:
(11)
(11)
(12)
(12)
Using the moment conditions in EquationEquations (9)(9)
(9) –Equation(12)
(12)
(12) , we use a Generalized Method of Moments (GMM) method to get consistent estimates of the parameters of interest and their asymptotic variance-covariance (Arellano & Bond, Citation1991; Arellano & Bover, Citation1995). These are given by the following formulas:
(13)
(13)
(14)
(14)
where θ is the vector of parameters of interest (α, β), E is the dependent variable filled first in differences and then in levels, X is the explanatory-variable matrix including the lagged dependent variable
stacked first in differences, and then, in levels, W is the matrix of instruments derived from the moment conditions and
is a consistent estimate of the variance-covariance matrix of the moment conditions.
The consistency of the GMM estimators is validated by above moment condition. For over-identifying restrictions, we will use the test called Hansen test that examines the null hypothesis that the error term serially uncorrelated. In the system specification, we test whether the differenced error term (the residual of the regression in differences) shows second-order serial correlation. First-order serial correlation of the differenced error term is expected even if the original error term (in levels) is uncorrelated, until something unexpected happen. Second-order serial correlation of the differenced residual shows that the error term is serially correlated and monitors a dynamic average process at least of orders one. This will show that our projected instruments invalid (and would call for higher-order lags to be used as instruments). So far we have limited our regression to internal instruments. But for further checking that our results are correct and we are using proper instrument, we also test our equation with a set of external instruments (FDI, urbanization growth and population growth rate). Thus, in some regressions below, we drop all lags of the explanatory variables and substitute them with current and lagged values of these external variables.
After getting final reliable regression technique, from EquationEquation (5)(5)
(5) we tried to measure the linear relationship among governance, participation in GVCs and EPI. To add additional complexity to our model, we will run nonlinear regression as (direct relation) on our model by adding quadratic term to check the effect of governance level on improvement of environment of region. Then further for indirect effect of governance we will add the interaction term of governance and participation in GVCs indexes in order to enhance the capability of our controlled and explanatory variables to augment EPI.
5. Empirical results
For getting a composite index which is WGI we are applying the principal component analysis to construct such an overall governance index. By this way, we would be able to use the effect of all the dimensions of domestic institutions collectively. The results of our pre-estimation tests approve our data for principal component analysis. We obtained a value for the KMO of 0.8 ≫ 0.5, while the probability returned by the Bartlett’s test is 0.000 as KMO values between 0.8 and 1 indicate the sampling is adequate and for Bartlett test the significance should be less than 0.05, our value 0.000 showing that correlation between components are zero. The analysis gives us a single component by combining the six factors, allowing us to reach the main goal of the study. This component explains about 80% of the variance. The WGI scores were computed based on the following equation:
For our post-estimation test, we computed the Cronbach’s Alpha coefficient to account for the reliability of results. We obtained a value of 0.83 ≫ 0.7 (the reliability benchmark). Due to the fact that the principal component analysis gave a statistically significant index, we continued with model estimation to account for the influence of this index upon the environment performance index.
As noted, our strategy involves estimation of a governance-augmented environmental regression. Following Nadeem et al. (Citation2021), we use explanatory variables that include the GVCs participation and governance among the others. For our empirical experiments, we use unbalanced panel dataset for 2001 to 2018 period, with a total number of observations exceeding 730.
From , facts are revealing that there is wide dispersion in most of the variables used in the research: in GVCs participation index from 32.6885 to 81.2316 and environmental patents are also showing wide variations in values. On average, environmental performance index is 55.28, with a minimum value of 25.32 and a maximum value of 89.34.
Table 1. Descriptive analysis.
Before discussing the regression results, it is worth noting that the correlation between EPI and our explanatory variables are quite positive as shown by results.
Table 2. Correlation matrix.
describes the regression results obtained with our main model augmented by governance and participation in GVCs, using different estimation techniques. As simple pooled OLS estimators ignore both unobserved country specific and endogeneity problems of the regression so in column (1), we controlled for these issues. Using the country and time-fixed effect techniques, the signs of the coefficients of environmental performance determinants are positive as expected. This suggests that there is a positive relationship between variables. However, this regression’s diagnostic statistics show presence of considerable evidence of auto-correlation of the residuals that is the value of our second order correlation is 0.034. In column (2), we applied the time-effects. In column (3), we deliberated this subject by the difference GMM-IV estimator, with the lagged level of the explanatory variables as internal instruments. Slightly superior results are achieved with difference GMM estimator and coefficient of governance is still positive and significant. The coefficient of participation in GVCs is negative but significant. Both over identifying restrictions (Hansen test) and second order correlation (AR-2) tests are upgraded. But for the further enhancement of the results and dealing with the endogeneity problem, in column (4) and (5) we use the different methods of system GMM-IV. In column (4), we implemented the technique with only internal instrument (lagged levels and lagged difference of the explanatory variables). In column (5), we replaced the lagged values of explanatory variables with external instruments (lagged level of FDI). The latter technique should be helpful in dealing with the endogeneity issues. Results of the AR(2) and Hansen test in the column (5) confirm that this technique is a good choice for dealing with endogeneity issues with significance of the coefficients of our concern.
Table 3. Environmental sustainability, GVCs Participation and Governance: panel regression analysis using different estimation techniques.
As system GMM-IV is our reliable method of showing the relationship among the variables of sustainability. The coefficients of governance, participation in GVCs, GOV^2 and all our controlled variables in column (5) are significant and showing that these variables are significantly affecting our dependent variables and the coefficients of human capital and environmental patents and trade openness are improved significantly. This result show that one percent increase in participation in GVCs would bring 0.10 unit decrease in the EPI and this negative relationship is supported by theory of negative relationship between participation in GVCs and environment proposed by Wu et al. (Citation2020). The coefficient for our main variable is quite supportive and showing that one unit increase in governance would improve the EPI of the region by 0.16 percent point. This estimated coefficient of governance in our selected Asian countries has the highest coefficient among other variables in affecting the EPI.
As GMM is our reliable method to correlates linearly our explanatory variables with EPI. In order to understand the nonlinearity in the relationship, the higher order terms of governance are also incorporated in the model and the significance of this term in column (4) and (5) confirms the presence of non-linearity in the relationship. It can be observed from the results of column (5), the quadratic (GOVˆ2) term of governance in the model improving the EPI positively. So from this nonlinear regression analysis, the results are presenting the picture that if we improve the quality of current governance, then it has significant and improved impact on environmental performance along with other factors of sustainability. So from this further improvement in the quality of governance in the region, Asian countries are still having space to improve their governance quality. The coefficient of the governance is still larger in its influence on environment as compared to other variables. It is showing the significance of governance in attaining the healthy environment.
We also established the direct effect of governance on EPI by incorporating interaction term in the model. In column (6), by keeping other variables constant we interacts the governance with the participation in GVCs and estimation results of the interaction term of GVCs and governance is significantly positive. It is demonstrating that the interaction of governance modifies the GVCs impact for EPI by 0.23 percentage point positively. After interacting governance with GVCs, its impact on environment has become positive and coefficient has also improved. So it is supporting our hypothesis that the direct interaction of governance with participation in GVCs would be beneficial for environmental sustainability.
In , the relationship between GVCs participation while interacting with the components of governance and EPI has been considered. As in , the results are showing that GVCs participation of the selected countries is negatively impacting the environmental performance of Asian region but the results with a different approach shows that the coefficients of political stability (PS), government effectiveness (GE), rule of law (RL) and control of corruption (CC) when interacting with GVCs participation are robustly significant. To discuss the findings with individual dimensions of governance when interacting with GVCs participation is beyond to the scope of our analysis but these factors appear to capture the scope of governance to contribute for a modified role of GVCs participation to contribute for sustainable environment in selected countries. So the policy makers should be wise and clear about the intended and actual results of GVCs-augmented governance policy. On the basis of these robust findings we argue that domestic institutional arrangement for GVCs participation comes a sustainable environmental performance and these results are consistent over different model specifications.
Table 4. Participation in GVCs, individual dimensions of governance and environmental sustainability: panel regression with baseline specification using GMM SYSTEM.
In , the results for developed countries are as were expected that the highest and most significant positive impact on EPI is of the lag of dependent variable and human capital among the controls. Among others, trade openness and environmental patents also have positive and significant in both developed and developing. For developing countries we see that participation in GVCs has negative and significant impact on EPI and for developed countries it is positively significant that indicate a one unit increase in GVCs participation would bring 0.24 percentage point increase in EPI. Similarly, the coefficient of governance in both group of countries are indicating a positive impact on EPI but as expected, the coefficient of governance for developed countries is 65% higher as compare to developing countries. It is indicating that quality of governance in developed countries is better than developing countries to support environmental sustainability. In columns (3) and (4), the results under the mechanism of interaction of governance with participation in GVCs show that the coefficients of interaction term in developing and developed countries are positive and significant. Its value is larger in developed counties as compare to developing countries. The results stipulate that after interaction, there is tremendous increase in the coefficient of participation in GVCs in both cases. It further suggest that the institutional quality for sustainable business environment in developing countries is lower as compared to developed countries and global value chain activities of developing countries require a good quality of domestic institutional arrangements by improving their governance directly. We can also say that institutional quality and GVCs participation improved with high income levels. Further these results shows that developing countries are lagging in terms of sustainable value chain activities. The coefficients of interaction terms between governance and participation in GVCS in both column (3) and column (4) are showing positive and significant improvement in their values and these results stresses that in developing countries, there is still a gap to fill it with improving their domestic institutional arrangements for better and long term environmental sustainability under their fast pace of value added trade.
Table 5. GVCs participation, governance and environmental sustainability: panel regression analysis using GMM-IV.
6. Conclusion
In this article, we have provided an empirical evaluation of the impact of governance and its individual dimensions to modify the role of participation in GVCs in improving the quality of environmental performance in Asia. Our assessment is based on the estimation of GVCs-governance augmented model using data of a sample size of 41 countries over the 2001–2018 period and applying instrumental variable techniques to control for the potential endogeneity of governance augmented effects on environment for robustness checks.
The impact of governance on EPI in selected Asian countries is positive and significant and has the highest coefficient among variables affecting EPI but excessive participation in GVCs is detrimental to the environment, and increasing participation leads to decreasing comprehensive environmental performance. Moreover, for the interactive relationship, the coefficient of the GVCs participation is improved and positively affecting the EPI. The interaction between GVCs participation and governance results is showing that Asian region with its tremendous growth in value chain activities require an improvement in its governance for its long run value chains sustainability. Moreover, the separate analysis of developed and developing countries indicates that both groups of countries have space for improvement in their institutional quality for long term value chain activities. On the basis of our analysis we can conclude that developed countries are more capable to spend on environmental friendly technology for environmental protection, thereby enforcing regulations that result in ecological balance and their participation in GVCs.
This article could be of interest to policy makers and government authorities as well, as it highlights the importance of governance in different scenarios for improving the environmental performance in grouping with strong governance and environmental performance and consequently sustainable value chain activities. The weak governance could be among the main obstacle to achieving the 2030 Agenda for Sustainable Development in Asia. A stronger global production network under green investment plans can do little on its own to remove the obstacles to sustainable development, so policy priorities should consider redoubling efforts by playing direct active role in modifying the structure of the institutions such as by reducing corruption and bribery, passing rules and regulations that are designed suitably to achieve sustainable value added trade activities so that rules implementation in the country could be made.
Ethical approval and consent to participate
Not applicable. This manuscript does not contain any studies with human participants or animals performed by any of the authors.
Consent to publish
Not applicable. This manuscript does not contain any individual person’s data in any form.
Acknowledgement
We wish to thank anonymous referees for valuable comments and suggestions.
Disclosure statement
No potential conflict of interest was reported by the authors.
Additional information
Funding
References
- Abid, M. (2017). Does economic, financial and institutional developments matter for environmental quality? A comparative analysis of EU and MEA countries. Journal of Environmental Management, 188, 183–194. https://doi.org/10.1016/j.jenvman.2016.12.007
- Al-Mulali, U., & Ozturk, I. (2015). The effect of energy consumption, urbanization, trade openness, industrial output, and the political stability on the environmental degradation in the MENA (Middle East and North African) region. Energy, 84, 382–389. https://doi.org/10.1016/j.energy.2015.03.004
- Alonso-Borrego, C., & Arellano, M. (1996). Symmetrically Normalised Instrumental Variable Estimation Using Panel Data. Working paper 9612. Centro de Estudios Monetarios y Financieros, Madrid.
- Arellano, M., & Bond, S. (1991). Some tests of specification for panel data: Monte Carlo evidence and an application to employment equations. The Review of Economic Studies, 58(2), 277–297. https://doi.org/10.2307/2297968
- Arellano, M., & Bover, O. (1995). Another look at the instrumental variable estimation of error-components models. Journal of Econometrics, 68(1), 29–51. https://doi.org/10.1016/0304-4076(94)01642-D
- Assamoi, G. R., Wang, S., Liu, Y., Gnangoin, T. B. Y., Kassi, D. F., & Edjoukou, A. J. R. (2020). Dynamics between participation in global value chains and carbon dioxide emissions: Empirical evidence for selected Asian countries. Environmental Science and Pollution Research International, 27(14), 16496–16506.
- Blundell, R., & Bond, S. (1998). Initial conditions and moment restrictions in dynamic panel data models. Journal of Econometrics, 87(1), 115–143. https://doi.org/10.1016/S0304-4076(98)00009-8
- Bretschger, L. (2015). Energy prices, growth, and the channels in between: Theory and evidence. Resource and Energy Economics, 39, 29–52. 10.1016/j.reseneeco.2014.11.002
- Cheng, H., Kato, H., & Obashi, A. (2021). Is environmental tax harmonization desirable in global value chains?. The BE Journal of Economic Analysis & Policy, 21(1), 379–416.
- Chiou, T. Y., Chan, H. K., Lettice, F., & Chung, S. H. (2011). The influence of greening the suppliers and green innovation on environmental performance and competitive advantage in Taiwan. Transportation Research Part E: Logistics and Transportation Review, 47(6), 822–836. https://doi.org/10.1016/j.tre.2011.05.016
- Davis, S. J., & Caldeira, K. (2010). Consumption-based accounting of CO2 emissions. Proceedings of the National Academy of Sciences, 107(12), 5687–5692. https://doi.org/10.1073/pnas.0906974107
- Dragos, S. L., Mare, C., Dragota, I. M., Dragos, C. M., & Muresan, G. M. (2017). The nexus between the demand for life insurance and institutional factors in Europe: New evidence from a panel data approach. Economic Research-Ekonomska Istraživanja, 30(1), 1477–1496. https://doi.org/10.1080/1331677X.2017.1325764
- Godil, D. I., Sharif, A., Ali, M. I., Ozturk, I., & Usman, R. (2021). The role of financial development, R&D expenditure, globalization and institutional quality in energy consumption in India: New evidence from the QARDL approach. Journal of Environmental Management, 285, 112208. https://doi.org/10.1016/j.jenvman.2021.112208
- Gosens, J., & Lu, Y. (2013). From lagging to leading? Technological innovation systems in emerging economies and the case of Chinese wind power. Energy Policy, 60, 234–250. https://doi.org/10.1016/j.enpol.2013.05.027
- Kaufman, J. C., Plucker, J. A., & Baer, J. (2008). Essentials of creativity assessment (Vol. 53). Wiley.
- Khattak, A., Haworth, N., Stringer, C., & Benson-Rea, M. (2017). Is social upgrading occurring in South Asia’s apparel industry? Critical Perspectives on International Business, 13(3), 226–243. https://doi.org/10.1108/cpoib-11-2015-0051
- Koopman, R., Powers, W., Wang, Z., & Wei, S. J. (2010). Give credit where credit is due: Tracing value added in global production chains (No. w16426). National Bureau of Economic Research.
- Le, T. H., Chang, Y., & Park, D. (2016). Trade openness and environmental quality: International evidence. Energy Policy, 92, 45–55. https://doi.org/10.1016/j.enpol.2016.01.030
- Matsuo, T., & Schmidt, T. S. (2019). Managing tradeoffs in green industrial policies: The role of renewable energy policy design. World Development, 122, 11–26. https://doi.org/10.1016/j.worlddev.2019.05.005
- Mavragani, A., Nikolaou, I. E., & Tsagarakis, K. P. (2016). Open economy, institutional quality, and environmental performance: A macroeconomic approach. Sustainability, 8(7), 601.
- Meng, J., Liu, J., Xu, Y., & Tao, S. (2015). Tracing primary PM2. 5 emissions via Chinese supply chains. Environmental Research Letters, 10(5), 054005. https://doi.org/10.1088/1748-9326/10/5/054005
- Nadeem, M., Jun, Y., Niazi, M., Tian, Y., & Subhan, S. (2021). Paths of economic development: A global evidence for the mediating role of institutions for participation in global value chains. Economic Research-Ekonomska Istraživanja, 34(1), 687–708. https://doi.org/10.1080/1331677X.2020.1804426
- Nguyen, C. P., & Su, T. D. (2021). Tourism, institutional quality, and environmental sustainability. Sustainable Production and Consumption, 28, 786–801. https://doi.org/10.1016/j.spc.2021.07.005
- Oosterhof, P. D. (2018). Localizing the sustainable development goals to accelerate implementation of the 2030 agenda for sustainable development. www.adb.org.com
- Pathikonda, V., & Farole, T. (2017). The capabilities driving participation in global value chains. Journal of International Commerce, Economics and Policy, 08(01), 1750006. https://doi.org/10.1142/S1793993317500065
- Rafindadi, A. A., & Ozturk, I. (2017). Impacts of renewable energy consumption on the German economic growth: Evidence from combined cointegration test. Renewable and Sustainable Energy Reviews, 75, 1130–1141. https://doi.org/10.1016/j.rser.2016.11.093
- Shahabadi, A., Samari, H., & Nemati, M. (2017). the factors affecting environmental performance index (EPI) in selected OPEC countries. Iranian Economic Review, 21(3), 457–467.
- Spaiser, V., Scott, K., Owen, A., & Holland, R. (2019). Consumption-based accounting of CO2 emissions in the sustainable development Goals Agenda. International Journal of Sustainable Development & World Ecology, 26(4), 282–289. https://doi.org/10.1080/13504509.2018.1559252
- Wang, M. L., Ntim, V. S., Yang, J., Zheng, Q., & Geng, L. (2021). Effect of institutional quality and foreign direct investment on economic growth and environmental quality: Evidence from African countries. Economic Research-Ekonomska Istraživanja, 1–27.
- Wu, Z., Hou, G., & Xin, B. (2020). The causality between participation in GVCs, renewable energy consumption and CO2 emissions. Sustainability, 12(3), 1237. https://doi.org/10.3390/su12031237
- Xu, H., Jilenga, M. T., & Deng, Y. (2019). Institutional quality, resource endowment, and economic growth: Evidence from cross-country data. Emerging Markets Finance and Trade, 55(8), 1754–1775. https://doi.org/10.1080/1540496X.2018.1496418
Appendix
Table A1. Data description and variables construction