
 ?Mathematical formulae have been encoded as MathML and are displayed in this HTML version using MathJax in order to improve their display. Uncheck the box to turn MathJax off. This feature requires Javascript. Click on a formula to zoom.
Abstract
Risk allocation is a considerable part of public-private partnership (PPP) projects’ achievement during risk management. Regarding the complication of PPP projects, the difficulty of risk management, and the incomplete information of the project, it may be complicated to allocate risk factors with numbers, which may cause players’ hesitations, the poor performance of strategies, and the complexity of risk allocation process. To display the dynamic and the objective of risk allocation strategies, players prefer to take linguistic variables to depict their strategies. In this paper, we take the linguistic expression, the probabilistic linguistic terms with weakened hedges (P-LTWHs) to express players’ strategies. The P-LTWHs not only take the hedges of linguistic variables but also consider the probabilities of choosing the corresponding linguistic variables. With the perspective of viewpoints dynamics, we developed risk allocation models of the market risk with coordination game under the P-LTWHs environment. Finally, we give some suggestions of risk allocation models with P-LTWHs information.
1. Introduction
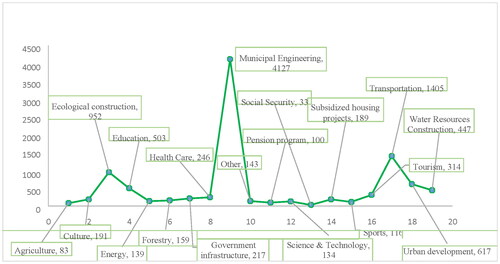
The public-private partnership (PPP) is described as a long term contract among participants, which takes financing, constructing, operating, and allocating risks for the concession period, then revert the project to the government (Hodge & Greve, Citation2018; Wang & Zhang, Citation2018). In China, there are three phases for the development of PPP models: (1) From the midst of the 20th century to the end of the 20th century, the opening project is the Shenzhen Shajiao B power plant. (2) From the 2000s to the 2010s, one of the famous projects is the Beijing Olympic Sports Stadium during this stage. (3) From 2013 to the present, it provides many guidelines to promote the productive progress of PPP projects. The PPP model is a considerable tool for public partners to invite private sectors to invest in public infrastructures (Song et al., Citation2018), which can not only diminish the financial burden but also improve the transformation of its functions (Hanaoka & Palapus, Citation2012). Hence, it has turned into a popular tool in many countries in establishing infrastructure projects (e.g. highways, bridges, subways, etc.) (Yu et al., Citation2018). According to the report of the China public-private partnerships center, there are 1036 projects have been scheduled, and the investment is CNY 8168 billion since the year 2014. Take the quarterly report for the first three quarters of 2021 as an example, the five most investment projects are: The transportation is CNY 1963 billion, the municipal engineering is CNY 1726 billion, the comprehensive urban development is CNY 343 billion, the other project is CNY 150 billion, and the affordable housing project is CNY 142 billion. In 2021, the top five novel PPP projects were municipal engineering, transport, education, ecological construction, and urban development, and the details are listed in . With the enormous investment and technology from the private entities, the policies from the public sectors, and the risk-sharing with other partners (Li et al., Citation2005), moreover, the attitudes of partners toward risk management are diverse in PPP projects (Sun et al., Citation2019). From the reasonable aim of view, various partners play different roles in a PPP project, i.e., the public partners prefer to establish an infrastructure project with the help of the private sector. On behalf of the private sectors, they could earn profits with the assist of the public (Ke et al., Citation2010). Because PPP projects have multi-partners and a long concession period, which produces many risk factors and generates the low efficiency of risk management, even harm partners’ benefits (Chen, Citation2020). For illustration, the lack of credit risk of the Hangzhou bay bridge, the market risk of the Beijing jing-tong expressway, and the policy risk of the Beijing Tenth water plant cause the failure of the PPP project. Only when all partners agree to the risk management alternatives, the project can proceed successfully, which meets the win-win rules (Lv et al., Citation2020). Hence, risk management is a considerable part of the success of a PPP project.
Figure 1. The number of novel projects for PPP library at the end of September.
Source: calculated from authors.
According to (Zhang et al., Citation2016), there are three main subjects in a PPP risk management field, i.e. identifying risk factors, evaluating risk factors, and allocating risk factors. Identifying risk factors is the key step in risk management. After identifying risk factors, it is fundamental to make assessments and analyses. At present, there are many types of research about identifying and evaluating risk factors. For example, the objectives of identifying risk factors (Wang & Zou, Citation2017), the methods of determining risk factors (eg. the Delphi method (Mahajan et al., Citation1976), the case analysis method (Qi et al., Citation2009), the fault tree analysis method (Yang & Zheng, Citation2009), and various rules for analyzing risk factors (Chapman, Citation2001; Maqbool & Rashid, Citation2017; Miller & Lessard, Citation2001; Ng & Loosemore, Citation2007). Evaluating risk factors is a significant step to associate the identifying stage and the allocating process. The AHP (Saaty, 1988), the Monte Carlo Simulation (Metropolis & Ulam, 1949), and the fuzzy sets (Ameyaw & Chan, Citation2016) assessed risk factors in some literature (Chen et al., Citation2021; Fattahi & Khalilzadeh, Citation2018; Liu et al., Citation2019; Rai et al., Citation2014; Wu et al., Citation2017). As part of this study, it is essential to study the rules of critical risk factors (CRFs), then the reasons include three aspects: Primary, allocating CRFs is a considerable step in risk management. Meanwhile, allocating CRFs aims to improve the performance of risk management. The allocating results for CRFs are significant for the progress in PPP projects (Zhang et al., Citation2021).
The failure of PPP projects can provide some suggestions for the construction of future projects. Qi et al. analyzed 16 failure PPP projects and believed that some risk factors may induce the failure of PPP projects, like the legal change risk, investment risk, and market risk (Qi et al., Citation2009). Take the Lintong line as an example, the dynamic of passenger flow may produce the uncertainty of market risk. At the same time, because of the incomplete information of projects, the long project life cycle, and the dynamic of risk factors, it is severe to make an available risk allocation alternative with numbers. So the first one to be promoted is the expression of the payment matrix. Perhaps the linguistic variables may be a better tool to indicate players’ strategies. Among the majority of risk allocation game models, most are centred on the utility of strategies or the changing of strategies. However, there is little research between the diversity and the consistency of points. Various points may cause different strategies. Concerning the influence of risk allocation, with the progressives of risk factors and the ambiguity of projects, the fuzzy numbers cannot effectively express experts’ evaluations(Wang et al., Citation2020). Hence, the aim of this paper concentrates on two aspects: (1) Select an efficient expression form to depict players’ strategies. Considering the diversity of linguistic variables, we take the complex linguistic expression, like P-LTWHs, to depict players’ strategies. (2) Study the influence of the diversity and the consensus of points for the coordination game model. The coordination game model will help players to achieve the consensus of points, while the diversity game model can keep the diversity of points.
The rest of the paper is organized as follows: Section 2 reviews some classical literature on risk allocation of the PPP project and the linguistic expressions. In Section 3, we discuss the methodology. Section 4 presents the research questions and summarizes our findings and analysis. Subsequently, some conclusions and future directions are drawn in Section 5.
2. Literature review
Risk management involves three steps: The identification process of risks, the evaluation process of risks, and the allocation process of risks. Risk allocation is a critical process for risk management, and even crucial for the success of PPP projects. Wang et al. believed that the excessive minimum revenue may both improve the financial pressure and decrease the willingness of public partners. Therefore, the reciprocal preference theory was proposed to measure the risk allocation ratio in terms of the principal-agent model, which can more effectively improve the efforts of both partners (Wang et al., Citation2018). To ensure revenue, a revenue-maximizing mechanism is developed. Especially, the revenue risk is decisive for the operation stage, which can directly affect the success of a project. Zhang et al. suggested a revenue risk allocation mechanism for the PPP projects to provide fair negotiations among partner, which can integrate the minimum revenue guarantee (Zhang et al., Citation2021). For a project life cycle, the project management triangle is time, cost, and quality. Then the safety performance is significant. Given this, it is essential to evaluate the performance of safety and effectively guarantee the process of projects. The lacking of analyzing risk factors will lead negative infections on safety performance. Xia et al. constructed a hybrid model, with Bayesian-network, to assess the performance of projects in connection with human factors analysis and classification system, and applied this model to a subway project (Xia et al., Citation2018). In light of different risks evaluation models and practical rules in risk management for China’s projects, Wang et al. developed a hierarchical analytical risk model and applied it to the assessment of a cross-sea route project. The results manifested that the government can make the threshold of experts to increase the rationality. Because of the geographical distribution and complexity, the risk management of the Belt and Road Initiative is complex than traditional projects. Andrí et al. established a method with fuzzy logic and probability theory to assess regional risk and total risk of different cities (Andri et al., Citation2019). To investigate the influence of transferring risk to the private partner and the moderate effects of environment governance between risk allocation and the investment of the private partner, Wang et al. applied the Tobit regression model with 4560 PPP projects from 2002 to 2015, the results displayed that the private partner prefers to invest a project with less risk and the environmental governance, which could reduce the influence of risk on the investment (Wang et al., Citation2019). From the above reviews, the existing research mainly focuses on the optimal mechanism of risk allocation, the study of special risk factors, like investment control risk and market risk, are few. This paper builds a coordination game model to distribute market risk between the government and the private sector.
Because of the complication of PPP projects, the professionals may prefer to give their assessments with abstract granules rather than numerical values during the process of risk allocation. To better depict risk knowledge, the method of computing with words (CWW) was applied to indicate decision makers’ evaluations (Zadeh, Citation1965). The advantages of applying CWW to depict experts’ views are listed two-fold: The initial one is that the CWW meets the knowledge of humans, which can reduce the ambiguity of decision-making information. On the other aspect, the CWW can express hesitation, uncertainty, and unknown situation during the risk allocation process. Up to now, many CWW techniques have advantages in solving decision analysis problems, i.e., the hesitant fuzzy linguistic term set (HFLTS) (Rodriguez et al., Citation2012), the probability linguistic term set (PLTS) (Pang et al., Citation2016), the linguistic terms with weakened hedges (LTWHs) (Wang et al., Citation2018) and the probabilistic linguistic terms with weakened hedges (P-LTWHs) (Wang et al., 2021). The HFLTS deals with the hesitation situation in terms of comparative linguistic expressions. The PLTS demonstrates the possibility of professionals’ views with CWW. The LTWHs represent the weakened hedges during the decision analysis process. The P-LTWHs not only show the weakened hedge degrees but also reveal the possibilities of ambiguity. In realism, these methods are appropriated to indicate decision makers’ views. At present, the existing research of risk allocation focus on real numbers, which may not better convey partners’ viewpoints. Regarding the dynamic of a project life cycle, the uncertainty of risk occurs, and the incomplete information, the linguistic expression may be better to manifest players’ evaluations rather than real numbers. For instance, the private partner intends to choose a proper risk allocation alternative. According to professionals’ discussions, the private partners express their satisfaction levels with real numbers, if a partner believes that the suitable degree of the risk allocation alternative can be evaluated with 7 and 9 (the score is 0-10), then whether 7 or 9 is better to this alternative, which may cause hesitations. Given this, the evaluation can be displayed by the HFLTS, like (i.e., ordinary or fair or very fair), or the result is expressed by the PLTS, like
(i.e., the ordinary degree is 0.4, the fair degree is 0.35, and the very fair degree is 0.25), even LTWHs, like
(i.e., more or less fair), or even P-LTWHs, like
(i.e., the probability is 0.45 if the result is more or less fair, and the possible degree is 0.55 with the evaluation roughly ordinary). Through this example, different techniques have distinct advantages during decision analysis process. For efficient handling of linguistic expressions in decision analysis, comparisons between these methods are essential. The results are presented in .
Table 1. The comparison of different techniques.
On the grounds of the exceeding analyses, we can specify some consequences as reflected: (1) The HFLTSs can indicate information with linguistic variables and also consider the atomic terms, but these variables may not match professional’ regards. For significant, the HFLTS cannot superior depicts the weights of decision makers’ views during the decision analysis process. (2) The PLTS presents some possible linguistic values and displays the probabilistic knowledge of values (Pang et al., Citation2016). However, the hedges process are neglected by PLTS during the decision analysis process. (3) The LTWHs indicate information with the atomic term and weakened hedges, which has beneficial in depicting undetermined levels. However, the LTWHs may ignore potential degrees during express information. (4) The P-LTWHs not only take the merits of PLTSs but also consider the advantages of LTWHs, which can demonstrate possible degrees of linguistic terms and depict information with hedges, like the weakened hedges and intensified hedges. At the same time, the P-LTWHs can display partners’ hesitation during risk allocation process, which can decrease the uncertainty of evaluations, and improve the risk allocation efficiency.
Hence, we select P-LTWHs to illustrate decision analysis information. The P-LTWHs indicate the decision information, which considers the weakened hedges and possible degrees. Besides, the decision information is calculated by a mathematical model which provides a means for managing a quantitative model to handle decision information.
This paper aims to build two risk allocation schemes of market risk with the coordination game model under the P-LTWHs environment. The contributions of this paper are listed as follows:
In the theoretical part, the P-LTWHs are referred to indicate fuzzy information. The P-LTWHs not only take hedges to express partners’ hesitation but also display the hesitant degrees with probability theory. Besides, the market risk depends on the passenger flow, which is related to many factors, i.e., the peak period, the bad weather condition, the holidays etc. Given this, it is essential to express partners’ various strategies with P-LTWHs instead of numbers.
In this paper, we apply two perspectives of the coordination game theory to deal with risk allocation problems: preference view and equivocators. The coordination game model with opinion preference can indicate partners’ preferences to different revenue during making strategies. The equivocators with coordination game models consider the hesitation of partners in a dynamic game process. We can further analyze the outcomes of different strategies with the coordination game model to construct an efficient risk allocation model.
3 Methodology
3.1. The probabilistic linguistic terms with weakened hedges
Before giving the concept of P-LTWH, it is essential to display the linguistic expressions, LTWHs. According to Wang et al. (Wang et al., Citation2019), the LTWH is indicated by a linguistic term and a weakened hedge. And the expression is
(1)
(1)
where the linguistic term set (LTS) is indicated by
and the weakened hedge set (WHS) is expressed by
Then, a P-LTWH can be defined by the mathematical symbol Wang et al. (Citation2020):
(2)
(2)
where
is the number of all different linguistic terms in
Example 1.
Suppose the WHS and the LTS
thus the P-LTWH is expressed by
The meaning is that if the LTWHs are
(i.e., ‘definitely middle’) and
(i.e., ‘more or less high’), then the probabilities are 0.4 and 0.6,.
Given and
comparing different P-LTWHs is indispensable. However, there are two conditions during the comparing process: (1) If
in a P-LTWH, it is necessary to deal with ignorance. (2) If
it is difficult to compare the two. To ease the comparison process, normalization steps are necessary. For convenience, the symbol of normalization P-LTWH is
thus the normalization can be listed by two steps:
If
next we calculate
If
Example 2.
Given two different P-LTWHs, and
According to the steps of normalization, we have
Based on the normalization of P-LTWHs, it is necessary to review the related operational rules. Let be three normalized P-LTWHs, then have:
After presenting the operational rules of normalized P-LTWHs, the comparison methods of various P-LTWHs are attached to characters of the LTS and the WHS. Let and
be two P-LTWHs, the comparison processes are listed as follows:
If
If
If
if
if
if
3.2. The coordination game model
For a PPP project, the partners’ strategies will influence the constructing of risk allocation. Therefore, the coordination game considers partners’ preferences during risk allocation process. For objectivity and scientificity, the following assumptions are given as follows:
Assumption 1: There are two players in the game model, the government (G) and the private (P), which are the bounded rational players. The bounded rationality player can make decisions in connection with bounded information, bounded time, and uncertain revenue. The construction environment ensures the rationality of the bounded rationality assumption. There is a range of uncertain conditions which is related to a risk allocation process, such as the occurrence of a risk, the negative effects, and the dynamic nature of the construction process.
Assumption 2: The partners have three strategies for risk allocation: The allocation behavior (A), means that the partner chooses a certain allocation degree to ensure the revenue and guarantee the process of a project; the non-allocation behavior (NA) indicates that the partners refuse to allocate risk factors with other partners; the hesitation behavior (H) means that partners do not prefer to choose allocation or non-allocation. Then the set of strategies are (A, NA, H).
Assumption 3: Some factors may be ignored in terms of the core of simplifying variables for bounded rationality. This paper will not take alterations in policy and environment into account when allocating risk. For the changing of policy, the market risk has few relations to policy, which may not have significant effects on the risk allocation process. The market risk indicates the operational stage, which has a connection to passenger flow and the subsidy methods. Then the environment may not have significant effects on market risk. Therefore, we assume that the changing of policy and the environment cannot affect the risk allocation process.
After giving these assumptions, it is essential to construct the payoff matrix for opinion preference and the equivocators of the coordination game. The details are listed in and . And the relevant parameter of the payoff matrix are displayed as follows: F–the revenue of partners from the environment, economic and social; –the revenue of other parts; C–the cost of risk allocation; δ–the preference degree of allocation; r–the similarity degree between hesitant and allocation. The replicator dynamic equations for the government and private partners are listed as follows ():
Table 2. The payoff matrix with preference view.
Table 3. The payoff matrix with equivocators.
Table 4. The risk allocation of CRFs.
For the preference views, xA is the probability of partners choosing allocation.
For the equivocators,
where
Let and
then we have six equilibrium points: (0, 1, 0), (0, 0, 1), (1, 0, 0),
and
4. The study of the lintong line
A study of the Lintong line will corroborate the performance of the coordination game model in this section. The reasons for choosing the Lintong line include two aspects: (1) The Lintong line is a provincial demonstration project in Shaanxi province, which means the importance of the project, and displays the structural reasonable of this project. The Lintong line is an outlying and a tourist traffic line, which means that the peak hours are differ from the main urban area. Then the analysis of market risk may be different from other lines. (2) The Lintong metro line has some advantages in the environment, economic, and social, like saving energy, protecting the environment, bringing commercial and property development of the route, and reducing traffic congestion and traffic accidents, etc.
4.1. The background of the lintong line
Xi’an metro line 9 is also known as the Lintong line, which is referred to as the Lintong line in this paper. The first stage starts from Textile city station to Qinhan Avenue station, and the total length is about 25.2 km, with 15 stations. The initial investment of the first-phase project for the Lintong line is about 14.428 billion CNY. The franchise period of the Lintong line is 30 years, 4 years for the construction period, and 26 years of operation. In this paper, we take the CRFs as an example, which needs to be allocated by two partners during the operation stage.
In the Lintong line, the Xi’an Municipal government, which is referred to as the Municipal government. intimates the roles of various partners of the Lintong line. Thus, the roles of partners are listed as follows:
Figure 2. The partners structure of the Lintong line.
Source: calculated from authors.
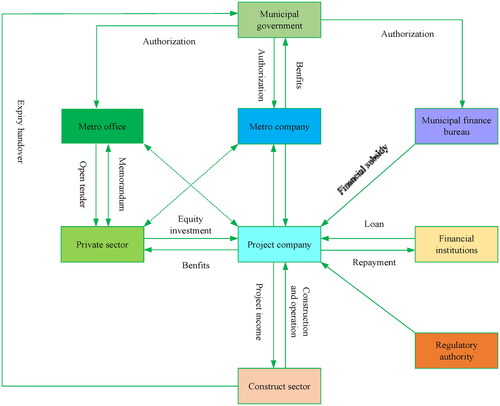
The implementation agency is the municipal metro office and the municipal metro office is the implementing agency in this project. The metro office sign the negotiation memorandum with the private sector who won the bid.
The metro company cooperated with the private sector to establish a project company in terms of equity. The metro company holds 40% of the shares, and the rest portions belong to the private sector.
After building the project company, the metro office and the project company sign a franchise agreement. The period contains four years, which is the building stage, the rest 26 years is the operational stage. After 30 years, the project company must transfer all assets of the project to the municipal government.
4.2. The risk allocation of the lintong line
Corresponding to the structure of risk allocation, the project feasibility study report, and the guidelines of risk allocation, illustrates the CRFs of the Lintong line. In this paper, we evaluate CRFs that require to be allocated by two sectors. According to , it is obvious to notice that the ‘investment control risk’ in the construction stage, and the ‘market risk’ of the operation stage, need to be analyzed. It details the reasons in two aspects: (1) From the risk allocation model perspective, the relevant sectors allocate CRFs, so the partners will share CRFs in terms of the risk allocation rules. The risk allocation rules include (a) The most reasonable partners allocate risk factors; (b) The share of risk should be matched with the benefits; (c) There must be an upper limit on risk allocation for the partners. (2) From the game theory model, the probable movement intends to express the CRFs that need to be allocated by various participants during various stages, and illustrated the allocating degrees with P-LTWHs. Thus, we take the market risk as an illustration.
Corresponding to the study report of the Lintong line, the public and the private partner will allocate the market risk. The sectors may be hesitant about various actions. Referring to that, we consider the opinion preference and equivocators, then the conditions are listed as follows:
Input: The payoff decision matrix of risk allocation.
Output: The equilibrium solution.
Step 1. Construct the P-LTWHs in the risk allocation environment. The allocation willingness is depicted with the complex linguistic expressions, where the LTS is:
And the WHS is:
Step 2. Define the benefits and cost of different players during the risk allocation process. According to the Lintong line, displays the benefits from three aspects.
Conferring to the punishment rules, demonstrates the cost, which varies with the willingness of allocation in terms of the value for the money evaluation report of the Lintong line. It specifies the cost of partners in three aspects: the equity investment expenditure, the operating subsidy expenditure, and the risk-sharing expenditure. In the Lintong line, the public holds 40% of equity investment, the rest 60% belongs to the private sector.
Step 3. Build the coordination game models of market risk. With Section 3.1, displays the integrated information of benefits and costs.
Table 5. The benefits of different partners in three aspects.
Table 6. The cost of partners in three aspects.
Table 7. The data of different partners in allocating market risk.
For the convenience of calculating payoffs, we assume that the utility of P-LTWHs is in connection with the characteristics of LTS and WHS. Then the mathematical expression is expressed as follows:
where p is the probability of P-LTWHs, t comes from
α is the value of
Therefore, the matrix of preference views and equivocators are listed in and .
Table 8. The payoff matrix with preference view.
Table 9. The payoff matrix with equivocators.
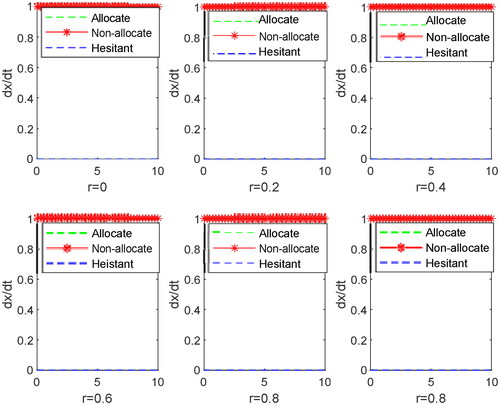
and display the evolution phase diagram of the dynamic equation for two partners with preference views, then we have the subsequent conclusions:
Figure 3. The dynamic graph with preference view game model of the government.
Source: calculated from authors.
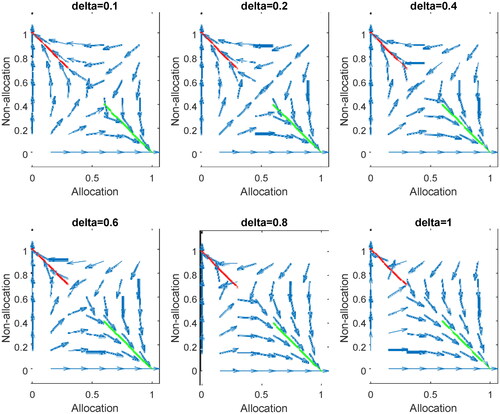
Figure 4. The dynamic graph with preference view game model of the private.
Source: calculated from authors.
demonstrates the evolution diagram of the dynamic equation of the government. The ESS points change with the increasing of δ. The red and the green lines are two special solutions. There are three ESS points (0, 1), (1, 0), and
display that the dynamic evolution graph of the private. For the private partner, the
From and , the partners’ preference views are different from each other. In the beginning, the government preference is not clear, while the private partner’s preference is non-allocation. With δ increasing, the government prefers allocation rather than non-allocation, which is same as the private partner. The results mean that the two partners reached a consistency strategy: (Allocation, Allocation). For a PPP metro line project, the market risk occurrence may cause the adverse effects of risk management, like the operating process, the dynamic of passenger flow, the revenue of two partners, etc. For that reasons, it is optimal for partners to choose allocation, which could not only process the risk management process but also ensure the benefits of partners.
After analyzing the preference view matrix, the partners may be hesitant to different views, which may have various effects on partners’ strategies. Therefore, it is essential to analyze the condition of equivocators for partners. Then the details are listed as follows:
According to Section 3.2, manifests the payoff matrix with equivocators. indicates the dynamic graph of the government with equivocators. The dynamic of r cannot cause the changing of fixed points. The dynamic system will keep steady to one of the statutes of allocation, non-allocation, and hesitation. From , it is essential to find that the government preference is non-allocation, which is strenuous to keep steady. The changing of r does not influence the dynamic graph of the private with equivocators. For a metro line, the market risk is related to the revenue of partners, the progress of the project, and the development of the surrounding economy. For , the hesitant view has a greater relation to non-allocation than allocation. The result manifests that the equivocator’s game model will promote the selection of the non-allocation strategy. Therefore, the equivocator game model is not an efficient one for the risk allocation process.
Figure 5. The dynamic graph with equivocators game model of the government.
Source: calculated from authors.
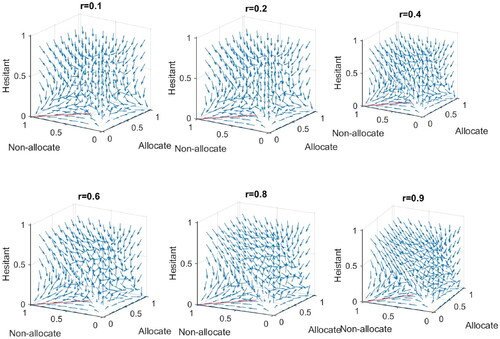
Figure 6. The dynamic graph of the government with equivocators model.
Source: calculated from authors.
4.3. Comparative and analyses
Referring to the background of the Lintong line, the allocation of the market risk is indicated by the coordination game with preference view and equivocators, respectively. For the preference view and the equivocators, the dynamic graph of two partners are different. To analyze the impacts of the preference view and equivocators co-exist for a game model, we build a game model in , and the payoff matrix is constructed in . Then the details are listed as follows:
Table 10. The matrix with preference view and equivocators.
Table 11. The payoff matrix with preference view and equivocators.
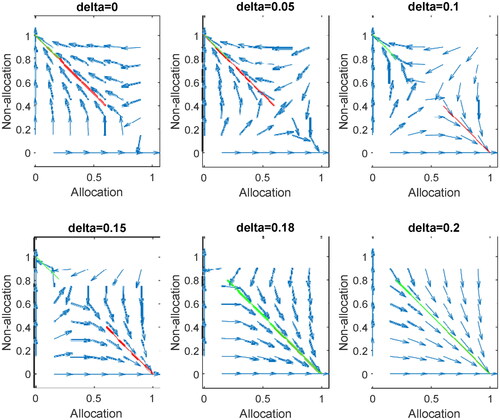
After calculating , and displayed the dynamic graph of partners with preference view and equivocators. And the analysis processes are listed as follows:
Figure 7. The dynamic graph with preference view and equivocators game model of the government.
Source: calculated from authors.
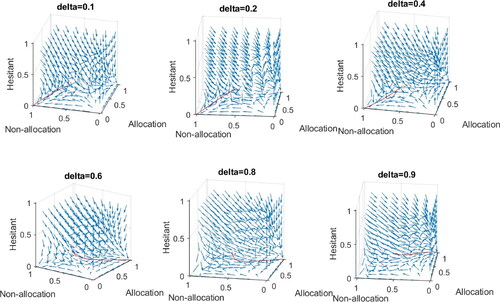
Figure 8. The dynamic graph with preference view and equivocators game model of the private.
Source: calculated from authors.
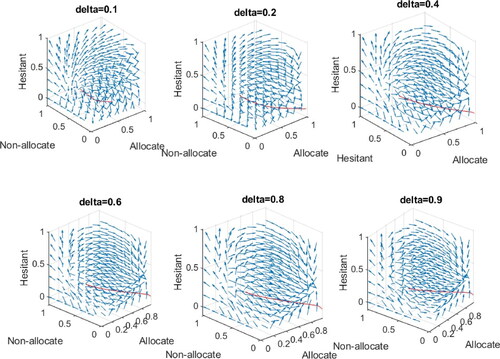
As shown in . In the government dynamic, there are various variables to consider, such as δ and r. Compared with and , the government prefers allocation rather than other views with increasing of δ. The government’s preference turned from non-allocation to allocation for preference view. For the equivocators, the system will keep steady to allocation, non-allocation, and hesitation. For the game model with preference view and equivocators, the system will keep steady to allocation, non-allocation, or hesitant. Most importantly, the multi-views of the dynamic graph cannot exist during risk allocation. From partners’ views, the multi-views may not be better to their revenues. As the allocation or non-allocation will help partners to construct the optimal strategy.
For . the dynamics of a private graph depend on changes in δ and r. The red line is the dynamic of the special solution. The system will keep steady on allocation, non-allocation, or hesitation. Due to the dynamic of δ and r, the system cannot coexist with multi-views. Especially, if
Unlike a game model with preferences or equivocators, in a system with preference view and equivocators, the dynamism will be affected by δ and r. For the Lintong line, the market risk is related to the passenger flow and the subsidy methods. Private partners will experience the effect of passenger flow, and the government will decide its strategy based on its subsidy methods. Hence, the risk allocation strategies of the private and the government are a dynamic process, which will be affected by partners’ preferences.
5. Conclusions
Given the significance of risk allocation for a PPP project, this paper has addressed two kinds of coordination game models to allocate market risk under the P-LTWHs environment. According to the characters of the P-LTWHs, the complex linguistic expression, the P-LTWHs is a productive way to establish decision makers’ evaluations under the indeterminate environment. Because of the complexity of the subsidy methods, the imprecise of the passenger flow, and the dynamic of the operational stage, the P-LTWHs have been employed to estimate experts’ actions. As opposed to the system of equivocators or the system with preference view and equivocators, the system of preferred view game model can more accurately indicate partners’ preferences. Besides, the market risk is related to the passenger flow and the subsidy methods, which will affect the risk allocation strategies of the private and the public. Then the efficient risk allocation model can help partners to improve the efficiency of risk management. However, the proposed approach has some limitations in some aspects: For the P-LTWHs itself, the linguistic hedges should be classified based on linguistic knowledge and professionals’ perspectives during the decision analysis process. The coordination game model only focuses on the preference view or equivocators statues, which may affect the strategies of partners. Hence, the limitations of this proposed model provide some open issues for future research: (1) In the decision analyses processes, the professionals may not only employ P-LTWHs or PLTSs to express their viewpoints. Perhaps the hybrid linguistic expressions may be a suitable tool that matches the characteristics of linguistic and semantics for a risk allocation process. Therefore, it is an interesting topic to convert regular linguistic forms into ambiguous or hybrid expressions to evaluate alternatives. (2) The conversion of P-LTWHs may be determined by data mining, which can decrease the information loss, and it is convenient to calculate the process. (3) With the perspective of different partners, it is essential to apply the evolutionary game model or quantum game model to construct an optimal risk allocation model.
Additional information
Funding
References
- Ameyaw, E. E., & Chan, A. P. C. (2016). A fuzzy approach for the allocation of risks in publicprivate partnership water-infrastructure projects in developing countries. Journal of Infrastructure Systems, 22(3), 04016016–04016013. https://doi.org/10.1061/(ASCE)IS.1943-555X.0000297
- Andri, J. M., Wang, J. Y., Zou, P. X. W., Zhang, J. R., & Zhong, R. Y. (2019). Fuzzy logicbased method for risk assessment of belt and road infrastructure projects. Journal of Construction Engineering and Management, 145(12), 04019082. https://doi.org/10.1061/(ASCE)CO.1943-7862.0001721
- Chapman, R. J. (2001). The controlling influences on effective risk identification and assessment for construction design management. International Journal of Project Management, 19(3), 147–160. https://doi.org/10.1016/S0263-7863(99)00070-8
- Chen, B. (2020). Optimal capital structure of government-subsidized private participation in infrastructure projects. The Engineering Economist, 65(4), 321–338. https://doi.org/10.1080/0013791X.2019.1707923
- Chen, L., Lu, Q., Li, S., He, W., & Yang, J. (2021). Bayesian Monte Carlo simulationdriven approach for construction schedule risk inference. Journal of Management in Engineering, 37(2), 04020115. https://doi.org/10.1061/(ASCE)ME.1943-5479.0000884
- Fattahi, R., & Khalilzadeh, M. (2018). Risk evaluation using a novel hybrid method based on FMEA, extended MULTIMOORA, and AHP methods under fuzzy environment. Safety Science, 102, 290–300. https://doi.org/10.1016/j.ssci.2017.10.018
- Hanaoka, S., & Palapus, H. P. (2012). Reasonable concession period for build-operate-transfer road projects in the Philippines. International Journal of Project Management, 30(8), 938–949. https://doi.org/10.1016/j.ijproman.2012.02.001
- Hodge, G., & Greve, C. (2018). Contemporary public-private partnership: Towards a global research agenda. Financial Accountability & Management, 34(1), 3–16. https://doi.org/10.1111/faam.12132
- Ke, Y. J., Wang, S. Q., Chan, A. P. C., & Lam, P. T. (2010). Preferred risk allocation in China’s public-private partnership (PPP) projects. International Journal of Project Management, 28(5), 482–492. https://doi.org/10.1016/j.ijproman.2009.08.007
- Li, B., Akintoye, A., Edwards, P. J., & Hardcastle, C. (2005). Critical success factors for PPP/PFI projects in the UK construction industry. Construction Management and Economics, 23(5), 459–471. https://doi.org/10.1080/01446190500041537
- Liu, Y. T., Zhang, H. J., Wu, Y. Z., & Dong, Y. C. (2019). Ranking range based approach to MADM under incomplete context and its application in venture investment evaluation. Technological and Economic Development of Economy, 25(5), 877–899. https://doi.org/10.3846/tede.2019.10296
- Lv, J., Zhang, Y. Y., & Zhou, W. (2020). Alternative model to determine the optimal government subsidies in construction stage of PPP rail transit projects under dynamic uncertainties. Mathematical Problems in Engineering, 2020, 1–12. https://doi.org/10.1155/2020/3928463
- Mahajan, V., Linstone, H. A., & Turoff, M. (1976). The Delphi method: Techniques and applications. Journal of Marketing Research, 13(3), 317–318. https://doi.org/10.2307/3150755
- Maqbool, R., & Rashid, Y. (2017). Detrimental changes and construction projects: Need for comprehensive controls. International Journal of Project Organisation and Management, 9(2), 154–170. https://doi.org/10.1504/IJPOM.2017.085291
- Metropolis, N., & Ulam, S. (1949). The monte carlo method. Journal of the American Statistical Association, 44(247), 335–341.
- Miller, R., & Lessard, D. R. (2001). The strategic management of large engineering projects: Shaping institutions, risks, and governance. MIT press.
- Ng, A., & Loosemore, M. (2007). Risk allocation in the private provision of public infrastructure. International Journal of Project Management, 25(1), 66–76. https://doi.org/10.1016/j.ijproman.2006.06.005
- Pang, Q., Wang, H., & Xu, Z. S. (2016). Probabilistic linguistic term sets in multi-attribute group decision making. Information Sciences, 369, 128–143. https://doi.org/10.1016/j.ins.2016.06.021
- Qi, X., Ke, Y. J., & Wang, S. Q. (2009). Analysis of critical risk factors causing the failures of China’s PPP projects. China Soft Science, 5, 112–118.
- Rai, S. P., Sharma, N., & Lohani, A. K. (2014). Risk assessment for transboundary rivers using fuzzy synthetic evaluation technique. Journal of Hydrology, 519, 1551–1559. https://doi.org/10.1016/j.jhydrol.2014.08.060
- Rodriguez, R. M., Martinez, L., & Herrera, F. (2012). Hesitant fuzzy linguistic term sets for decision making. IEEE Transactions on Fuzzy Systems, 20(1), 109–119. https://doi.org/10.1109/TFUZZ.2011.2170076
- Saaty T. L. (1988). What is the analytic hierarchy process? In Mathematical models for Decision Support (pp. 109–121). Springer. https://doi.org/10.1007/978-3-642-83555-1_5
- Song, J. B., Yu, Y. Z., Jin, L. L., & Feng, Z. (2018). Early termination compensation under demand uncertainty in public-private partnership projects. International Journal of Strategic Property Management, 22(6), 532–543. https://doi.org/10.3846/ijspm.2018.6049
- Sun, H., Jia, S. H., & Wang, Y. N. (2019). Optimal equity ratio of bot highway project under government guarantee and revenue sharing. Transportmetrica A: Transport Science, 15(1), 114–134. https://doi.org/10.1080/23249935.2018.1486340
- Wang, Y. L., Cui, P., & Liu, J. C. (2018). Analysis of the risk-sharing ratio in PPP projects based on government minimum revenue guarantees. International Journal of Project Management, 36(6), 899–909. https://doi.org/10.1016/j.ijproman.2018.01.007
- Wang, H. M., Liu, Y. H., Xiong, W., & Song, J. B. (2019). The moderating role of governance environment on the relationship between risk allocation and private investment in PPP markets: Evidence from developing countries. International Journal of Project Management, 37(1), 117–130. https://doi.org/10.1016/j.ijproman.2018.10.008
- Wang, L. N., Wang, H., Xu, Z. S., & Ren, Z. L. (2020). A bi-projection model based on linguistic terms with weakened hedges and its application in risk allocation. Applied Soft Computing, 87, 105996. https://doi.org/10.1016/j.asoc.2019.105996
- Wang, H., Xu, Z. S., & Zeng, X. J. (2018). Linguistic terms with weakened hedges: A model for qualitative decision making under uncertainty. Information Sciences, 433, 37–54.
- Wang, H., Xu, Z. S., Zeng, X. J., & Liao, H. C. (2019). Consistency measures of linguistic preference relations with hedges. IEEE Transactions on Fuzzy Systems, 27(2), 372–386. https://doi.org/10.1109/TFUZZ.2018.2856107
- Wang, L. G., & Zhang, X. Q. (2018). Bayesian analytics for estimating risk probability in PPP waste-to-energy projects. Journal of Management in Engineering, 34(6), 04018047. https://doi.org/10.1061/(ASCE)ME.1943-5479.0000658
- Wang, J. Y., & Zou, X. W. (2017). Infrastructure Project Risk Management. China Construction Industry Press.
- Wang, L. N., & Xu. Z. S. (2021). The risk evaluation of PPP projects: A technique based on probabilistic linguistic terms with weakened hedges. Journal of Intelligent and Fuzzy Systems, 41(1), 1173–1191. https://doi.org/10.3233/JIFS-210101
- Wu, Y., Li, L., Xu, R., Chen, K., Hu, Y., & Lin, X. (2017). Risk assessment in straw-based power generation public-private partnership projects in China: A fuzzy synthetic evaluation analysis. Journal of Cleaner Production, 161, 977–990. https://doi.org/10.1016/j.jclepro.2017.06.008
- Xia, N. N., Zou, P. X. W., Liu, X., Wang, X. Q., & Zhu, R. H. (2018). A hybrid BN-HFACS model for predicting safety performance in construction projects. Safety Science, 101, 332–343. https://doi.org/10.1016/j.ssci.2017.09.025
- Yang, T. H., & Zheng, Q. H. (2009). Project safety risk analysis based on fault tree method. Journal of Systems & Management, 18(5), 511–515.
- Yu, Y., Darko, A., Chan, A. P. C., Chen, C., & Bao, F. (2018). Evaluation and ranking of risk factors in transnational public-private partnerships projects: Case study based on the intuitionistic fuzzy analytic hierarchy process. Journal of Infrastructure Systems, 24(4), 04018028.1–04018028.13. https://doi.org/10.1061/(ASCE)IS.1943-555X.0000448
- Zadeh, L. A. (1965). Fuzzy sets. )Fuzzy Sets. Information & Control, 8(3), 338–353. https://doi.org/10.1016/S0019-9958(65)90241-X
- Zhang, S., Chan, A. P. C., Feng, Y., Duan, H., & Ke, Y. J. (2016). Critical review on PPP research a search from the Chinese and international journals. International Journal of Project Management, 34(4), 597–612. https://doi.org/10.1016/j.ijproman.2016.02.008
- Zhang, S. H., Li, J. H., Li, Y. L., & Zhang, X. L. (2021). Revenue risk allocation mechanism in public-private partnership projects: Swing option approach. Journal of Construction Engineering and Management, 147(1), 04020153. https://doi.org/10.1061/(ASCE)CO.1943-7862.0001952
- Zhang, S. H., Li, J. H., Li, Y. L., & Zhang, X. L. (2021). Revenue risk allocation mechanism in public-private partnership projects: Swing option approach. Journal of Construction Engineering and Management, 147(1), 04020153. https://doi.org/10.1061/(ASCE)CO.1943-7862.0001952