
 ?Mathematical formulae have been encoded as MathML and are displayed in this HTML version using MathJax in order to improve their display. Uncheck the box to turn MathJax off. This feature requires Javascript. Click on a formula to zoom.
Abstract
COVID-19 has slowed the growth of, the global economy, which has certain practical significance. Consequently, this study seeks to analyze the investment opportunities in the medical sector before and after the COVID-19 outbreak. In this study, the Markowitz mean–variance (MV) model, capital asset pricing model (CAPM), and correlation models are constructed based on the principle of Markowitz MV and correlation analysis. Simultaneously, statistical analysis is used to verify the analysis, and the MATLAB statistical tool is used to build the model. The results show that the actual expected yield of China’s medical sector is significantly higher than that calculated by the CAPM before and after the pandemic, and that the investment value of the medical sector is undervalued by the market. From the perspective of risk, China’s medical sector has a stable systemic risk premium. Based on the above analysis, when building investment portfolios in the post-pandemic era, investors should appropriately allocate stocks in the medical and pharmaceutical sectors to improve the portfolio income and diversify the investment risk.
JEL CODES:
1. Introduction
The unexpected outbreak of the COVID-19 pandemic at the beginning of 2020 had far-reaching effects on individuals and industries including the medical and pharmaceutical industries. As the outbreak developed, the market demand for antiviral drugs and medical equipment products such as ventilators, virus testing kits, and protective devices used to prevent the spread of the virus has increased. People’s medical awareness and demand for drugs to enhance the immune system has significantly improved, and monthly online health consultations have increased 10-fold. This series of phenomena has significantly promoted the development of the medical industry. It can be predicted that when COVID-19 is effectively controlled, more capital will be available for investment in the field of disease prevention. Currently, academic research on the impact of COVID-19 focuses on the macro economy and various industries. The COVID-19 pandemic is a complex global crisis dominated by exogenous factors. The impact on the economy depends on the pandemic’s duration, the rationality of the economic structure, and the existence of production capacity (Hu, Citation2020). The COVID-19 pandemic has significantly impacted small, medium, and micro enterprises, brought high direct medical costs and huge indirect economic costs to China, and slowed down the economic development of some industries, especially the tertiary industry. Therefore, the government has issued relevant policies to help the development of the real economy, including encouraging local consumption and focusing on supporting special industries and cooperating with active and flexible financial and monetary policies (Du & Zhao, Citation2020; Shen, Citation2019; Yu & Zhu, Citation2020; Zhao, Citation2021). However, the cost of preventing the spread of COVID-19 put further pressure on the industrial chains around the world, and has hindered global economic recovery, which will lead to inefficiency and the waste of resources (Jipeng & Xiao, Citation2021). Therefore, in the face of the hit industrial economy, efforts should be made to analyze the current situation in relation to the differences among industries and policy combinations to remedy the case.
The outbreak and development of COVID-19 have also prompted social research on the medical and pharmaceutical industries. With the development of grassroots medical and health services during the pandemic to provide more medical services for the masses (Wang, Citation2020), and with the development of Internet technology and the population aging problem, the medical and health system demand expands. Hence, information construction is imperative. For example, artificial intelligence technology for the national medical and medicine industry services improves resource distribution and market system operation efficiency, and will help to promote the in-depth development of China’s medical industry (Xin et al., Citation2021; Ye, Citation2020).
Given the shortcomings of the service level of primary medical institutions in China, strengthening the construction of grassroots medical associations can improve the response and processing speeds of major pandemic prevention, and keep damage level to a minimum. This can also give full play to the incentive and guiding role of performance evaluation, improve the level of continuing medical education of Chinese doctors, and provide an institutional basis for the improvement of grassroots medical service levels. These lead to increased government investment and more rapid financial support to the medical sector (Stephenson et al., Citation2020; Wang et al., Citation2020; Zhao et al., Citation2021), which also highlights the investment value of the medical sector.
Research on stock investment in various industries (i.e., asset allocation issues for investors) can be generally divided into three paths. First, the traditional financial path under effective market theory and risk aversion explores the investment decision behavior of rational investors under the classical Markowitz mean–variance (MV) model theory, capital asset pricing model (CAPM) theory, and extension theory. (Zhou, Citation2021), with the help of machine learning methods, established a random forest model using multiple factors to analyze the stock portfolio returns. Second, non-effective market theory and loss aversion under the behavioral financial path examines various behavioral finance theories considering investor psychological factors such as loss aversion, psychological accounts, overconfidence, and conformity behavior, and analyzes the asset allocation of limited and rational investors based on behavioral finance theory. Third, the cross-period consumption investment problem, under the consumption theory and utility theory, analyzes investor consumption and investment behavior according to family (individual) life cycle theory permanent income hypothesis. For example, Zhou (Citation2019) constructed an asset allocation life-cycle model considering the background risk of labor income and proved that investors’ investment shares in stocks vary significantly in different lifecycle stages.
The purpose of this study is to analyze the changes of risks and returns in China’s medical sector before and after COVID-19 based on MV theory, CAPM theory, and actual data, and put forward investment suggestions.
This paper is divided into four parts: the Introduction introduces the research status at home and abroad and the purpose of this paper; the second part is an overview of the model and data, which mainly describes model selection, hypothesis, data sources and use of quantitative tools; the third part is an empirical test; and the last part includes the summary and investment recommendations.
2. Model settings and Data description
2.1. Empirical test hypothesis
As an important part of the market, the medical and pharmaceutical industries are aligned with the general law of market income and risk analysis. Based on the need for analyzing the investment income status of the healthcare sector before and after the pandemic, this study applies Markowitz portfolio theory (Markowitz mean–variance model theory, Markowitz, Citation1952), capital asset pricing theory (CAPM theory, Sharpe, Citation1964), and other relevant indicators as data processing and analysis models. The empirical test assumptions are as follows according to the MV theory and CAPM theory:
Empirical test hypothesis 1: the number of assets is fixed and the assets can be infinitely divided. This hypothesis excludes the possibility that an investor can invest in non-trading assets, and investing in an asset can be held in any unit.
Empirical test hypothesis 2: investors are willing to choose a portfolio between the expected value and the standard difference of the yield, and the investment meets the consensus expectation hypothesis. Being risk averse, investors are only willing to choose portfolios with minimized standard deviation, and pursue the maximization of expected return on this basis. All investors invest in the same order, and investors have the same expectations for the yield, standard deviation, and covariance matrix for various assets.
Empirical test hypothesis 3: there is no transaction cost and no tax payment, the market is fully competitive, and investors can borrow unlimited funds with a risk-free interest rate. Individuals do not care about getting investment returns through dividends or spreads. There is a large number of investors in the market, and individuals cannot control the price of the market; they can only be the recipient of the price.
Empirical test hypothesis 4: single-period investment hypothesis. Investors plan their personal investment practices during the same securities holding period.
The above assumptions provide basic logical and theoretical support for the analysis of the income status of the medical sector. On the basis of these empirical test assumptions, the quantitative, relatively reasonable, and accurate investment value of the medical sector is combined.
2.2. Measurement model setting
The function measurement model settings used in the MATLAB financial toolbox are calculated according to the following pre-set measurement rules:
First, the MV model was set. According to the purpose of the MV model establishment, to find the effective frontier of the stock or portfolio, namely the Pareto solution of the optimization multi-objective problem, and to seek the Pareto solution of the asset or portfolio, the specific model was established as follows:
(1)
(1)
where
is the expected income of asset or portfolio income,
is the variance of asset or portfolio,
is the covariance matrix of n assets, and
is the actual return rate of assets.
is the weight vector of the portfolio, which is solved by the model. When the risk is certain, the model can find locations within the portfolio to maximize the returns. When the income is certain, the model can seek to minimize the risk within the portfolio, and judge the theoretical optimal portfolio point on the investment feasibility boundary by law.
Second, the CAPM is set. The CAPM theory, whose core theories include the capital market line (CML) and the securities market line (SML), proposes a linear relationship between expected returns and the expected risk of an asset or portfolio. The core purpose of the CAPM model is to establish the securities market line. If the market portfolio is valid, the expected return of any asset i meets the following relationship:
(2)
(2)
where
is the expected yield of risk asset i, and
is the expected return of the market portfolio.
is the risk premium, which exceeds the risk-free interest rate and the average risk additional income required by investors.
is the coefficient to measure systemic risk, reflecting the contribution of a specific security to market portfolio risk, and
indicates the contribution of the only i stock or asset to the market risk.
measures the co-variance of the asset i and the market portfolio. Therefore,
is represented as a systemic risk premium for the asset i.
This paper uses the expected return data calculated by the CAPM model to compare the actual stock return data and analyze whether the return status of the medical and medicine sector is overestimated or underestimated.
In addition, this study also evaluates performance according to other relevant models, including ‘Sharpe Ratio’, ‘Jensen Alpha’, ‘Treynor Ratio’, and ‘Information Ratio’.
The Sharpe ratio refers to the risk premium available for each unit portfolio risk to examine each portfolio. The higher the Sharpe ratio, the better the return status of the portfolio. It is defined as follows:
(3)
(3)
where
indicates the expected rate of return,
denotes the risk-free yield and
is the combination of income standard difference.
The Jensen Alpha Index, for a portfolio exceeding the excess returns that CAPM expects on the portfolio theory, measures the absolute profitability of the portfolio in the future and is defined as follows:
(4)
(4)
where
is the actual income of the combination and
is the combined income predicted by the CAPM model of the combination.
is the additional income between actual income and theoretical income, which is the difference between these two.
The Treynor ratio is the risk premium available for each unit system risk (it considers only system risk, not non-systemic risk), and the risk status is measured with exact values, evaluating fully dispersed portfolio performance. It is defined as follows:
(5)
(5)
Information ratio refers to the risk premium acceptable for each unit of non-systemic risk. Contrary to the Treynor ratio, which reflects the risk premium given by the systemic risk, it is defined as follows:
(6)
(6)
where
is Jensen Alpha,
is the standard difference in excess returns, that is the quantity of excess return a portfolio can obtain after risk change under the same market conditions of public information. The information ratio generally takes 0.5 as a well-performing critical point.
2.3. Data description
This study uses a total of 45 medical and pharmaceutical stocks in the domestic market according to the narrow sense set above. The selected medical and pharmaceutical stocks are from the main business of medical treatment and its upstream and downstream related production activities, including medical and health products, systems, equipment supply, and medical technology. The main business refers to non-medical medicine and its upstream and downstream related services (excluding stocks) in the medical and pharmaceutical sectors prior to the pandemic with a healthy revenue and stable operating environment. The basic data were analyzed with the daily yield data from the year before the COVID-19 outbreak from February 2019 to February 2020 and within the year after the COVID-19 outbreak from February 2020 to January 2021.
The stock yield data, risk-free yield data, and market return data all come from the daily recorded data in the RESSET Financial Research Database. Specifically, the financial toolbox Portfolio function was used to calculate the effective frontier of the portfolio and output the effective frontier stock income data of the medical medicine market, in which Asset covariance and Asset Mean should be input as the co-variance matrix, and the average income of the medical medicine stock and its portfolio income (1) Fitlm function was used to calculate and test the CAPM model of the medical and pharmaceutical market. It is the key function used to calculate CAPM model in the MATLAB toolkit. The calculation formula of the Fitlm function is:
Fitlm is a linear regression model, mdl = fitlm(X,y,modelspec) returns a linear model of the type you specify in modelspec for the responses y, fit to the data matrix X.
X is an explanatory variable, indicating that the multidimensional matrix n × p, which has p explanatory variables representing the part in the formula; Y is the interpreted variable n × 1, and in the formula represents the Premium of each stock relative to the risk-free return. To facilitate calculation and analysis, the program modelspec was defaulted to ‘linear’, that is, the model contains an intercept term and slope term, which is the description of the linear regression model to test the significance level (2).
The third MATLAB function model uses the sharpe function to calculate the Sharpe Ratio (3).
The fourth model used the Treynor ratio to solve the excess returns from the portfolio assumed unit system risk, where Benchmark is the market base yield (4).
The Portalpha function is used to estimate the excess returns of the medical medicine sector, and the Choice function is the calculation of the Jensen Alpha model option, where you can enter ‘Jensen’ or ‘CAPM’ (5).
The Inforatio ratio design estimates the actual return of the stock beyond the expected return corresponding to its risk, where the output value Ratio is the information ratio itself and TE is the tracking error value (6).
The above MATLAB function variables are as follows:
p = Portfolio('property1',value1, 'property2',value2,…)
mdl = fitlm(X,Y,Modelspec)
Ratio = sharpe(Asset,Cash)
Tr_ratio = treynor(Asset,Cash,Benchmark)
Alpha = portalpha(Asset,Benchmark,Cash,Choice)
[Ratio,TE]=inforatio(Asset,Benchmark)
3. Empirical test analysis
3.1. Variable descriptive statistics and correlation tests
3.1.1. Descriptive statistics
presents the descriptive statistics of the yield variables of the epidemic during 2019–2020. As shown in is the maximum, reaching a daily yield of 0.6014%. In contrast, the average stock S37 is the lowest at-0.02%. Comparing each stock investment risk, S2 is the largest investment risk in the medical sector, at 0.037888. Conversely, stock S7 has the lowest investment risk with a volatility of only 0.010989. According to the main characteristics of the data, the overall yield of the 45 stocks rose during 2019–2020. Except at some special points, the income distribution area is relatively narrow. This year, the medical and pharmaceutical sectors performed well.
Table 1. Descriptive statistics of the pre-pandemic stock.
Table 2. Descriptive statistics of the post-pandemic stock.
presents the descriptive statistics of the post-day yield variables of the pandemic during 2020–2021. As shown in , the S25 is the maximum, reaching a daily yield of 0.3958%. In contrast, the average stock, S14 is lowest at-0.122%. Comparing the stock investment risk, S37 is the largest investment risk in the medical sector, at 0.044883. Prior to the outbreak, equity S7 had the lowest investment risk with volatility of 0.017896. According to the main characteristics of the data, the overall yield of the 45 stocks showed an upward trend during 2020–2021; however, compared with the previous year, the upward trend slowed down significantly. Except at some special points, the income distribution area is still relatively narrow. The table intuitively shows that the performance of the medical and pharmaceutical sector is relatively general this year compared with last year.
3.1.2. Correlation matrix
According to He (Citation1977) in his paper on the evaluation of sample correlation (r), r = ρ = 0 was considered irrelevant, r < ρ = 0.3 was low, 0.3= ρ <r < ρ = 0.7 was moderate, r > ρ = 0.7 was high, and r = ρ = 1 was complete. The correlation coefficient analysis was conducted based on the demonstration of Wang and Tian (Citation1999) on the judgment of multiple collinearities in establishing a Regression Model to avoid multiple collinearities.
Prior to the pandemic, the correlation coefficient of inter stock return did not exceed 0.6, and the average correlation coefficient was 0.27. Among them, 58% of the yield correlation coefficients were lower than 0.3, and the remaining 42% were between 0.3 and 0.7. After the pandemic, the correlation coefficient of 0.6% of the data in each stock is more than 0.6, and the average correlation coefficient among each stock is 0.24. Among them, 68% of the yield correlation coefficients are lower than 0.3, and the remaining 32% are between 0.3 and 0.7.
Therefore, the correlation coefficients of returns among stocks are in a low position, and the multicollinearity problem will not be encountered.
3.2. Empirical inspection and analysis
3.2.1. Revenue analysis of the medical and pharmaceutical sector before and after the pandemic based on Markowitz Mean-Variance Model theory
The 45 stocks in the medical and pharmaceutical sector were ranked according to the daily yield prior to the pandemic from 2019–2020 and after 2020 from 2020–2021, respectively. In addition, the daily earnings and risk-free returns of the A stock market in the same period were selected.
According to the above MV theory calculation formula:
Available by formula (1):
(7)
(7)
Formula (7) can be classified as:
(8)
(8)
Define the average standard difference and the average covariance of the securities portfolio:
(9)
(9)
The combined variance is:
(10)
(10)
The portfolio function is established by MATLAB, and the effective frontier of Markowitz before and after the pandemic is established with 90 groups of asset portfolio as the weight, as shown in .
Figure 1. Effective frontier of an asset portfolio with a tangent line.
Source: created by the author
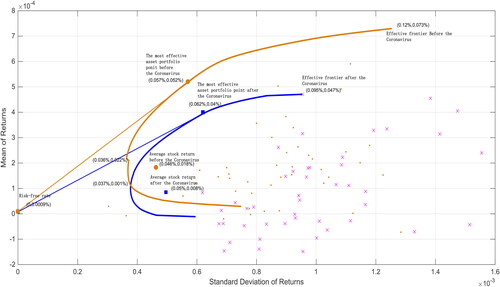
shows the tangent portfolio effective frontier of the medical and pharmaceutical sectors. The orange curve represents the fitted effective frontier of investment in the pre-pandemic medical and pharmaceutical sectors, and the blue curve represents the fitted effective frontier of investment in the post-pandemic medical and pharmaceutical sector. Accordingly, the orange dot represents the distribution of daily returns and standard deviation of each stock prior to the pandemic. The blue small fork represents the distribution of returns and standard deviation of each stock within one trading day after the outbreak.
According to , the average income of the stocks in the medical and pharmaceutical sector was (0.046%, 0.018%, respectively), while after the pandemic, the average return of the stocks in the sector was (0.05%, 0.008%), both with positive income and under the income standard difference of 0.05%. The effective pre-pandemic frontier reveals that the lowest medical and medicine sector portfolio risk and the lowest return point is (0.036%, 0.022%), and the highest risk and the highest return is (0.12%, 0.073%). After observing the distribution of effective frontiers post-pandemic, the lowest risk of the pharmaceutical sector portfolio, the lowest margin is (0.037%, 0.001%), and the highest risk and the highest margin is (0.095%, 0.047%). Intuitively, the effective front after the pandemic is fully included by the effective front before the pandemic. On the whole, the portfolio income after the pandemic has declined, while the risk has increased significantly, and the effective frontier shows the overall trend moving to the lower right of the image. The phenomenon shows that after the medical sector experienced COVID-19 emergencies, the income situation of the plate was under pressure, and the investment risk factor increased significantly. Intuitively, the investment value has declined to a certain extent.
Specifically, based on the optimal asset allocation theory of asset effective frontier, an analysis was conducted using a given rate of return, as shown in .
Figure 2. Optimum asset allocation at the effective frontier (with a given yield).
Source: created by the author
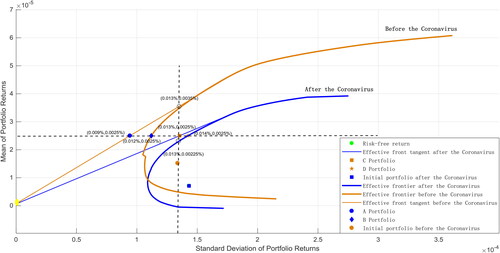
Assuming an optimal asset allocation analysis for a given single group of assets with a 0.0025% expected daily portfolio yield, we can analyze the optimal solution for all portfolio return conditions with a weight of 90. The expected rate of return of asset portfolio is 0.0025%, and then the standard difference corresponding to the effective pre-pandemic frontier optimal asset allocation is the standard difference of risk asset A portfolio (0.009%, 0.0025%), plus the standard difference of risk asset B portfolio (0.012%, 0.0025%), with a sum of 0.021%. The standard deviation of the effective cutting-edge optimal asset allocation after the pandemic is the standard difference of the risk-free asset C portfolio point (0.013%, 0.0025%) plus the standard deviation of the risk asset D combination point (0.014%, 0.0025%), with a sum of 0.027%. Therefore, given the equivalent return status, the portfolio return points combined from the A and B points are superior to the C and D points, where the risk is lower than the latter.
Accordingly, with the post-pandemic C portfolio point (0.013%, 0.0025%) as the given standard difference, the corresponding post-pandemic risk portfolio point is (0.013%, 0.00,225%, at the same risk level). The combined return rate of 0.0013% based on risk is 0.00,475%. At this risk level, both the pre-pandemic risk-free and risk portfolio points are approximately located (0.013%, 0.0035%), so the combined yield at 0.013% is 0.007%. Given a level of risk, the combined return rate before the outbreak is significantly higher than the combined return rate after the outbreak.
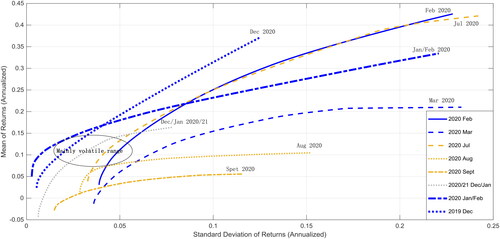
According to , the effective forefront of the healthcare sector portfolio fluctuated during October 2019–January 2021. Focusing on observation , the new coronavirus outbreak time period, effective frontiers in February and July 2020 respectively appear at the bottom right significant translation. Thus, it can be proved by the MV theory that after the outbreak, the medical medicine sector income appeared to significantly decline while the risk has increased significantly; the overall trend of translation to the bottom right. Therefore, compared with its own income situation, after the outbreak of the pandemic, it is initially concluded that the investment value of the medical and pharmaceutical sector has decreased significantly, and the pandemic has a certain negative impact on the income of the medical and pharmaceutical sector.
Figure 3. Effective Frontier from October 2019–January 2021.
Source: created by the author
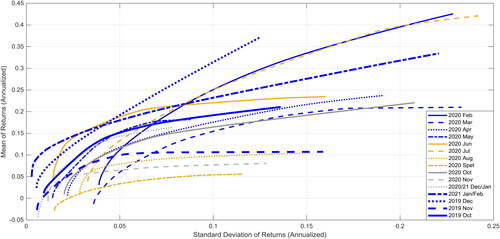
Figure 4. Effective frontier of the asset portfolio during the time period of the pandemic outbreak.
Source: created by the author
3.2.2. Income analysis of the medical sector before and after the pandemic based on relevant indicators
CAPM theory is an extension of MV theory. However, before using the CAPM model to accurately calculate the income situation of the medical and pharmaceutical sector relative to the market and judge whether the plate is overvalued or undervalued, this section of the paper analyzes the specific performance status of the medical and pharmaceutical sector before and after the pandemic based on the relevant indicators of the CAPM model.
(1) Sharpe ratio and Jason Alpha Index analysis
Calculation formula (3) and (4) respectively:
(11)
(11)
(12)
(12)
The results show that in the pre-pandemic Sharpe ratio (that is, the risk premium), a total of 40 stocks have achieved positive excess returns, accounting for 89%. After the pandemic, a total of 27 stocks had positive excess returns, accounting for 60%. Before and after the pandemic, the Sharpe ratio of nine stocks increased, accounting for 20%, and the risk premium of the remaining 80% stocks decreased. Prior to the pandemic, the Sharpe ratio of the medical and pharmaceutical sector was 0.846237, which decreased to 0.312596 after the pandemic.
Using the Jensen alpha index, before the pandemic, the earnings of 38 stocks exceeded the expected rate of return. The Jensen alpha index of these 38 stocks was greater than 0, accounting for 84%. After the outbreak, the number dropped to 28, accounting for 62%. Before and after the pandemic, the Jensen alpha index of 13 stocks increased, accounting for 29%, and the excess return of the remaining 71% stocks decreased. The Jensen alpha index of the plate before and after the pandemic was 0.328378 and 0.190404, respectively. The data shows that after the outbreak of the pandemic, the risk premium and excess return relative to the expected rate of return of the medical and pharmaceutical sector have decreased significantly. However, the sector still has the ability to obtain a certain positive excess return. shows the details.
Table 3. Some relevant indicators of the medical and medicine sector before and after the pandemic.
(2) Treynor Ratio and Information Ratio analysis
Formula (5) and (6) are calculated:
The excess return variance in the information ratio is:
(13)
(13)
Based on the measured Treynor ratio data, 37 stocks can obtain a positive risk premium from systemic risk before and after the pandemic. Prior to the outbreak, the treynold ratio of the medical and pharmaceutical sector was 1.879446, which decreased slightly to 1.77556 after the outbreak, and the change was not very obvious.
Based on the measured information ratio, taking 0.5 as the risk premium of non-systematic risk of stocks, it can be obtained that 25 and 8 stocks respectively reached the good standard before and after the pandemic, and the proportion decreased from 56% to 18%. Before the outbreak, the information ratio of the medical and pharmaceutical sector was 0.610563. After the outbreak, it plunged to −0.24211, with obvious changes.
According to the comparison of Treynor ratio and information ratio data prior and post-pandemic in the medical sector, it can be seen that the medical sector has a strong ability to resist systemic risks, and the risk premium level generated in the face of systemic risks is sustained and stable. At the same time, the medical and pharmaceutical sector performed poorly in the risk premium level generated by non-systematic risks after the pandemic, and the risk premium level of non-systematic risks decreased sharply (COVID-19 is a systemic risk). Therefore, the medical and pharmaceutical sector has a better ability to resist systemic risks under the COVID-19 background and can guarantee a stable level of risk premium in severe systemic risks. Data show that as long as we effectively avoid the impact of the non-systemic risks of the medical and pharmaceutical sector, the medical and pharmaceutical sector is a relatively safe option in the post-COVID-19 era.
3.2.3. Revenue analysis of medical sector before and after pandemic based on CAPM model
Based on the CAPM model and the CAPM function fitlm, this study successfully fitted 90 groups of 45 stocks in the medical medicine sector before and after the pandemic, and conducted a double-tail t test with confidence of 95% of all CAPM models, respectively. The main calculation process is as follows:
(14)
(14)
First, by analyzing the results of the CAPM model fitting of the pre-pandemic medical medicine sector, in the CAPM model of 45 stocks, the Alpha value satisfied the confidence significantly not-0 at 95%, which is a total of four stocks who reject the zero hypothesis, when
The Beta value satisfied the confidence in 95% in the two-tail t test, and a total of 23 stocks that rejected the zero hypothesis when significantly not zero. There is no satisfaction for rejecting both the Alpha and Beta values at 95% confidence. After calculation, the CAPM value of the pre-pandemic medical and medicine sector was 0.0596% in daily income, and it was reduced to 14.31% annually. The market yield in the year prior to the pandemic was 9.29%, and the CAPM value of the medical sector was significantly higher than the market average level.
Second, analyzing the results of the CAPM model fitting of the post-pandemic medical medicine sector, in the CAPM model of 45 stocks, the Alpha value that the confidence was significantly not 0 at 95%, which is a total of 0 stocks rejected the zero hypothesis, when
The Beta value satisfies the confidence in the double-tail t test at 95% with a total of 10 who reject the zero hypothesis when significantly not zero. There is no satisfaction for rejecting both Alpha and Beta, at 95% confidence. After calculation, it was concluded that the CAPM value of the medical and medicine sector after the pandemic was 0.009% daily income, and it turned to 2.07% annually. The market yield in the year after the pandemic was 24.7%, and the CAPM value of the medical sector was significantly lower than the average market average level.
Compared with the results of the CAPM model before and after the pandemic and the current market data, before the outbreak, the alpha excess yield rate of the CAPM model of the medical and medicine sector was 8.9% annualized or 0.0371% in daily chemical, exceeding the difference between the expected yield and market yield calculated by the current CAPM model by 5%. The CAPM model estimated the expected yield of the medical sector to be 14.31% annualized, which is higher than the current market average of 9.29%. After the outbreak of the pandemic, the alpha excess yield rate of the CAPM model in the medical sector was 0. The CAPM model estimated the expected yield of the medical sector to be 2.07% annualized, which is well below the current market average of 24.77%. Therefore, in terms of the conclusions calculated by the CAPM model, prior to the pandemic, the medical and medicine sector had more investment value compared to the large market. Post pandemic, the investment value appears to be very mediocre.
Data show that in the year before and after the pandemic, the actual expected return rate of return in the medical sector was 36.46% and 16.10%, respectively, which is higher than the expected return rate calculated by the current CAPM model, with an annualized rate of 14.31% and 2.07%. This result shows that the market has underestimated the stock prices of the medical sector to varying degrees, which has considerable value for investment in the medical sector.
3.2.4. Based on the analysis of income of other sectors of shares in the same period
According to the above data conclusion of the actual expected yield of the medical and pharmaceutical sector, a side analysis was conducted on the performance of other industry sectors in the A stock market prior to and post the pandemic.
Compared with the other 66 industry sectors, 14 sectors experienced rising prices following the pandemic, among which two other sectors closely related to the medical and pharmaceutical sectors, serving biological products and medical devices. Among all industry sectors, eight sectors are higher than the medical and pharmaceutical sectors in their yield before and after the pandemic. In other words, the income performance of the medical and pharmaceutical sectors before and after the pandemic is normal. Specifically, before the pandemic, a total of 13 sectors were higher than the medical and pharmaceutical sectors. This figure surged to 24 following the pandemic, and the earnings capacity of the medical sector on the A stock market declined significantly at the upper market level following the impact of the pandemic. According to the analysis of CAPM model and relevant indicators, the actual expected yield of the medical and medicine sector is 36.46% and 16.10%, respectively, which is higher than the calculated expected yield, namely 14.31% and 2.07%. This shows that the market for the medical sector of the stock prices appears to be undervalued. Compared with the performance of the medical and pharmaceutical sectors and other sectors, it can be proved that the return capacity of the medical and pharmaceutical sectors after the pandemic is significantly underestimated, and compared with the income data prior to the pandemic, the medical and pharmaceutical sectors have a degree of potential to rise.
4. Research conclusions and investment recommendations
This study analyzes the value changes of representative stocks in the medical sector and applies MV theory, the CAPM model, and relevant indicators. It compares the data before and after the pandemic and the market performance in the same period, studies the fluctuation and change trend of their investment value, and draws the following conclusions.
Due to the widespread impact of COVID-19 on the world economy and the financial market, the medical and pharmaceutical sectors are unlikely to be independent. In the face of the huge pressure of the pandemic, there has been an obvious decline in revenue in the medical and pharmaceutical sectors following the pandemic. This is specifically reflected in the changes in investment indicators such as the decline of yield and the rise of risk.
According to the relevant indicators of the CAPM model, there is excess return in the medical and pharmaceutical sectors. The medical and pharmaceutical sectors have a stable systemic risk premium. In the face of events such as the COVID-19 pandemic that have global effects, the medical and pharmaceutical sectors can maintain the stability of earnings, which is suitable for investing in a system with potential risks. Paying attention to the non-systematic risks within the sector can effectively avoid the value loss caused by investing in the sector.
According to the data calculated by the CAPM model, the income of the medical and pharmaceutical sector prior to the pandemic was significantly higher than the market average level, and significantly lower than the market level after the pandemic. Considering a series of systematic and non-systematic risks after the pandemic, we further processed the data and found that the actual expected rate of return of the sector before and after the pandemic was significantly higher than the expected rate of return calculated by the CAPM model, indicating that the medical and pharmaceutical sector has been underestimated by the market for a long time. Although the yield of the medical and pharmaceutical sector is not as good as that of the market, it is based on the background of the decline in investment income in the post-pandemic era, and the background of investment in medical resources and people’s attention to health during the pandemic period. The medical and pharmaceutical sector with stable systematic risk premium and obviously undervalued position will have a certain investment value in the future.
Combined with the above analysis, this study presents the following investment opinions.
Investors should include some stocks in the medical and pharmaceutical sector when building their portfolio. Specific to individual stocks, after the pandemic, the indicators of Tiger medicine, Dasensen, Steli, Yifeng pharmacy, and Qinghai spring are the best. The earnings of the above stocks are higher than the average earnings of the sector. In terms of risk, they are also lower than the risks of most other stocks; thus, they have better investment value.
In this study, the traditional mature MV theory and CAPM theory are used to analyze the investment value of the medical and pharmaceutical industries, and there was not enough innovation in theory and model. The MV assumes that the assets returns can be normally distributed, however in the real-world, returns are not normally distributed and the MV method does not consider estimation error, which will ultimately lead to underestimating the portfolio’s overall risk. It is also the limit of this paper .
With the progress of research methods, more advanced deep learning algorithms (such as Ann, DBN, and LSTM) and statistical models such as support vector machines (SVM)and linear support vector machines (LSVM), can be used to analyze data and give investment decisions in the future. The effects of estimation error could also be reduced by conducting sensitivity analysis or using the Black-Litterman model.
Disclosure statement
The authors declare that they have no competing interest.
Data availability Statement
Some or all data, models, or code generated or used during the study are available from the corresponding author by request.
Additional information
Funding
References
- Du, J., & Zhao, W. L. (2020). Analysis of the effect of China's financial policies on improving social and economic resilience during the epidemic period. Hebei Academic Journal, 40(06), 125–130. https://kns.cnki.net/kcms
- He, D. (1977). Discussion on the correlation degree of evaluation sample correlation coefficient (r). Health Care Communication, 5(04), 42–46. http://www.cnki.com.cn/Article/CJFDTotal-SXYX197704008.htm
- Hu, X. Y. (2020). Financial market shocks and economic shocks under the COVID-19 epidemic. Chinese Business, 15, 27–31 + 44. https://doi.org/10.19699/j.cnki.issn2096-0298.2020.15.027
- Jipeng, P., & Xiao, Y. (2021). Review of researches on the impact of major public emergencies on Chinese economic development. Statistics & Decision, 37(02), 93–97. https://doi.org/10.13546/j.cnki.tjyjc.2021.02.020
- Markowitz, H. M. (1952). Portfolio selection. The Journal of Finance, 7(1), 77–91. https://doi.org/10.1111/j.1540-6261.1952.tb01525.x
- Sharpe, W. F. (1964). Capital asset prices: A theory of market equilibrium under conditions of risk. The Journal of Finance, 19(3), 425–442. https://doi.org/10.2307/2977928
- Shen, Y. (2019). The status quo and suggestions for the development of primary medical and health service capabilities. Modern State-Owned Enterprise Research, 02, 136–138. https://kns.cnki.net/kcm
- Stephenson, C. R., Qian, Q., Mueller, P. S., Schleck, C. D., Mandrekar, J. N., Beckman, T. J., & Wittich, C. M. (2020). Chinese physician perceptions regarding industry support of continuing medical education programs: A cross-sectional survey. Medical Education Online, 25(1), 1694308. https://doi.org/10.1080/10872981.2019.1694308
- Wang, Y. (2020). The impact of the COVID-19 on the high-quality development of the private economy and its countermeasures. Management Review, 32(10), 11–21. https://doi.org/10.14120/j.cnki.cn11-5057/f.2020.10.002
- Wang, W., & Tian, Q. W. (1999). Multicollinearity should be avoided in establishing regression model. Journal of Mathematical Medicine, 04, 309–310. https://kns.cnki.net/KCMS/detail/detail.aspx?dbcode=CJFD&filename=SLYY199904009
- Wang, W., Ye, S. Y., Lin, Q. Q., Zhu, M., Zheng, W., & Huang, Q. (2020). Analysis of the development status and countermeasures of medical consortia. China Health Standard Management, 11(23), 27–30. https://doi.org/10.3969/j.issn.1674-9316.2020.23.009
- Xin, J., Hu, H. X., Dong, J. J., Zheng, L. Y., & Yang, T. H. (2021). The application status and development of artificial intelligence in the field of medical and health. China Information Technology, 03, 93–95 + 92. https://doi.org/10.3969/j.issn.1672-5158.2021.03.036
- Ye, C. M. (2020). Research on the status quo and development countermeasures of medical and health information construction. Industrial Technology Innovation, 2(28), 105–106. http://qikan.cqvip.com/Qikan/Article/Detail?id=00002HCD55907JP0MPD81JPX6LR
- Yu, J., & Zhu, S. (2020). The impact of the COVID-19 epidemic on Chinese economy. Times Finance, 34, 35–38. https://kns.cnki.net/kcms
- Zhou, L. (2019). An empirical analysis of asset allocation in the life cycle of Chinese households. Statistics & Decision, 35(12), 166–168. https://doi.org/10.13546/j.cnki.tjyjc.2019.12.042
- Zhou, L. (2021). Research on stock multi-factor investment based on random forest model. Financial Theory & Practice, 07, 97–103. https://kns.cnki.net/kcms
- Zhao, L. L. (2021). The impact of the COVID-19 on Chinese economy and various industries. Trade Show Economy, 03, 41–43. https://kns.cnki.net/kcms
- Zhao, R., Gao, J. L., Xiao, J., Liu, C. P., & Zhao, K. (2021). Consideration on the status quo and development of Chinese medical consortium. Chinese Hospital Management, 41(02), 1–4. https://doi.org/10.19335/j.cnki.2096-1219.2017.22.21