
 ?Mathematical formulae have been encoded as MathML and are displayed in this HTML version using MathJax in order to improve their display. Uncheck the box to turn MathJax off. This feature requires Javascript. Click on a formula to zoom.
Abstract
We examine the impact of the recent restrictions/bans imposed by several nations on air travel to India in the light of the increasing number of infections amid the second wave of covid-19. We employ the standard event study method on a sample of 34 airline stocks across seven nations to find that the recent restrictions/bans on air travel significantly impact the global airline industry, although the country-specific impacts are not similar. We find that the post-event reaction in all nations has been different from those evidenced during the global pandemic declaration. We are the first to examine these impacts during the current wave of the pandemic. It contributes to the literature on the effects of the pandemic on the global airline industry. Further, it also provides practical explanations to the investors on how the airline stocks react to the persistence of the pandemic.
1. Introduction
Having claimed more than 3.22 millionFootnote1 lives as of 03 May 2021, the global pandemic has dusted economies all over the world. The worldwide outcry led by the coronavirus outbreak has not left a single industry unaffected. India, the economy which has contained the virus successfully limiting its spread during the first wave and manufacturing about 60% of the covid-19 vaccine sold across the globe,Footnote2 having failed to control the second wave of the virus, suddenly started facing the wrath of the pandemic. Due to the rapid increase in confirmed coronavirus cases in India, many nations have imposed restrictions on travel to India. The list of nations imposing air travel restrictions and air travel bans includes Hong Kong, United Kingdom, United Arab Emirates, Canada, Pakistan, New Zealand, Iran, Australia, Netherlands, Thailand, Italy, United States, Israel, Singapore, Germany, France, Indonesia, Saudi Arabia, Oman, Kuwait, and the Maldives.
The pandemic has already worsened the situation for the financial markets, the airline industry not being an exception since January 2020. exhibits the average revenue and net earnings of the airline industry in different nations. The global average net earnings, although negative, seem to have been recovering every quarter. For the year 2020, the highest total average revenue of 77.26 billion dollars is from India, and the least total average net earnings of −23.82 billion dollars are also from India. The average total revenue for the global airline industry has been 36.03 billion dollars, while the net earnings have been −5.87 billion dollars during the year 2020. The aviation-supported jobs fell by 52.5% during the pandemic.Footnote3 The global airline industry experienced a passenger revenue loss of 370 billion US dollars for 2020 due to the pandemic.Footnote4
Table 1. Average revenue and net earnings of the airline industry.
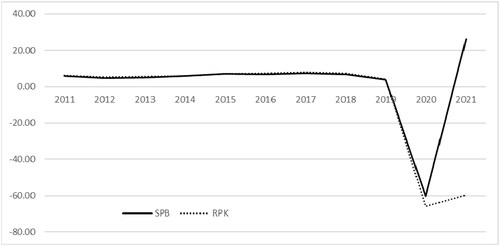
This was not the case in the airline industry during the pre-pandemic era. The pandemic has changed everything for this sector because it led to the travel restrictions that impacted the travel and tourism, and hospitality sectors to their worst. depicts the trend in the number of scheduled passengers boarded (SPB) and the revenue passenger kilometres (RPKs) for the period 2011 to 2021, wherein it is evident that the airline industry seems to have followed a usual growth trend. The revenues drastically fell after the pandemic compared to the previous trend. We find a few studies evidencing the stock market behavior in the pre-pandemic period. Mollick and Amin (Citation2021) compare the revenues and costs of the US airline industry for the period 1990–2019 and find that the revenues positively impact the stock returns. However, this positive relationship is weakened by the increase in costs. Demiralay and Kilincarslan (Citation2019), while examining a sample of the global travel and leisure industry, finds that airline stocks are negatively impacted by geopolitical risks, including terrorist and war events. Yun and Yoon (Citation2019) provide evidence from the airline industry in China and South Korea that the smaller airline firms are more sensitive to oil prices changes. Similarly, Csereklyei and Stern (Citation2020) provide evidence from a global sample that larger and newer aircraft companies are more efficient in their cost and revenue generation. The stock returns of the airline industry have been sensitive to several industry-specific and global events. However, the impacts reported in Maneenop and Kotcharin (Citation2020) indicate that the covid-19 pandemic has had more adverse impacts on the airline industry.
Figure 1. Trends in airline industry during the pre-pandemic period.
It is pertinent to examine how these travel restrictions impact airline stocks. Although a few studies have examined the impacts of different events on the airline industry, for example, the impact of earnings releases (Gong et al., Citation2006, Citation2008), the impact of aviation disasters (Kaplanski & Levy, Citation2010), the impact of terrorism on European tourism (Corbet et al., Citation2019), the impacts of airline crashes (Ho et al., Citation2013), international transmission of shocks in the airline industry (Gillen & Lall, Citation2003), the impact of Severe Acute Respiratory Syndrome (SARS) on airline industry (Loh, Citation2006), the impact of the Asian crisis on aviation industry (Henderson & Sadi, Citation2000), and the impact of tourism uncertainty on Korean airline stocks (Jeon, Citation2021); there is a lack of the substantial literature concerning the impacts of the covid-19 on the airline industry. While (Maneenop & Kotcharin, Citation2020) examined the impact on the global airline industry around three significant announcements to evidence that the stock returns significantly declined around the announcements, Graham et al. (Citation2020), Monmousseau et al. (Citation2020), and Sun et al. (Citation2021) examines the passenger-centric experiences during the pandemic. Sobieralski (Citation2020) examine the impact of the covid-19 outbreak on airline employment. Abate et al. (Citation2020), Albers and Rundshagen, Citation2020, Dube et al. (Citation2021), and Forsyth et al. (Citation2020) examine the impacts of the pandemic on the airline industry, and provide the scope and suggestions for the recovery of the industry. We find only (Maneenop & Kotcharin, Citation2020) to have examined the impacts on stock returns from the airline industry, that too, during the first wave in early 2020.
Further, no literature is available on the impact of the recent air travel restrictions on India. We are concerned with the travel restrictions by individual nations. Hence, the number of events is represented by the dates on which the news related to the travel restrictions was available. This study aims to contribute to the literature in three ways substantially. First, it extends the event study literature related to the airline industry. Second, it compares the covid-19 impacts on the airline industry after more than a year to show how investors behave to similar events after a gap. Third, no literature is available to have examined the impact of the travel restrictions and bans on the global airline industry's stock returns considering country-specific events. However, Maneenop and Kotcharin (Citation2020) examined the impacts of the pandemic during the early wave of Covid-19, and in fact, the impacts were the worst because for the first time in history, airports worldwide were closed, we examine the impacts of bans/restrictions by several nations during the second wave of Covid-19. Since the panic situation is not the same as the unprecedented global pandemic news, the impacts on the stock returns are not worse than previously. Our research is only limited to how the particular event (bans/restrictions) impacted the stock returns of the airline industry. After the end of the first wave, the stock markets recovered themselves, although the recovery of the travel sector has been slow. For our event study, we consider the period just before the event window, i.e., the estimation window, as a normal period and capture how this normal has been impacted due to the event in question. As far as the stock returns before the research period are concerned, the previous literature provides for the significant fall during the early days and a recovering market since April 2020.
The remaining sections deal with data and methodology (Section 2), quantitative analysis and discussions (Section 3), and conclusions and implications (Section 4).
2. Data and methodology
2.1. Data
We examine the impacts of the travel restrictions and bans imposed by several nations on India. Hence, our interest is concerned with the airline stocks listed in the nations' leading stock market, which have imposed restrictions/bans as of 30 April 2021. Initially, we had 20 nations that imposed travel restrictions or travel bans. However, to allow for cross-sectional aggregation across firms in each nation, we consider only nations with at least two airline stocks listed on their stock exchanges. Furthermore, the airline stock in the sample must have a history of regular trade, and data for the estimation and event window is available. Due to these conditions, we include 34 airline stocks across seven nations in our final sample. We collect the adjusted closing prices of the leading stock market indices of the sample nations from t-216 to t+5 (details in the Sub-section 2.2.1.), the quarterly revenue, and the net earnings of the sample firms for the four quarters of the year 2020 from Yahoo Finance. The event dates in our study represent the dates on which different nations imposed travel restrictions/bans on India. We provide the details of sample firms and the event dates in .
Table 2. Details of the sample.
2.2. Methodology
We use the Brown and Warner (Citation1980, Citation1985) standard event study methodology. An event study method always calls for the normal return estimation model. Brown and Warner (Citation1980, Citation1985) and Dyckman et al. (Citation1984) provide evidence for the most accurate estimation results using the market model. Kumari et al. (Citation2022), Mackinlay (Citation1997), Pandey et al. (Citation2022), Pandey and Jaiswal (Citation2017), Pandey and Kumari (Citation2021a, Citation2021b, 2021c), Pandey and Kumar (Citation2022), Rai and Pandey (Citation2022) and Ullah et al. (Citation2021), too, support the use of the market model for estimating the normal returns. We divide the methodology into five parts: determining the estimation and event window, calculating abnormal returns, cross-sectional aggregation of abnormal returns, calculation of test statistics, and interpretation of the results. We use the Brown and Warner (Citation1980, Citation1985) t-statistics and the Corrado (Citation1989) test (as simplified and modified by Ataullah et al. Citation2011).
2.2.1. Estimation and event window
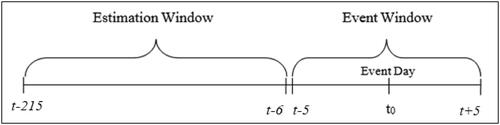
We need to define an estimation window just before the event window to estimate the normal returns. We consider the event day as 't' and consider the period some days before this date as the estimation period. We use a 210 days estimation window, thus, defining our estimation window as t-215 to t-6. We demonstrate the event timeline in , where t0 represents the event day for each of the nations. We examine the short-term impact of the travel restrictions and bans; hence, we define our event window as t-5 to t+5, also in Gong et al. (Citation2006, Citation2008) and Maneenop and Kotcharin (Citation2020). We further divide the event window as several pre-event (2), event (1) and post-event (2) windows [-5,-1], [-3,-1], [0,0], [+1,+3] and [+1,+5].
Figure 2. Event timeline.
Source: Drawn by authors
2.2.2. Calculation of abnormal returns
To calculate the abnormal returns, we first calculate the normal returns (expected or estimated returns) using the market model. The market model uses the α and β parameters derived from the regression between the airline stock returns and the respective benchmark index returns over the estimation window. The daily normal return, for the stock 'i' on day t are calculated as in EquationEquation (1)
(1)
(1) :
(1)
(1)
where LRmt is the benchmark index log returns on day t; and, α & β are the intercept and slope coefficients of the regression model. After that, we calculate the daily abnormal return,
as in EquationEquation (2)
(2)
(2) :
(2)
(2)
where LRit is the log return for the stock 'i' on day t; and
is the normal return for the stock 'i' on day t . We now have the daily abnormal returns for all the days through the estimation and event window.
2.2.3. Cross-sectional aggregation of abnormal returns
Event studies with multiple events and firms need the cross-sectional aggregation of the daily abnormal returns to calculate the average abnormal returns. This aggregation is done across the firms for the entire event window as per EquationEquation (3)(3)
(3) :
(3)
(3)
where (N) is the sample size.
The cross-sectional aggregation further demands the aggregation across time. Hence, the daily AARs are then used to calculate the smaller event window cumulative average abnormal returns (CAARs) for the sample firms, as also in (Mackinlay, Citation1997), as per Equation (4):
(4)
(4)
where CAARp,q is the cumulative average abnormal return for the window period p,q. For instance, the CAAR for window (-5,-1) will be the sum of the AARs for these five days.
2.2.4. Testing the significance of the abnormal returns
We need to test the abnormal returns for their statistical significance. We calculate the test-statistics as per Brown and Warner (Citation1980, Citation1985) in EquationEquations (5)(5)
(5) and Equation(6)
(6)
(6) :
(5)
(5)
where
is the aggregated estimation period standard deviation,
is the estimation-period variance for each of the sample firms.
(6)
(6)
where T is the number of days in the window period p,q.
Furthermore, the Corrado test statistic, a nonparametric test, developed by Corrado (Citation1989) as modified by Ataullah et al. (Citation2011) has been calculated for testing the significance of the daily average abnormal returns as a robustness test (Boubaker et al., Citation2022). Ataullah et al. (Citation2011) simplified the Corrado test as in EquationEquation (7)(7)
(7) :
(7)
(7)
where N is the sample size, T is the total number of days (in our case, it is 221), and K(ARit) is the rank of the abnormal return of the stock i in the 221 days.
Ataullah et al. (Citation2011) have also modified the Corrado equation to measure the t-statistics for the cumulative abnormal returns for shorter event windows. We calculate the modified Corrado test value as in EquationEquation (8)(8)
(8) :
(8)
(8)
where K(CARitM) is the sum of the K(ARit) for the period M, and M is the length of the Event Window.
3. Quantitative analysis and discussion
The summary statistics for the data used in the study are reported in . The mean daily log returns are positive for all the sample firms during the estimation and event window period except for International Consolidated Airlines S.A. (UK) and Global Vectra Helicorp Ltd. (India). The volatility in the returns is almost the same for all the sample firms. The minimum return ranges between −5.13% for Jet Airways (India) and −36.84% for International Consolidated Airlines S.A. (UK). The maximum return during the period ranges between 4.88% for Jet Airways (India) and 41.10% for Hawaiian Holdings Inc. (US). The Shapiro–Wilk normality test results reveal that the sample data are not normal.
Table 3. Summary statistics of the daily log returns during the estimation and event window period.
reports the average and cumulative average abnormal returns for the entire sample. The AARs on days t-4, t-3, t, and t + 2 are significant and negative, while the AAR on day t + 3 is significant and positive. The Corrado test values also exhibit similar results, except the AAR on day t-1 becoming significant and negative in place of the AAR on day t-2. The significant and negative figures on the event day indicate that the announcement of the travel restrictions/bans have impacted the global airline stock returns. The significant values in the pre-event day period indicate the possibility of anticipation about the restrictions/bans. The cumulative average abnormal returns are significant and negative on all the days through t-3 to t + 5. It indicates that the cumulative impact of the events has been strong and negative for the global airline industry.
Table 4. Average and cumulative average abnormal returns and the corresponding t-values during the event window for the entire sample (N = 34).
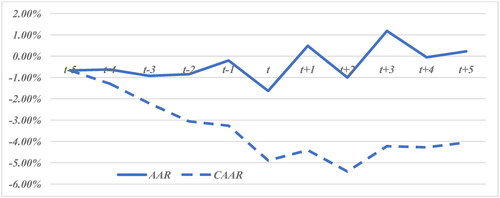
depicts the AAR and CAAR-lines wherein the CAAR-line is continuously moving downward from the day t-5. Although the AAR-line follows a W movement from day t-1 onwards, the gap between the AAR and CAAR-line increases with a trivial upward shift from day t + 3 onwards. The negative impact cannot be denied, as it is also found to be statistically significant.
Figure 3. Trend of AARs and CAARs during the event window for the entire sample.
Source: Drawn by the authors based on the results of the event study analysis
The country-wise shorter window CAARs are reported in . The CAARs for Hong Kong, UK, Australia, and Thailand, although mostly negative, are not significant for the pre-and post-event windows and also for the event window. However, three of these nations have experienced significant negative results in Maneenop and Kotcharin (Citation2020). Canada experienced significant negative CAAR only on the event day. However, in Maneenop and Kotcharin (Citation2020), Canada also experienced significant abnormal returns in the post-event window. India and the US experienced significant and negative abnormal returns in the pre-event and the event window. All the nations have insignificant abnormal returns in the post-event window, signifying that the measures taken by the governments during the last year have boosted the investor's confidence that has prevented them from overreacting.
Table 5. Country-wise shorter window cumulative average abnormal returns and the corresponding t-values.
The shorter window CAARs for the entire sample is reported in . The results exhibit that the pre-event and event window CAARs are negative and significant, but those in the post-event are positive and not significant. The results of the Corrado modified test are similar for the pre-event and event window but reflect positive and significant returns during the post-event window. It is evident that the post-event window abnormal returns are statistically equal to zero. However, the cumulative abnormal returns for the eleven-day event window signify that the cumulative effect of the announcements has been negative. However, it cannot be denied that the market has been relatively stable compared to the previous wave of the pandemic. In our case, all sample nations previously experienced significant negative abnormal returns. Maneenop and Kotcharin (Citation2020) exhibit insignificant post-event window abnormal returns. The one-year pandemic and the hopes after the vaccine drive have led to improved confidence among the market participants, which has ultimately saved the market from experiencing a further crash.
Table 6. Shorter window cumulative average abnormal returns and the corresponding t-values for the entire sample.
With the progress of the pandemic, governments all over the world are confident of facing its impacts in a prepared manner. Global markets fell by approximately 23% during the first quarter of 2020 (Pandey & Kumari, Citation2021b). However, the market recovery in most of the nations began in late April 2020. The case of the airline industry is not different. As also anticipated by Dube et al. (Citation2021), the opening up of airlines reasonably aided the global airline industry's efficiency. The investors have become hopeful of corrective measures that governments inject for supporting the deprived sectors during the pandemic. The Indian government already has air bubble agreements with about 27 nationsFootnote5, and the investors are aware of these agreements. With these agreements becoming active, the concerned airlines are not to remain inoperative, thus delaying the overreaction of the market to the stocks of the airline industry. One reason could be the impacts of the nationwide lockdowns. Last year experienced restrictions to domestic travel, too. However, the current wave is not backed by any restrictive domestic lockdowns restricting domestic air travel. As Abate et al. (Citation2020) suggest that governments prioritize maintaining air transport connectivity to gear up economic activities and jobs, the airline industry has already recovered the market value of its shares. However, assessing the government policies supporting the airline industry is a matter of further research. The possible causes of our findings may be that the stability in the covid-19 outbreak has made the investors capable of tackling the worst information related to the industry. The financial markets have already faced the wrath of the unprecedented pandemic; however, with increased government initiatives and the possible market failures being estimated, the investor's behavior can be predicted to follow a stable reaction. Although the travel restrictions and bans have impacted the global airline industry, the country-wise data indicate severe impacts on India and the US. Most of the nations have survived the statistical significance of the abnormal returns.
4. Conclusions and implications
With a sample of 34 airline stocks from seven nations, we employed the Brown and Warner (Citation1980, Citation1985) standard event study method to examine how the recent air travel restrictions and bans have impacted the global airline industry. As the robustness of the statistical findings, we are not dependent only on the t-test but also employed the nonparametric (Corrado, Citation1989) test as simplified and modified by Ataullah et al. (Citation2011). We get similar results using the latter. We find that the airline industry in the sample nations has survived the post-event windows' information effect. The nations, which have previously experienced significant negative impacts in the post-event window (Maneenop & Kotcharin, Citation2020), have survived the overreaction this time. This might result from the increased confidence among the market participants based on the experience during the last year. One possible reason could be that the current restrictions have not impacted domestic travel. Another possible reason could be that the restrictions during the last year were on a large scale; they involved more nations. However, the current restrictions are only on a few nations in the Asian region, too, with several active air bubble agreements. The event day's significant negative impacts signify that the market does provide opportunities to speculate. Although the market for the airline industry seems to have survived the announcements, the tax cut and subsidies, as suggested by Maneenop and Kotcharin (Citation2020), are yet signalling measures that need to be adopted consistently. This article contributes to the literature on the effects of the pandemic on the global airline industry. It also provides practical explanations to the investors on how the airline stocks react to the persistence of the pandemic. The study's findings will support the policymakers and investors to take corrective steps to safeguard their concerned interests during the unprecedented travel restrictions. The event window abnormal returns for the nations other than India and the US are not impacted by these bans. Hence, it is suggested that investors shift their funds to different markets to reduce the event-induced risk during a pandemic. Since the airline market has been found unsuitable for speculation on the event days, the investors are suggested not to engage in panic buying or selling. Instead, they should wait for the markets to recover. The overall findings suggest that the policymakers should re-access their strategic decisions in the future because when facing the complexities of the global risk factors during uncertain events, the previously existing strategies fail to limit the harm to the firm's value. The hedging and diversification policies also need to be reconsidered.
This study is different in its type since, along with the event study analysis of the travel restrictions/bans imposed by different nations during the second wave of the virus in India, it also summarizes the impacts on the quarterly earnings during the year 2020. This study is limited to the sample nations and does not examine the firm-specific variables that might have been the significant drivers of the CARs during the event windows. Future research may extend to include a few more nations and determine whether any specific characteristics of the firms impact the CARs. Future research may be conducted to examine the behavior of health and pharmaceutical sector stocks during the pandemic compared to this study.
Acknowledgements
The authors are thankful to the editors, and three anonymous reviewers for their constructive comments. The authors are also thankful to the Production editor Vijay Bagavan and his production team for the support all through the production of the manuscript.
Data availability statement
The data used in this study has been made available at Mendeley Data at Pandey and Kumari (Citation2021).
Disclosure statement
No potential conflict of interest was reported by the authors.
Notes
References
- Abate, M., Christidis, P., & Purwanto, A. J. (2020). Government support to airlines in the aftermath of the COVID-19 pandemic. Journal of Air Transport Management, 89, 101931. https://doi.org/10.1016/j.jairtraman.2020.101931
- Albers, S., & Rundshagen, V. (2020). European airlines' strategic responses to the COVID-19 pandemic (January-May, 2020). Journal of Air Transport Management, 87, 101863. https://doi.org/10.1016/j.jairtraman.2020.101863
- Ataullah, A., Song, X., & Tippett, M. (2011). A modified Corrado test for assessing abnormal security returns. The European Journal of Finance, 17(7), 589–601. https://doi.org/10.1080/1351847X.2011.554294
- Boubaker, S., Goodell, J. W., Pandey, D. K., & Kumari, V. (2022). Heterogeneous impacts of wars on global equity markets: Evidence from the invasion of Ukraine. Finance Research Letters, 48, 102934. https://doi.org/10.1016/J.FRL.2022.102934
- Brown, S. J., & Warner, J. B. (1980). Measuring security price performance. Journal of Financial Economics, 8(3), 205–258. https://doi.org/10.1016/0304-405X(80)90002-1
- Brown, S. J., & Warner, J. B. (1985). Using Daily stock returns: The Case of Event Studies. Journal of Financial Economics, 14(1), 3–31. https://doi.org/10.1016/0304-405X(85)90042-X
- Corbet, S., O’Connell, J. F., Efthymiou, M., Guiomard, C., & Lucey, B. (2019). The impact of terrorism on European tourism. Annals of Tourism Research, 75, 1–17. https://doi.org/10.1016/j.annals.2018.12.012
- Corrado, C. J. (1989). A nonparametric test for abnormal security-price performance in event studies. Journal of Financial Economics, 23(2), 385–395. https://doi.org/10.1016/0304-405X(89)90064-0
- Csereklyei, Z., & Stern, D. I. (2020). Flying more efficiently: Joint impacts of fuel prices, capital costs and fleet size on airline fleet fuel economy. Ecological Economics, 175, 106714. https://doi.org/10.1016/j.ecolecon.2020.106714
- Demiralay, S., & Kilincarslan, E. (2019). The impact of geopolitical risks on travel and leisure stocks. Tourism Management, 75, 460–476. https://doi.org/10.1016/j.tourman.2019.06.013
- Dube, K., Nhamo, G., & Chikodzi, D. (2021). COVID-19 pandemic and prospects for recovery of the global aviation industry. Journal of Air Transport Management, 92, 102022. https://doi.org/10.1016/j.jairtraman.2021.102022
- Dyckman, T., Philbrick, D., & Stephan, J. (1984). A comparison of event study methodologies using daily stock returns: A simulation approach. Journal of Accounting Research, 22, 1–30. https://doi.org/10.2307/2490855
- Forsyth, P., Guiomard, C., & Niemeier, H. M. (2020). Covid -19, the collapse in passenger demand and airport charges. Journal of Air Transport Management, 89, 101932. https://doi.org/10.1016/j.jairtraman.2020.101932
- Gillen, D., & Lall, A. (2003). International transmission of shocks in the airline industry. Journal of Air Transport Management, 9(1), 37–49. https://doi.org/10.1016/S0969-6997(02)00068-6
- Gong, S. X. H., Firth, M., & Cullinane, K. (2006). The information content of earnings releases by global airlines. Journal of Air Transport Management, 12(2), 82–91. https://doi.org/10.1016/j.jairtraman.2006.01.001
- Gong, S. X. H., Firth, M., & Cullinane, K. (2008). International oligopoly and stock market linkages: The case of global airlines. Transportation Research Part E: Logistics and Transportation Review, 44(4), 621–636. https://doi.org/10.1016/j.tre.2007.05.008
- Graham, A., Kremarik, F., & Kruse, W. (2020). Attitudes of ageing passengers to air travel since the coronavirus pandemic. Journal of Air Transport Management, 87, 101865. https://doi.org/10.1016/j.jairtraman.2020.101865
- Henderson, J. C., & Sadi, M. A. (2000). The Asian economic crisis and the aviation industry: Impacts and response strategies. Transport Reviews, 20(3), 347–367. https://doi.org/10.1080/014416400412841
- Ho, J. C., Qiu, M., & Tang, X. (2013). Do airlines always suffer from crashes? Economics Letters, 118(1), 113–117. https://doi.org/10.1016/j.econlet.2012.09.031
- IATA. (2021a). Number of scheduled passengers boarded by the global airline industry from 2004 to 2022. In Statistica- The Statistics Portal. Retrieved on 25/02/2022, from https://www.statista.com/statistics/564717/airline-industry-passenger-traffic-globally/
- IATA. (2021b). Year-on-year change in revenue passenger kilometers (RPK) of commercial airlines from 2011 to 2022 by region. In Statistica- The Statistics Portal. Retrieved on 25/02/2022, from https://www.statista.com/statistics/655422/revenue-passenger-kilometers-worldwide-air-traffic/
- Jeon, J.-H. (2021). The impact of tourism uncertainty on airline stock markets in Korea: A quantile regression approach. Journal of Business Economics and Management, 22(4), 923–939. https://doi.org/10.3846/jbem.2021.14668
- Kaplanski, G., & Levy, H. (2010). Sentiment and stock prices: The case of aviation disasters. Journal of Financial Economics, 95(2), 174–201. https://doi.org/10.1016/j.jfineco.2009.10.002
- Kumari, V., Rai, V. K., & Pandey, D. K. (2022). Impacts of pandemic-related stimulus packages on the stock market: Evidence from India and the United States. International Journal of Indian Culture and Business Management, 1(1), 1. https://doi.org/10.1504/IJICBM.2022.10046291
- Loh, E. (2006). The impact of SARS on the performance and risk profile of airline stocks. International Journal of Transport Economics, 33(3), 401–422. http://www.jstor.org/stable/42747811
- Mackinlay, A. C. (1997). Event studies in economics and finance. Journal of Economic Literature, 35(1), 13–39. http://www.jstor.org/stable/2729691.
- Maneenop, S., & Kotcharin, S. (2020). The impacts of COVID-19 on the global airline industry: An event study approach. Journal of Air Transport Management, 89, 101920. https://doi.org/10.1016/j.jairtraman.2020.101920
- Mollick, A. V., & Amin, M. R. (2021). Occupancy, oil prices, and stock returns: Evidence from the U.S. airline industry. Journal of Air Transport Management, 91, 102015. https://doi.org/10.1016/j.jairtraman.2020.102015
- Monmousseau, P., Marzuoli, A., Feron, E., & Delahaye, D. (2020). Impact of Covid-19 on passengers and airlines from passenger measurements: Managing customer satisfaction while putting the US air transportation system to sleep. Transportation Research Interdisciplinary Perspectives, 7, 100179. https://doi.org/10.1016/j.trip.2020.100179
- Pandey, D., & Jaiswal, A. (2017). Impact of demonetization on Indian stock market-an empirical study. Al-Barkaat Journal of Finance & Management, 9(2), 46. https://doi.org/10.5958/2229-4503.2017.00015.7
- Pandey, D. K., & Kumar, R. (2022). Lockdown, unlock, stock returns, and firm-specific characteristics: The Indian tourism sector during the Covid-19 outbreak. Current Issues in Tourism, 25(7), 1026–1032. https://doi.org/10.1080/13683500.2021.2005549
- Pandey, D. K., & Kumari, V. (2021a). An event study on the impacts of Covid-19 on the global stock markets. International Journal of Financial Markets and Derivatives, 8(2), 148–168. https://doi.org/10.1504/IJFMD.2021.10038839
- Pandey, D. K., & Kumari, V. (2021b). Event study on the reaction of the developed and emerging stock markets to the 2019-nCoV outbreak. International Review of Economics & Finance, 71, 467–483. https://doi.org/10.1016/j.iref.2020.09.014
- Pandey, D. K., & Kumari, V. (2021c). Do dividend announcements override the pandemic impacts? Evidence from the BSE 500 constituent firms. Asia Pacific Management Review, https://doi.org/10.1016/j.apmrv.2021.09.002
- Pandey, D. K., Kumari, V., & Tiwari, B. K. (2022). Impacts of corporate announcements on stock returns during the global pandemic: Evidence from the Indian stock market. Asian Journal of Accounting Research. https://doi.org/10.1108/AJAR-06-2021-0097
- Pandey, D. K., & Kumari, V. (2021). How the air travel restrictions to India impacted the global airline industry's stock returns? An Event Study Analysis, Mendeley Data, V1, https://doi.org/10.17632/wwcc8df345.1
- Rai, V. K., & Pandey, D. K. (2022). Does privatization of public sector banks affect stock prices? An event study approach on the Indian banking sector stocks. Asian Journal of Accounting Research, 7(1), 71–83. https://doi.org/10.1108/AJAR-06-2021-0078
- Sobieralski, J. B. (2020). COVID-19 and airline employment: Insights from historical uncertainty shocks to the industry. Transportation Research Interdisciplinary Perspectives, 5, 100123. https://doi.org/10.1016/j.trip.2020.100123
- Sun, X., Wandelt, S., Zheng, C., & Zhang, A. (2021). COVID-19 pandemic and air transportation: Successfully navigating the paper hurricane. Journal of Air Transport Management, 94, 102062. https://doi.org/10.1016/j.jairtraman.2021.102062
- Ullah, S., Zaefarian, G., Ahmed, R., & Kimani, D. (2021). How to apply the event study methodology in STATA: An overview and a step-by-step guide for authors. Industrial Marketing Management, 99, A1–A12. https://doi.org/10.1016/j.indmarman.2021.02.004
- Yun, X., & Yoon, S. M. (2019). Impact of oil price change on airline's stock price and volatility: Evidence from China and South Korea. Energy Economics, 78, 668–679. https://doi.org/10.1016/j.eneco.2018.09.015