
 ?Mathematical formulae have been encoded as MathML and are displayed in this HTML version using MathJax in order to improve their display. Uncheck the box to turn MathJax off. This feature requires Javascript. Click on a formula to zoom.
Abstract
This article discusses the changes in carbon productivity and economic growth patterns in China. We calculated carbon productivity using panel data from BRICS and G7 countries between 2001 and 2019 and developed a methodology to estimate economic growth patterns by combining carbon productivity and economic growth. As the world’s top carbon emitter, China can combat global climate change by increasing carbon productivity. We show that (i) China has a high growth rate of carbon productivity; however, the carbon productivity level only accounts for about 20% of developed countries. (ii) When determining economic growth patterns from a low-carbon perspective, China has transitioned from high-carbon type II to low-carbon type III. However, low-carbon economic growth is common in developed countries, and (iii) it can improve carbon productivity by reducing energy-averaged carbon emission factors. It assists the government in determining how to implement low-carbon economic development policies by examining economic growth from a low-carbon perspective.
1. Introduction
Controlling and mitigating climate change caused by rising fossil fuel consumption, as well as developing energy alternatives to fossil fuels, is one of the world's most pressing policy challenges today (Acemoglu et al., Citation2012; Ozcan et al., Citation2020). Fossil fuel consumption results in greenhouse gas emissions that contribute to climate change and other environmental problems (Usman & Makhdum, Citation2021; Cramer et al., Citation2018). Carbon dioxide emissions account for more than 80% of greenhouse gas emissions, intimately linked to economic growth (Mardani et al., Citation2019). Economic growth is critical for enhancing social welfare and increasing the population's standard of living. Economic growth at high-carbon intensity is unsustainable, and low-carbon action without economic growth is meaningless. Therefore, low-carbon economic research is predicated on the assumption of beneficial economic growth. Carbon productivity was chosen to bridge the divide between economic growth and environmental protection. This is the fundamental concept of low-carbon development, intending to reduce carbon dioxide emissions while increasing economic growth. Therefore, empirically elucidating the quantitative relationship between carbon productivity and economic growth is instructive for regulating low-carbon economies.
China's economy is booming, and it has implemented effective policies to boost economic growth, improve social welfare, and eradicate poverty. However, because of its crude production methods, which consume a lot of energy and emit a large amount of carbon dioxide, China has surpassed the United States as the world's leading carbon emitter; its actions are critical in the fight against climate change. China has integrated economic, financial, social, and environmental concerns into its efforts to shift away from high-carbon production patterns to implement carbon reduction (Gazheli et al., Citation2016) and declared a carbon-neutral agenda. Therefore, what is China's carbon productivity? What is the current rate of the increase in carbon productivity? How is carbon productivity related to economic growth? Previous studies have focused on the factors influencing carbon productivity or regional differences in carbon productivity, and some scholars have explained the mechanism between carbon productivity changes and green economic growth, but there is a lack of clear quantitative methods.
To answer these questions, we constructed a model linking carbon productivity and economic growth, using data from China (2001–2019). Subsequently, a new perspective on identifying economic growth patterns is provided using the contribution of carbon productivity to economic growth as a proxy for economic growth patterns. In terms of low-carbon economies, there is a gap between emerging and developed economies, and the size of this gap needs to be quantified. As a result, this study compares China's low-carbon economy to the BRICS (Brazil, Russia, India, China, and South Africa) and G7 developed economies (the United States, France, the United Kingdom, Germany, Italy, Japan, and Canada).
The remainder of this article is organised as follows. Section 2 discusses previous related research. In Section 3, we build a model to compare China's carbon productivity and economic growth patterns with BRICS and G7. We also examine the methods and mechanisms for increasing carbon productivity. The main conclusions and research outlook of this study are presented in Section 4.
2. Literature Review
Carbon productivity is a key metric for assessing low-carbon economic growth (Shen et al., Citation2021). Carbon dioxide emissions have become a binding indicator of commodity properties and an important indicator of economic growth, after labour productivity and capital productivity. Most studies adopt the definition of carbon productivity proposed by Kaya and Yokobori (Citation1997a), which is the ratio of GDP to CO2 emissions of an economy over a given period and is a single-factor measurement method (Li & Wang, Citation2019; Fan et al., Citation2021). The other is based on the full factor productivity measure, comprising labour and capita (Li & Wang, Citation2019; Fan et al., Citation2021). (Xian et al., Citation2018; Wang et al., Citation2019; Yang et al., Citation2021). We argue that measuring combined factor productivity, which includes labour and capital, takes into account multiple input factors but underscores the importance of carbon emission reduction under the dual carbon target, that is, combined productivity can be improved by improving labour and capital efficiency, but carbon emission reduction may not be effective. The government sets carbon reduction targets, primarily based on carbon intensity, the numerical logarithm of carbon productivity, and measures the carbon reduction effect; so this article calculates carbon productivity using a single-factor measurement method.
With the rapid development of the economy, economists are gradually recognising the cost of economic development, and the pursuit of quantitative economic growth is not sustainable. In recent years, the concepts of sustainable development, green development, and low-carbon development have emerged, and the key is to focus on how labour and capital are the two most important factors in production (Jorgenson et al., Citation1987). If labour factors contribute more to economic growth than capital factors, the approach is labour intensive, and vice versa for capital intensive. The concept of total factor productivity was introduced, and the theory of TFP-driven economic growth was developed (Saleem et al., Citation2019). Total factor productivity is also a manifestation of technological progress. However, under the low-carbon constraint, measuring economic growth approaches using carbon factors is a problem confronting the development of a low-carbon economy, and some scholars have expressed ideas in this direction, such as Stoknes and Rockström (Citation2018), who define grey growth, green growth, and absolute green economic growth patterns based on the decoupling theory (Grand, Citation2016; Tapio, Citation2005). They do so by setting a 5% carbon productivity growth rate and comparing it to an economic growth rate, thereby defining grey growth, green growth, and absolute green economic growth patterns. Additionally, they proposed that carbon productivity growth rates for developing and developed countries with higher economic growth rates should be different. Indeed, differences in economic growth rates result in disparate rates of carbon productivity improvement, but the authors only propose the idea qualitatively, from which the problem can be quantified using the concept of a contribution margin.
According to empirical research on carbon productivity, the economic ramifications of higher carbon productivity have received less attention. As a result, this study creates a logical link between carbon productivity and economic development and uses the rate of the rise in carbon productivity to forecast economic growth patterns. To conduct quantitative research on a low-carbon economy, we use the relationship between carbon productivity and economic growth as a foundation. We want to understand how a low-carbon economy will affect the economy.
3. Measurement and analysis of carbon productivity
3.1. Level of carbon productivity
3.1.1. Methodology
Based on the models constructed by Kaya and Yokobori (Citation1997b), a mathematical model of carbon productivity and GDP was constructed by focusing on the relationship between economic growth and carbon productivity. Under this model, GDP should increase significantly in the current period relative to the previous period; that is, the economic growth rate should not be less than zero or approximately equal to zero.
(1)
(1)
where
denotes China's GDP in period t,
denotes CO2 emissions in period t, and
denotes China's carbon productivity in period t. Furthermore, economic growth is decomposed into the development of carbon emissions, the development of carbon productivity, and the interaction of both. The decomposition model is expressed as follows:
(2)
(2)
Dividing both sides of the equation by we obtain the economic growth rate r:
(3)
(3)
where
and
denote the growth rates of carbon emissions and carbon productivity, respectively. To explore the contribution of each change to economic growth, both sides of the equation were divided by r:
(4)
(4)
where
donates the contribution of carbon emissions changes to economic growth;
donates the contribution of carbon productivity changes to economic growth;
donates the contribution of carbon emissions changes interacting with carbon productivity changes to economic growth.
(i) Once r is determined, the smaller the rc, the larger the rp; thus, the greater the ep, the better the economic growth patterns. Conversely, the larger the rc, the smaller the rp, and thus the worse the economic growth patterns. (ii) Once rc is determined, the higher the r, the smaller the ec, the larger the ep, and the better the economic growth mode. Conversely, the lower the r, the larger the ec, the smaller the ep, and the worse the economic growth mode.
3.1.2. Data Analysis
The essential parameters for determining carbon productivity were GDP and carbon emissions. According to the BRICS and G7 data, the average value of carbon productivity is $3.06 $1000/ton, with a huge variation between the minimum and maximum values, demonstrating that carbon productivity varies widely among countries (). The average GDP and carbon emission levels are USD 376.613 billion (in 2015$) and 1798.55 million tons, respectively, with considerable variances in GDP and carbon emissions between nations due to population, geographical region, and economic development stage (). The World Bank provides the economic data for each country. The data on carbon emissions and energy use were obtained from the ‘Our World In Data’ database (Ritchie & Roser, Citation2020).
Table 1. Descriptive Statistics.
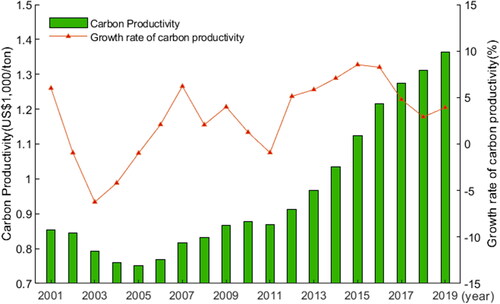
Carbon productivity refers to the amount of carbon emitted per unit of energy. Between 2001 and 2019, China's carbon productivity level decreased and then increased (). China's carbon productivity peaked at 0.85 US $1000/ton in 2001 before declining to 0.75 US $1000/ton in 2005. That is, between 2001 and 2005, China's economic growth rate was lower than its CO2 emission rate, highlighting the problems of high fossil fuel intensity and inefficient resource utilisation in the material production process. China's carbon productivity has been increasing steadily since 2006 and is expected to reach 1.36 US $1,000/ton by 2019. By examining the rate of growth of carbon productivity between 2002 and 2005, the growth rate of carbon productivity was negative, reaching a low of −6.24% in 2003. From 2003 to 2007, the growth rate of carbon productivity increased year by year, then fluctuated downward until 2012, when the construction of ecological civilisation was accelerated and the growth rate of carbon productivity increased, reaching a high of 8.5% in 2015, before slightly declining.
Figure 1. Carbon productivity and the growth rate of China.
Source: own calculations.
Although China's ecological civilisation has achieved remarkable results and carbon productivity has increased significantly, there is still a gap between developed and developing countries. Compared to the carbon productivity level in 2019 (), the carbon productivity levels of the UK, France, Italy, Germany, Japan, and the US were 8.65, 8.28, 5.64, 5.06, 4.15, and 3.8 thousand US $1,000/ton, respectively, all higher than China's 1.36 US $1000/ton. However, in terms of carbon productivity growth rate, China's average growth rate from 2001 to 2019 was 2.81%, higher than the United States (2.71%) and France (2.65%), among others. Ranking the carbon productivity level and average growth rate of each country separately in 2019, China's carbon productivity level ranks ninth, higher than India, Russia, and South Africa among the BRICS countries. However, China's average carbon productivity growth rate ranks second (). It is worth mentioning that the UK has the highest carbon productivity level and growth rate, while France, Germany, and the US have relatively higher carbon productivity levels and growth rates.
Table 2. Carbon productivity and growth rate correlation analysis.
3.2. Impact of carbon productivity on economic growth
3.2.1. The method of determining the economic growth method
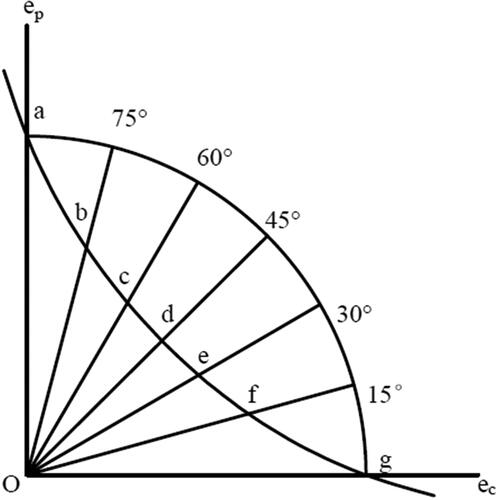
With vertical and horizontal coordinates, Yiqing and Dinghai (Citation2016) divided the economic growth pattern by introducing 30, 45, and 60-degree rays. We added 15-degree and 75-degree lines to this to further refine the division of economic growth patterns. 15-degree, 30-degree, 45-degree, 60-degree, and 75-degree rays from the origin of the coordinate system intersect the axes with the curves at points a, b, c, d, e, f, and g.
Definition: We define an economic growth method using the value of Above point a, it is a low-carbon I economic growth pattern. At this time, the carbon productivity growth rate is higher than the economic growth rate, indicating that the growth rate of carbon emissions is negative, This is consistent with the basic requirements of a low-carbon economy. When it is between points a and b, it is a typical carbon II economic growth pattern; when it is between points b and c, it is a low-carbon III economic growth pattern; when it is between points c and d, it is a medium-carbon I economic growth pattern; and when located at point d, it is a medium-carbon II economic growth pattern; when located between points d and e, it is a medium-carbon III economic growth pattern; when located between points e and f, it is a high-carbon I economic growth pattern; and when located between points f and g, it is a high-carbon II economic growth pattern. Below point g, it has a high-carbon III economic growth pattern. At this time, the carbon productivity growth rate is negative, indicating that the growth rate of carbon emissions is higher than the economic growth rate, and the high-carbon characteristics are obvious. Since the beginning of the 21st century, China's economic growth rate has maintained a medium-to-high growth rate; therefore, the case of an economic growth rate equal to 0 is not considered here, and the specific rules of determination are listed in .
Table 3. Economic growth mode interval.
is the critical point between low-carbon types I and II, and
at this point ().
Figure 2. Definition of economic growth patterns.
Source: self-drawing
is the crucial point between low-carbon types II and III. The curve intersects with the 75-degree ray, and the joint cubic equation system yields ().
is the critical point between low-carbon type III and medium-carbon type I (). The curve intersects with the 60-degree ray, and the system of joint cubic equations yields:
The curve intersects with a 45-degree ray, and the joint cubic equation system is obtained: d is the medium-carbon type II, that is, the critical point between the medium-carbon type I and medium-carbon type III economic growth methods ().
(9)
(9)
(10)
(10)
where e is the critical point between medium-carbon type III and high-carbon type I (). The curve intersects with the 30-degree ray, and the joint cubic equation system yields:
(11)
(11)
(12)
(12)
where f denotes the tipping point between medium-and high-carbon types I and II (). When the curve intersects the 15-degree ray, the joint cubic equation system produces the following:
(13)
(13)
(14)
(14)
where g is the critical point of transition between high-carbon types II and III (), and it represents, in summary, economic growth patterns that can be deduced by examining the fundamental issues surrounding economic growth rates.
3.2.2. Analysis of economic growth patterns
When decomposing the economic growth rate, the relative size of the carbon productivity growth rate to the economic growth rate determines the contribution of carbon productivity growth to the economic growth process. Generally, a country's economic growth, on the one hand, comes from the increase in the number of factor inputs or, in the context of this article’s research, the input of carbon factor resources, and as a result of an increase in productivity, that is, carbon productivity. Economic growth driven by factor inputs is expensive and unsustainable. Therefore, carbon productivity improvements should drive excellent economic growth to achieve high-quality growth. Hence, by measuring the economic growth pattern through the ratio of carbon productivity growth rate to economic growth rate, we divide 2001–2019 into two stages, 2001–2010 as the first stage and 2011–2019 as the second, and study the changes in China's economic growth pattern in both stages while using the economic growth patterns of BRICS and G7 countries as a comparison.
China's economic growth pattern shifted from high-carbon type II to low-carbon type III, and the contribution of carbon productivity growth to economic growth increased from 0.0806 to 0.6848 (), indicating that China's economic growth pattern was optimised and ecological civilisation construction was effective in both stages, which is inextricably linked to the rapid increase in carbon productivity. In comparison, the economic growth pattern of the BRICS countries is dominated by the high-carbon type, with Brazil and India being high-carbon countries in both phases. In contrast, the economic growth pattern in the G7 developed countries is dominated by low-carbon type I. Canada's performance in the second stage with a low-carbon type III economic growth pattern has deteriorated.
Table 4. Changes in China's economic growth patterns.
Through comparison, it was discovered that while China's carbon productivity level and economic growth mode are optimised and offer certain advantages among BRICS countries, there are still challenges in promoting economic growth while improving productivity and achieving high-quality growth compared to G7 developed countries. China must adhere to low-carbon development and scientific and technological progress to increase its carbon productivity growth rate.
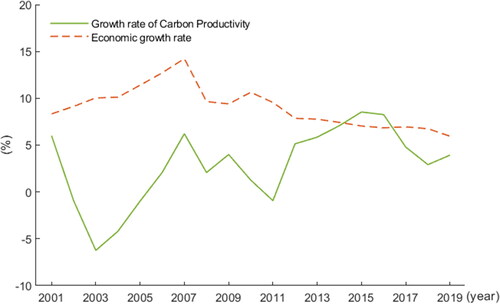
As a result of the increasing importance of carbon productivity in economic growth, China's economic growth pattern has been optimised in both phases. Between 2001 and 2019 (), China's economic growth rate fluctuated in two phases: 2001–2007, when the country's growth rate increased and the country grew quickly; and 2008–2019, when the country's growth rate decreased, and the country's growth rate slowed and gradually shifted from high growth to high-quality development. Carbon productivity growth has shown a rising pattern in China, with relatively small and unpredictable growth rates until 2011, then an increase beginning in 2012, surpassing economic growth rates in 2015 and 2016, and then dropping. Taken together, China's carbon productivity growth rate lagged behind its economic growth rate from 2001 to 2019, but as shown in , the gap between the carbon productivity growth rate and the economic growth rate was narrowing, and the contribution of carbon productivity growth to economic growth was increasing, resulting in the economic growth mode being optimised. This is the outcome of the combined effect of normalising economic growth and increasing carbon productivity, which has stabilised in recent years, and increasing the rate of carbon productivity growth is the key to optimising the economic growth mode.
Figure 3. Carbon productivity and economic growth.
Source: own calculations.
3.3. Analysis of Carbon productivity growth
According to the definition of carbon productivity, the key to optimising economic growth and promoting high-quality economic growth with carbon productivity improvement is to increase the rate of carbon productivity growth.
(15)
(15)
where
denotes energy consumption intensity, numerically equal to the ratio of energy consumption to GDP, and
denotes the average energy carbon emission factor, numerically equal to the ratio of carbon dioxide emissions to energy consumption. Let
and
denote the rate of increase in carbon productivity, rate of decrease in energy consumption intensity, and rate of decrease in carbon emission factor of energy consumption, respectively.
(16)
(16)
(17)
(17)
When and
are less than 1, a power series expansion of the denominator of EquationEquation (17)
(17)
(17) , omitting the second-order minima yields
(18)
(18)
The carbon productivity growth rate can be approximated as the sum of the rate of decrease in energy consumption intensity and the rate of decrease in the energy carbon emission factor. The concept of growth contribution rate can be obtained by multiplying both sides of EquationEquation (18)(18)
(18) by
(19)
(19)
where
is the contribution of the decrease in energy consumption intensity to carbon productivity growth, that is, the contribution of the restructuring of the economy to the decrease in energy demand, and
is the contribution of the decrease in the energy carbon emission factor to carbon productivity growth, that is, the contribution of the economy's optimisation of its energy structure to the decrease in the share of fossil energy consumption.
Measured in two stages, the data show that in the first stage, China's carbon productivity rose due to the decrease in energy consumption intensity, with a contribution of 122.15%, that is, the proportion of fossil energy consumption increased, and the average energy carbon emission factor rose in that period. In the second stage, the contribution of the decrease in the average carbon emission factor of energy in China reached 24.15%, and the proportion of clean energy to energy consumption increased, but compared with developed countries, the contribution of the United States is 33.26%, Germany is 36.24%, the United Kingdom is 37.16%, and Italy is 44.02. The key to achieving low-carbon development is replacing fossil fuels with clean renewable energy to achieve clean production (Ichisugi et al., Citation2019). This gradually increases the proportion of clean energy, thus reducing the average carbon emission factor of energy. Looking ahead to the 14th Five-Year Plan, China has proposed a target of reducing energy consumption intensity by 18% and carbon emission intensity by 13.5% by 2025 compared to 2020. To accomplish this target, Mc should reach 27.04%, higher than the current value of 24.15%. Therefore, the contribution of energy structure optimisation to carbon productivity must be further enhanced.
4. Conclusions
This study proposes a model linking carbon productivity and economic growth rate, enriching the macroscopic study of carbon productivity and economic growth compared to studies that examine the factors influencing carbon productivity (Liu & Zhang, Citation2021) or the relationship between carbon productivity and other partial elements constituting economic growth (Pan et al., Citation2020; Hu & Wang, Citation2020), measuring carbon productivity in absolute efficiency, and proposing a method for measuring carbon productivity in absolute efficiency.
Maintaining economic growth while lowering carbon dioxide emissions is currently one of the most difficult tasks facing countries. In a study by Long et al. (Citation2016) and others, China's average carbon productivity was one-third of the global average. With China's rapid improvement in carbon productivity, this study finds that it is now slightly higher than one-half of the world average, but there is a gap between it and developed countries. Bai et al. (Citation2019) examined the carbon productivity of 88 countries and found that it rose by 63.5%, but there were huge disparities across countries; this article looks at the same large discrepancy between BRICS and G7 countries. Sheng et al. (Citation2021) used the decoupling performance of economic growth and carbon dioxide emissions, a manifestation of the increased role of carbon productivity on economic growth. However, the results of this study, which determine the economic growth mode by the contribution of carbon productivity to economic growth, which is continuously optimised, are more intuitive.
Increasing the pace of carbon productivity growth is key to improving economic growth. The sum of the rate of decrease in energy consumption intensity and the rate of decline in the average energy carbon emission factor is generally equal to the rate of increase in carbon productivity. Lowering the average carbon emission factor and fulfilling the target established in the 14th Five-Year Plan can be achieved by optimising the energy structure and boosting the percentage of clean energy. However, there are certain limitations to the findings presented in this article. In theory, the assumption of the economic growth method should be positive economic growth, and if the economy is in a slump, the economic growth method loses its purpose as well. However, when the economic growth rate is close to or below zero, the method developed in this study is less appropriate and requires additional refinement in mathematical and theoretical methodologies. Low-carbon development is not a goal in itself; the primary goal of economic growth is to raise people's living standards. It is important to emphasise the role of carbon productivity during the critical period of carbon reduction, but it is also important to focus on carbon productivity as total factor productivity in the long run. Constructing comprehensive factor productivity that includes labour, capital, and carbon is the next research focus.
Disclosure statement
The authors report there are no competing interests to declare.
References
- Acemoglu, D., Aghion, P., Bursztyn, L., & Hemous, D. (2012). The environment and directed technical change. The American Economic review, 102(1), 131–166.
- Bai, C., Du, K., Yu, Y., & Feng, C. (2019). Understanding the trend of total factor carbon productivity in the world: Insights from convergence analysis. Energy Economics, 81, 698–708. https://doi.org/10.1016/j.eneco.2019.05.004
- Grand, M. C. (2016). Carbon emission targets and decoupling indicators. Ecological Indicators, 67, 649–656. https://doi.org/10.1016/j.ecolind.2016.03.042
- Cramer, W., Guiot, J., Fader, M., Garrabou, J., Gattuso, J.-P., Iglesias, A., Lange, M. A., Lionello, P., Llasat, M. C., Paz, S., Peñuelas, J., Snoussi, M., Toreti, A., Tsimplis, M. N., & Xoplaki, E. (2018). Climate change and interconnected risks to sustainable development in the Mediterranean. Nature Climate Change, 8(11), 972–980. https://doi.org/10.1038/s41558-018-0299-2
- Fan, L.-W., You, J., zhang, W., & Zhou, P. (2021). How does technological progress promote carbon productivity? Evidence from Chinese manufacturing industries. Journal of Environmental management, 277, 111325.
- Gazheli, A., van den Bergh, J., & Antal, M. (2016). How realistic is green growth? Sectoral-level carbon intensity versus productivity. Journal of Cleaner Production, 129, 449–467. https://doi.org/10.1016/j.jclepro.2016.04.032
- Hu, W., & Wang, D. (2020). How does environmental regulation influence China’s carbon productivity? An empirical analysis based on the spatial spillover effect. Journal of Cleaner Production, 257, 120484. https://doi.org/10.1016/j.jclepro.2020.120484
- Ichisugi, Y., Masui, T., Karkour, S., & Itsubo, N. (2019). Projection of national carbon footprint in Japan with integration of LCA and IAMs. Sustainability, 11(23), 6875. https://doi.org/10.3390/su11236875
- Jorgenson, D., Gollop, F. M., & Fraumeni, B. (1987). Productivity and US economic growth. Economic Journal, 100(399), 274.
- Kaya, Y., & Yokobori, K. (1997a). Environment, energy, and economy: Strategies for sustainability. United Nations University Press.
- Kaya, Y., & Yokobori, K. (1997b). Environment, energy, and economy: Strategies for sustainability. United Nations University Press.
- Li, S., & Wang, S. (2019). Examining the effects of socioeconomic development on China's carbon productivity: A panel data analysis. The Science of the Total environment, 659, 681–690.
- Liu, X., & Zhang, X. (2021). Industrial agglomeration, technological innovation and carbon productivity: Evidence from China. Resources, Conservation and Recycling, 166, 105330. https://doi.org/10.1016/j.resconrec.2020.105330
- Long, R., Shao, T., & Chen, H. (2016). Spatial econometric analysis of China’s province-level industrial carbon productivity and its influencing factors. Applied Energy, 166, 210–219. https://doi.org/10.1016/j.apenergy.2015.09.100
- Mardani, A., Streimikiene, D., Cavallaro, F., Loganathan, N., & Khoshnoudi, M. (2019). Carbon dioxide (CO2) emissions and economic growth: A systematic review of two decades of research from 1995 to 2017. The Science of the Total environment, 649, 31–49. https://doi.org/10.1016/j.scitotenv.2018.08.229
- Ozcan, B., Tzeremes, P. G., & Tzeremes, N. G. (2020). Energy consumption, economic growth and environmental degradation in OECD countries. Economic Modelling, 84, 203–213. https://doi.org/10.1016/j.econmod.2019.04.010
- Pan, X., Li, M., Wang, M., Chu, J., & Bo, H. (2020). The effects of outward foreign direct investment and reverse technology spillover on China's carbon productivity. Energy Policy, 145, 111730. https://doi.org/10.1016/j.enpol.2020.111730
- Ritchie, H., & Roser, M. (2020). CO2 and greenhouse gas emissions. Retrieved from 'https://ourworldindata.org/co2-and-other-greenhouse-gas-emissions'
- Saleem, H., Shahzad, M., Khan, M. B., & Khilji, B. A. (2019). Innovation, total factor productivity and economic growth in Pakistan: A policy perspective. Journal of Economic Structures, 8(1), 7. https://doi.org/10.1186/s40008-019-0134-6
- Shen, N., Peng, H., & Wang, Q. (2021). Spatial dependence, agglomeration externalities and the convergence of carbon productivity. Socio-Economic Planning Sciences, 78, 101060. https://doi.org/10.1016/j.seps.2021.101060
- Sheng, P., Li, J., Zhai, M., & Majeed, M. U. (2021). Economic growth efficiency and carbon reduction efficiency in China: Coupling or decoupling. Energy Reports, 7, 289–299. https://doi.org/10.1016/j.egyr.2020.12.043
- Stoknes, P. E., & Rockström, J. (2018). Redefining green growth within planetary boundaries. Energy Research & Social Science, 44, 41–49. https://doi.org/10.1016/j.erss.2018.04.030
- Tapio, P. (2005). Towards a theory of decoupling: degrees of decoupling in the EU and the case of road traffic in Finland between 1970 and 2001. Transport Policy, 12(2), 137–151. https://doi.org/10.1016/j.tranpol.2005.01.001
- Usman, M., & Makhdum, M. S. A. (2021). What abates ecological footprint in BRICS-T region? Exploring the influence of renewable energy, non-renewable energy, agriculture, forest area and financial development. Renewable Energy, 179, 12–28. https://doi.org/10.1016/j.renene.2021.07.014
- Wang, G., Deng, X., Wang, J., Zhang, F., & Liang, S. (2019). Carbon emission efficiency in China: A spatial panel data analysis. China Economic Review, 56, 101313. https://doi.org/10.1016/j.chieco.2019.101313
- Xian, Y., Wang, K., Shi, X., Zhang, C., Wei, Y.-M., & Huang, Z. (2018). Carbon emissions intensity reduction target for China's power industry: An efficiency and productivity perspective. Journal of Cleaner Production, 197, 1022–1034. https://doi.org/10.1016/j.jclepro.2018.06.272
- Yang, H., Lu, Z., Shi, X., Mensah, I. A., Luo, Y., & Chen, W. (2021). Multi-region and multi-sector comparisons and analysis of industrial carbon productivity in China. Journal of Cleaner Production, 279, 123623. https://doi.org/10.1016/j.jclepro.2020.123623
- Yiqing, W., & Dinghai, H. (2016). Beijing-Tianjin-Hebei carbon productivity and economic growth—Compared with Yangtze River Delta and Pearl River Delta. Economy and Management, 03, 5–8+27.