
 ?Mathematical formulae have been encoded as MathML and are displayed in this HTML version using MathJax in order to improve their display. Uncheck the box to turn MathJax off. This feature requires Javascript. Click on a formula to zoom.
Abstract
The former communist states experienced a period of turbulence in the transition to the market economy and then the accession to the EU, turbulences that also influenced the education sector. This article aims to analyze the impact of public spending on education on economic growth in 11 former communist Eastern European states, current EU members. The methodology used is ARDL with structural break. The results are consistent with those previously obtained The public education expenditure-economic growth relationship is mixed on long term; for five countries, there is no such thing; for six countries, there is one on a long term. On a short term, also, mixed results manifest for four countries are positive, and for two negative.
1. Introduction
The education is a major engine in terms of the level and the rate of the economic growth for all countries. People are at the basis of all economic processes, so that the qualities and skills of human capital have a direct impact on the results of economic processes and, therefore, on economic growth and development. Consequently, the higher the level of skills acquired by individuals, the more sustained is the level of general well-being of individuals and the healthier the economic growth.
Regardless of the stage of development of a state, the education system must be organized in such a manner to prepare individuals (who are able to integrate and to coordinate the next level of development), for professions, which at the time of studies (educational path) still does not exist. This is possible only as far as the educational policy is the result of a strategic vision of the respective nation, which focuses on qualified teachers, an attractive funding base of the education system and a sustained and accelerated personal development rate, including a market economy based on fair principles. All decision-makers, public and private, collective or individual, internal or external, must be involved in this process so that future generations of employees are currently prepared for jobs that will be created in the future, and which will require a series of special skills (Wagner, T. 2008).
Until the 1990s, Central and Eastern European states had a centralized communist education system, strongly mimicking the Soviet system. The political and economic transformations generated by the fall of communism also led to major changes in the educational system. The main changes in the educational system of Eastern European countries were decentralization and thus increasing autonomy; transition to pluralistic curriculum and textbooks; involvement of local authorities and parents in school life; increasing the number of graduates with secondary and tertiary education. All these changes have led to the adoption of European standards, and especially of the Bologna process, so that in the end the Europeanization of the educational systems of the Eastern countries can take place. However, this change in Eastern education systems is not complete, many of which are still behind in international education rankings.
National education systems contain specific elements, which individualize them and differentiate them from each other. Regarding the country level factors, previous studies (Di Gioacchino, et al., Citation2019) reveal elements that may affect the redistributive content of public spending such as: the level of inclusion of the education system, the way of allocating public expenditures between primary and tertiary education, even income inequality or tax evasion.
In terms of the organization of primary and secondary education, three models are highlighted in European countries: single structure, where all students follow a common curriculum providing general education from the beginning to the end of compulsory education, common core curriculum, where all students in lower secondary level follow the same general common core curriculum, and a differentiated lower secondary education. (European Commission/EACEA/Eurydice, Citation2020). The structure of the education system in the chosen countries to be analyzed is presented in .
Table 1. The structure of the education systems 2020/21.
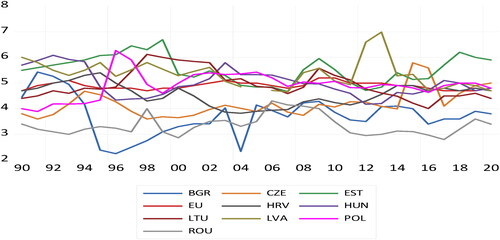
In addition, the GDP percentage that is intended to finance education is extremely different across Eastern European countries. Thus, if we consider the figures from 1990-2020, the lowest level of the percentage of GDP allocated to education is found in Romania, 3.35% of GDP (percentage decreasing compared to recent years). In the immediate proximity of Romania, we find Bulgaria (3.72% of GDP), Czech Republic (4.19%) and Slovakia (4.11%), while the average expenditure on education in the EU is 4.89% of GDP. Close to the European average percentage, we find Croatia (4.57%), while other Eastern European countries allocates bigger percentage to support education (Estonia 5.54%; Hungary 5.1%; Latvia 5.36%; Poland 4.90; Slovenia 5.47%), as shown in .
Figure 1. Total general government expenditure on education, 1990–2020 (% of GDP).
Source: Eurostat
Considering all these aspects, the purpose of this article is to analyze and highlight, using relevant indicators, the impact of public expenditure for education on the economic growth of the eleven states in Central and Eastern Europe. The methodology used is the analysis of time series using autoregressive distributed lag (ARDL). Most previous studies have been conducted over short periods of time and usually in groups of countries. The advantage of the ARDL methodology is that it can combine different integration time series, I (0), I Equation(1)(1)
(1) or mixed. The endogeneity that usually appears in econometric analyses is surpassed by the ARDL methodology. Structural breaks that occur in time series can be easily integrated by using ARDL. Our results show that the use of education expenditures has mixed effects: for six countries out of eleven there are long-term relationships, but for the remaining five these relationships do not manifest. Also, short-term relationships influence these results either negatively or positively.
Our article contributes to the existing literature in the following research directions. First of all, it analyzes the real effects that education spending has on GDP in Central and Eastern European countries, members of the EU, a region covered by few studies, most of which treating this issue singularly at country level. Secondly, a longer period of time is analyzed, respectively starting from 1990, which can lead to a more real identification of the phenomena that took place in the Eastern communist countries. Thirdly, the methodology we used considers the analysis of time series, performed separately for each country. Previous studies generally use a panel methodology, with countries being treated generally, not individually.
Our study is structured as follows: the first Section presents an introduction, Section 2 provides an overview of the impact of public spending and other factors on economic growth. Section 3, we presents the econometric data and methodology, while the next section highlights the results of our analysis, and the last Section presents the conclusions of the analysis.
2. Literature review
The specialized literature has given a special importance to the analysis of the impact of public expenditures on education on economic growth, the results of these previous studies generating various conclusions, depending on the countries, periods or economic-institutional context considered in the models approached.
In the below we have highlighted, in alphabetical order, some of the most relevant articles that analyze the impact of public education spending on economic growth:
Table 2. The impact of public education spending on economic growth.
As can be seen from the previous table, there are two main results reached by other authors who studied the education – economic growth relationship. On the one hand, the researchers highlighted a positive relationship between public education spending and economic growth, and on the other hand, the results showed the negative effects of public education spending on economic growth.
The first direction is given by many researchers who show that education contributes significantly to country's economic growth. This result is analyzed and demonstrated starting from the theory of endogenous growth which considers the population as the main factor of production; the increase of the education level of the population leads to an increased productivity, which will generate an increase in GDP. For these authors (Barro (Citation2001); Blankenau (Citation2004); Benos and Zotou (Citation2014); Suri et al. (Citation2011)), there is a direct and positive relationship of influence between education and economic growth. Barro (Citation2001) analyzes over 100 countries for the period 1960-1995, and shows that school attainment positively influences GDP growth. Abington & Blankenau (Citation2013) analyzes over 70 countries and establishes a positive relationship between education spending and GDP growth. Also, Benos, and Zotou. (Citation2014) conduct a meta-analysis of 989 studies dealing with the study of the effects of education on GDP and establish that most articles conclude its positive effect. Teixeira, Aurora AC, and Anabela SS Queirós. (Citation2016) analyze OECD countries using dynamic panel data and reach a series of nuanced conclusions about the effect of education on GDP: overall, for highly developed countries and for long periods of more than 50 years, the effect is positive; but in the relatively short term (20 years) and for less developed countries, the effect is negative, being determined mainly by the lack of technological development. Ogundari, Kolawole, and Titus Awokuse. (Citation2018) analyze 35 countries in Africa for the period 1980-2008 and conclude that education has a positive role on GDP growth. Suri et al. (Citation2011) show the important role that education, and especially public policies adopted for young people, has on economic growth, analyzing 110 countries for a period of 30 years using panel data. Chikalipah and Okafor. (Citation2019) analyzes the relationship between education and economic growth using time series methodology and reaches a series of mixed conclusions: in the long run there are links between variables, but as an influence, only GDP influences education and not the other way around. Matousek and Tzeremes. (Citation2021) analyzes the relationship between human capital and GDP for 100 countries, in the period 1970-2014, and concludes that this relationship is positive and significant; however, the authors show that this relationship is non-linear, especially between skilled and unskilled workers. Kiran (Citation2014) analyzes 18 Latin American countries for the period 1970-2009 using VECM methodology and discovered that for eleven countries there is a link between education expenditure and GDP growth, but for seven countries this long-term relationship is not manifested.
The second direction of results shows that there is a negative relationship between education expenditures and economic growth or even no relationship at all. Devarajan et al. (Citation1996) analyzes 43 countries for the period 1970-1990 and shows that there is a negative relationship between education spending and GDP. After studying 52 countries between 1960 and 1990, find that the contribution of education to economic growth is very low. Pritchett (Citation2001) shows, after studying 70 countries over a period of 25 years, that there is no link between human capital and GDP growth, the author's explanations starting from a mix of factors: institutional environment, decreasing accumulation rates in the case of education; quality of education. Annabi et al. (Citation2011) analyze the effects of education on GDP in Canada and show that these effects are mixed and even non-existent depending on the age of the people and the fiscal policy used. Churchill and Yew. (Citation2017) show that government spending on education has a positive effect on developed countries; instead, for less developed countries, the effect is insignificant.
Based on the previous cited literature, the formulated working hypotheses will take into account whether:
H0: There is significant impact of public education spending on economic growth; and
H1: There is no significant impact of public education spending on economic growth.
It is very important to find out how much the education factor weighs in the development and the economic growth of these countries, in order to be able to develop recommendations on how governments should approach education in their development strategies.
We formulate working hypotheses will take into account whether:
H3: There is positive impact of public education spending on economic growth; and
H4: There is negative impact of public education spending on economic growth.
3. Data and methodology
Our article aims to study the relationship between the level of public education spending and economic growth in eleven European countries (Central and Eastern Europe), analyzing a period of 30 years, from 1990 to 2020: Bulgaria (BGR);Czech Republic (CZE); Estonia (EST); Croatia (HRV); Hungary (HUN); Lithuania (LTU); Latvia (LVA); Poland (POL); Romania (ROU); Slovak Republic (SVK); Slovenia (SLV). The data are collected from data series published by Eurostat, United Nations World Population Prospects and official statistics of national banks.
(1)
(1)
To achieve this goal we start from a linear function, based on the Cobb-Douglas production model. The Cobb-Douglas production function with 3 production inputs will be the following:
(2)
(2)
Where: Yt represents production, Kt physical capital, Lt the labor factor, A, α, β positive constants.
In this function, an important factor of production is labour. The function presented in Equationequation 1(1)
(1) considers work as a homogeneous factor, not taking into account the changes within it. By taking into account the expenditures on education made by the states, the equation no. 1 is modified accordingly in:
(3)
(3)
By logarithm of Equationequation 2(2)
(2) , the following form is obtained:
(4)
(4)
For output (Yt) it was considered as the independent variable real GDP per capita growth expressed in purchasing power parity for the year 2000; as the main factor for the education policy the indicator of public education expenditures was considered. The following control variables were also used in the model: Gross fixed capital formation (GFCF); labor force participation; trade openness, as shown in the . The data sources are Eurostat, the IMF and the official statistics of the national banks.
Table 3. Variables used in analysis.
Under these conditions, the previous equation can be written:
(5)
(5)
We used The ARDL econometric model to perform the analysis in this article considering the following premises: the analyzed macroeconomic series have a different degree of integration, I (0) and I Equation(1)(1)
(1) , which makes this method suitable for analysis for short and long term; the model can be used for relatively short time series; the issues resulting from autocorrelation can be eliminated.
This methodology involves completing 5 steps to perform the analysis, each step having its own tests. The first step of the analysis is the analysis of the stationarity of the time series; the ARDL model allows the combination of series I (0) and I Equation(1)(1)
(1) , but does not allow the analyzed series to be I (2); the test used to perform the analysis is Augumented Dickey Fuller unit root test. The second step is the identification and analysis of structural break in time series; being a macroeconomic series with important changes after the '90s, it is easy to assume that they have a structural break; the test used for this step is the Zivot-Andrews unit root test; after identifying the structural break a dummy variable will be introduced which will take the value of 0 until the structural break and 1 after the structural break. The third stage of the analysis is testing the cointegration between the variables using F-statistics corresponding to ARDL methodology. The fourth step is to calculate the links between long-term variables, so that the last step is to calculate the short-term links. Under these conditions, equation no. 4 becomes:
(6)
(6)
where: a1-a5 are the short-term coefficients of the model; b1-b6 are the long-term coefficients of the model.
4. Results
The data used in this article for the eleven former communist Eastern European countries are annual data for the period 1990-2020. The data are taken from the World Bank indicator and the IMF. The GDP per capita growth (GDPgr) is expressed in USD per capita at 2000 parity rate; the education expenditure (EducExp), gross fixed capital formation (GFCF), labour force (Labor) and trade openness (trade) are expressed as percentage of GDP.
As can be seen from the data in , where the average values were calculated, there is a category of five countries with high values for education expenditures (Estonia, Hungary, Latvia, Poland and Slovenia), four countries with values averages over 4% (Croatia, Czechia, Lithuania and Slovakia) and two countries with values of 3% (Bulgaria and Romania). The most developed eastern states are the Czech Republic, Estonia, Lithuania and Slovenia with GDP per capita exceeding $20,000 in purchasing power parity, and the least developed, Bulgaria, Romania and Latvia with GDP per capita below 17,000.
Table 4. Statistics descriptive mean.
Testing the series seasonality is the first step in our analysis. For the application of the ARDL model, the series must be stationary I (0) or I Equation(1)(1)
(1) , specifying that the ARDL model also uses combined series of stationarity I (0) and I Equation(1)
(1)
(1) , without the series being order I (2). For all series the test used for stationarity is Augmented-Dickey-Fuller (ADF), to ensure that the series are stationary of 0 and 1 order. The results of the ADF test are shown in . The results presented in show that GDP per capita, Education Expenditure shows level 1 stationary, being series I Equation(1)
(1)
(1) . GFCF, Labor force and Trade openness have mixed stationary type 0 and 1, depending on the country. These results presented in shows that the series are a combination of stationary 0 and 1 and that under these conditions the ARDL model can be successfully applied.
Table 5. Augmented Dickey-Fuller test statistic.
A common problem in time series analysis is related to the occurrence of structural break. These changes in the series stationary regime can lead to inconclusive results, affecting the degree of stationarity. Under these conditions, to prevent these problems, we will use the Zivot and Andrews Test which corrects the stationarity in the presence of a structural break. The results of Zivot and Andrews Test are presented in . As can be seen from the results of the table, GDP per capita shows a structural break for most of the analyzed countries, during the financial crisis of 2008-2010, which can be explained by the special amplitude of the negative phenomenon. For Education expenditure, for most analyzed countries, the structural break points are in the period prior to 2000, the period in which the respective states aligned their education systems with the European standards.
Table 6. Zivot and Andrews test for unit roots with one structural break.
The test of the cointegration between the variables represents the next methodological step, the testing being performed through F-statistics. The existence of cointegration occurs if the F-statistic test result is higher than the upper limit indicated by the statistic. The results are presented in , where it can be seen that for some countries there is cointegration between the analyzed variables. Thus, for six countries out of eleven analyzed, the F-statistic values are higher than the upper limit of 3.38 for the probability of 5% (Bulgaria, 19,589; Croatia, 3,429; Czech Republic, 16,230; Estonia, 4,287; Hungary, 10,554; Latvia, 9042). For these six countries, based on the previous results, there is a long-term relationship of cointegration between the variables. For the other five countries, the F-statistic values are lower than the lower limit of 3.06 (Lithuania, 3,048; Poland, 2,139; Romania, 3,002; Slovakia, 3,030; Slovenia, 2,971). For these five countries, there is no long-term relationship, and there can be no cointegration between the analyzed variables. The findings show that for these countries H1 (there is no relantionship between variables) is supported. The lack of cointegration between education expenditure and GDP was also manifested in the analysis performed by Devarajan et al. (Citation1996), Pritchett (Citation2001), Churchill et al. (Citation2017).
Table 7. Bound testing for existence of a level relationship.
For the six countries for which the cointegration between variables is manifested, we will move on to the next step, the analysis of long and short term coefficients. The results regarding the existence of cointegration relations for the 6 countries are in accordance with those obtained by Barro (Citation2001), Blankenau & Cassou (Citation2011), Suri et al. (Citation2011). The first hyphothesis, H0 (there is a relantionship between public education spending and economic growth) is confirmed for Eastern European countries.
After testing for cointegration, the long-term estimates are presented, presented in . The results in the table below show that for Bulgaria (0.104), Croatia (0.161) and Estonia (0.076) there is no significant impact of education expenditure on GDP. These results are consistent with those obtained by Baro (2004), Blankenau & Cassou (Citation2011), Suri et al. (Citation2011).
Table 8. Estimated long-run coefficients for economic growth.
For Czech Republic, there is a positive (0.350) and significant (0.001) impact of education expenditure on GDP. The significance of this influence presupposes that, in the conditions of keeping the other factors unchanged, a 1% increase of the public expenditures with education will lead to an increase of 0.350 of GDP per capita, in the long run. This result is consistent with that obtained by Benos and Zotou (Citation2014).
For Hungary, education spending also has a positive (1,421) and significant (0.013) impact on GDP per capita. Given the 1% increase in education expenditures, there is an increase in GDP per capita in the long run by 1,421. The results are similar to those obtained by Teixeira and Queirós (Citation2016). For these two countries, the results show that hypothesys H3 is supported (the relantionship between variables are a positive one).
In contrast, for Latvia, the results are opposite: public education spending has a negative (-1,488) but significant (0.020) impact on GDP per capita growth. The significance of the negative coefficient of public spending shows that this variable does not influences the GDP growth in Latvia. This result is contrary to the endogenous theory that GDP growth is influenced by education. The H4 hyphothesis (between variables there is a negative relantionship) is confirmed for this country. However, the results are consistent with those obtained by Kiran (Citation2014), Churchill et al. (Citation2017).
presents the short-term results for the 6 countries analyzed. For Bulgaria, the impact of public spending on education has 3 components: at time 0, the impact is negative (-0.046) and statistically significant, so that at subsequent times t-1 and t-2 the impact is positive (0.198; 0.109) and statistically significant. For Czech Republic, the impact of public spending on education is achieved on 2 components: at time 0, the impact is positive (0.115) and statistically significant (0.000) and at time t-1 the impact is negative (-0.086) but significant (0.001). The results obtained in our study are in line with the positive long-term trend. The studies developed by Baro (2004), Blankenau & Cassou (Citation2011), Suri et al. (Citation2011) show results similar to those obtained for the Czech Republic in our study.
Table 9. Estimation of short-run relationship.
For Estonia, in the short term, the impact of education expenditures has 3 components: at time t0 it is positive (0.371) and statistically significant (0.016), at time t-1 it is negative (-0.877) and significant, and at time t-2 it is still negative (-0.191) but statistically insignificant. For Hungary, in the short term, the impact of education spending is positive (0.229) and statistically significant (0.000). Similar to the long-term evolution, the 1% increase in education expenditures leads to a 0.229% increase in GDP in the short term. The results obtained are consistent with those obtained by Benos and Zotou (Citation2014), Teixeira and Queirós (Citation2016).
For HRV (Croatia), the impact of education expenditures occurs in contrast to their wording: initially at time t0, it is negative (-0.048) and statistically insignificant, but at time t-1 it is positive (0.164) and statistically significant. For Latvia, the impact of education expenditures is out of phase: at time 0, it is negative (-0.198) and statistically significant (0.000), and at time t-1 it is positive (0.074) and significant (0.029). The results look similar to those obtained for long-term evolution. These values are in line with the values obtained by Kiran (Citation2014), Churchill et al. (Citation2017) in their studies.
Spending on education is crucial to achieve economic growth and, ultimately, the sustainable development of a country. In the long run, public education spending has a positive effect for the Czech Republic, Estonia and Hungary, similar to the results obtained by Kiran (Citation2014) and Churchill et al. (Citation2017). The effects are stronger in Estonia and Hungary, and weaker in the Czech Republic. For Latvia, these effects are negative, as in the studies of Devarajan et al. (Citation1996). In the short term, the cumulative effects are positive for Bulgaria, Croatia, the Czech Republic and Hungary. This means that public spending can influence GDP in terms of its growth and economic prosperity. For Estonia and Latvia, however, the cumulative effects are negative in the short term, which shows that if they try to influence GDP by increasing spending, the effect will be negative.
5. Discussion
The analysis in this article looked at whether or not there is an impact of public spending on education on economic growth in eleven Eastern European countries.
Eastern European countries were under the influence of communism until 1990 and had an education system based on the Soviet model. After 1990 and the collapse of communism, major economic and social transformations took place. These transformations also had an effect on education, an activity with a strong socio-economic impact. Thus, it went from a communist educational system to a European one in all the analyzed states.
The transformations involved decentralization, autonomy and diversification. The directions of action involved the transition from a centralized education system decided from the center to one based on decision-making at the local level depending on the needs of students. The second direction was given by the increase of the autonomy of the schools, especially of the universities that obtain an academic and financial independence in the educational system. The third direction was the diversification of the curriculum and the textbook, each teacher and school having the freedom to choose their own educational activity. The last direction was the adoption of the European education system, and everything that the Bologna process entails: standards of accreditation for every component; semeser periods; introduction of IC&T into the educational process.
Our analysis was an ARDL type with structural break being performed during 1990-2020. This showed some interesting results, in line with the literature in the field.
For six countries (Bulgaria; Croatia; Czech Republic; Estonia; Hungary; Latvia) there are long-term cointegration relations between public educaton spending and economic growth. The results obtained are similar to those of Barro (Citation2001); Benos (2014); Ogundari and Awokuse (Citation2018), Suri et al. (Citation2011),
For Bulgaria, although public spending on education is below the EU average, it still influences economic growth. Investments in education have increased in the last decade, especially in the part of physical infrastructure and IC&T resources. In order to attract valuable teachers, a series of salary increasing measures were taken into practice. Vocational education has become of great importance, the national enrollment average being above the European one.
Croatia allocates for education GDP percentage close to the European average. The Croatian educational system is a good one due to the hard work and enthusiasm of dedicated teachers. The curriculum and compulsory subjects for students, much higher than in the EU, generates highly motivated students. Croatian students are very good at learning foreign languages, most of them knowing at least two. Vocational education is experiencing a special development far exceeding the EU average (Cvecic & Sokolic, Citation2018).
The Czech Republic has a positive relationship between public education spending and economic growth. The Czech educational system is based on a number of prestigious and internationally recognized schools. The rate of early school leavers is very low, well below the EU average. Vocational education is strongly developed, the participation rate exceeding 70%. The Czech university system is a formidable one with an increased autonomy for universities, very low fees and a high percentage of foreign students (over 25% of the total) (Kabók et al., Citation2017).
For Estonia, financial allocations for education are above the European average, leading to a long-term link between the two variables. Decentralization is the basis of the Estonian education system, with schools receiving funding from several sources: government, local authorities and companies. The widespread introduction of IC&T makes this system one of the first in the EU. The educational system benefits from academically qualified teachers at all levels of education, who have educational autonomy and social prestige (Dudzevičiūtė et al., Citation2018).
Hungary allocates a similar percentage to the EU average for education. This country has a highly developed university system, with a higher percentage of the population with a university degree than the EU average. A characteristic of the Hungarian educational system is the strong vocational education and the massive cooperation between companies and school institutions (Kabók et al., Citation2017).
For Latvia, financial allocations for education are higher than the EU average, generating a long-term relationship between education and economic growth. The latvian education system has benefited from massive investments in infrastructure, their percentage being above the EU average. Latvian students show good results in international tests, above the OECD average in science. A characteristic of late education is hobby education (extra curricular education) in various fields (technical, sports, arts) with percentages of over 70% participation for students ((Dudzevičiūtė et al., Citation2018).
For the other five Eastern countries (Lithuania, Poland, Romania, Slovakia, Slovenia), there is no long-term cointegration relationship between public education spending and economic growth. Our results are similar to those of Devarajan et al. (Citation1996); Pritchett (Citation2001); Annabi et al. (Citation2011); Churchill and Yew (Citation2017).
For Lithuania, although public funding for education is slightly higher than the EU average, there is no long-term relationship between the variables. Although Lithuania have sufficient funding, the level of students in Lithuania is well below that of other countries. The Lithuanian educational system has a large number of educational institutions, derived from communism, and which no longer correspond to the current demographics in a sharp decline. Under these conditions, financial allocations, although high, become inefficient (Dudzevičiūtė et al., Citation2018).
Romania has the lowest budget allocations for education in the EU. In these conditions, the contribution of education to economic growth is not manifested in reality. The Romanian educational system manifests itself differently for urban-rural environments, to the detriment of the latter, as a proportion of school attainment and graduation (Masca et al., Citation2019). High early school leaving is a fundamental problem of the Romanian educational system, this being the third highest in the EU, with proportions of over 18%.
In turn, Slovakia has low education expenditures that do not generate adequate economic growth. The Slovak educational system is unattractive and obsolete, focusing more on theoretical learning than on the transmission of real skills. Major inequities are manifested in the Slovak education system for rural students and vulnerable groups, who manage less than 25% to finish school. Another worrying phenomenon is the brain drain of students to the Czech Republic, over 50% of young Slovaks study in the neighbouring country.
Poland is close to the EU average in terms of public spending on education. However, the Polish educational system does not contribute to the economic development of the country, the causes being diverse. Especially after 2010, there were sudden and disordered changes in the educational system that generated chaos among students. The great predilection of Polish students towards the social sciences to the detriment of the engineering ones makes the integration of the graduates on the labour market to be extremely deficient. Another major cause is the strong Polish emigration; many young people with education have left their country of origin to contribute to the economy of other states (Cvecic & Sokolic, Citation2018).
For Slovenia, public spending on education is higher than the EU average, in the case of this country we can talk about their inefficiency. The share of over 50% of students and the high degree of school dropout in technical education means that, amid the closure of factories, many young graduates do not find work. The educational policy in this country is too independent and without implying cooperation with other social sectors (Kabók et al., Citation2017).
6. Conclusions
The purpose of this article is to investigate the impact of education spending on economic growth in Eastern European countries, former communists, current EU members. The methodology used was ARDL with structural break and the period was 1990-2020 .
The results obtained for the European countries are in line with those obtained by other studies in the field. For six Eastern European states (Bulgaria, Croatia, Czech Republic, Estonia, Hungary, and Latvia), we have discovered long-term interconditioning relationships between education spending and GDP, with results on short term positive or negative. For the others five countries, (Lithuania, Poland, Romania, Slovakia, Slovenia) there is no long-term relationship, and there can be no cointegration between the analyzed variables, so we could not continue the analysis, by going through the specific stages of the chosen methodology. Thus, we will chose another methodology in order to estimates the impact of public spending on education on economic growth.
As for policy implications, the six states (Bulgaria, Croatia, Czech Republic, Estonia, Hungary, Latvia) we analyzed in this study must improve the effectiveness of public policies in the field of education, especially in terms of the level of students enrollment and of knowledge accumulation.
Eastern European countries need to improve their education systems in order to have a competitive position in the knowledge economy. This can be done by increasing the cognitive and adaptive skills of students. A series of measures must be adopted by educational systems such as participation in lifelong learning programs, the development of competencies in the technical and IC&T fields, the improvement of teachers' competencies, the recognition and development of a qualitative system in adult learning.
Correlating education with labor market requirements is another challenge for these countries. The measures that should be implemented aim at developing partnerships with all the social actors involved; sustainable mechanisms for public financing of education; knowledge of individual skills required by the labor market.
However, Eastern European states also face major structural problems that will affect the education market in the near future: the aging population, the high emigration rate and the declining population. All this must lead to public policies to improve the quality of general education, the adoption and implementation of lifelong learning programs for the adult population, to ensure an adaptive and competitive labor force.
Disclosure statement
No potential conflict of interest was reported by the authors.
References
- Abington, C., & Blankenau, W. (2013). Government education expenditures in early and late childhood. Journal of Economic Dynamics and Control, 37(4), 854–874. https://doi.org/10.1016/j.jedc.2012.12.001
- Acemoglu, D., Aghion P., & Zilibotti F. (2006). Distance to frontier, selection, and economic growth. Journal of the European Economic Association 4(1), 37–74. http://doi.org/10.1162/jeea.2006.4.1.37
- Annabi, N., Harvey, S., & Lan, Y. (2011). Public expenditures on education, human capital and growth in Canada: An OLG model analysis. Journal of Policy Modeling, 33(6), 852–865. https://doi.org/10.1016/j.jpolmod.2011.08.020
- Bassanini, A., & Scarpetta, S. (2001). Les moteurs de la croissance dans les pays de l'OCDE: analyse empirique sur des données de panel. Revue Économique de l'OCDE, (2), 7–58.
- Barro, Robert, J. 2001. Human capital and growth. American Economic Review, 91(2), 12–17. https://doi.org/10.1257/aer.91.2.12
- Benos, N., & Zotou, S. (2014) Education and economic growth: a meta-regression analysis. World Development, 64, 669–689, ISSN 0305-750X. https://doi.org/10.1016/j.worlddev.2014.06.034
- Blankenau, W. & Cassou, S (2011). Industry estimates of the elasticity of substitution and the rate of biased technological change between skilled and unskilled labour. Applied Economics, Taylor & Francis Journals, 43(23), 3129–3142. https://doi.org/10.1080/00036840903476361
- Blankenau, W. F., & Simpson, N. B. (2004). Public Education expenditures and growth. Journal of Development Economics, 73, 583–605. https://doi.org/10.1016/j.jdeveco.2003.05.004
- Blankenau, W. F., Simpson, N. B., & Tomljanovich, M. (2007). Public education expenditures, taxation, and growth: Linking data to theory. American Economic Review, 97(2), 393–397. https://doi.org/10.1257/aer.97.2.393
- Cvecic, I., & Sokolic, D. (2018). Impact of public expenditure in labour market policies and other selected factors on youth unemployment. Economic Research-Ekonomska Istraživanja, 31(1), 2060–2080. https://doi.org/10.1080/1331677X.2018.1480970
- Chikalipah, S., & Okafor, G. (2019). Dynamic linkage between economic growth and human development: Time series evidence from Nigeria. Journal of International Development, 31(1), 22–38. https://doi.org/10.1002/jid.3390
- Churchill, S. A., & Yew, S. L. (2017). Are government transfers harmful to economic growth? A meta-analysis. Economic Modelling, 64, 270–287. https://doi.org/10.1016/j.econmod.2017.03.030
- Churchill, S. A., Ugur, M., & Yew, S. L. (2017). Government education expenditures and economic growth: A meta-analysis. The BE Journal of Macroeconomics, 17(2), 142–171. https://doi.org/10.1515/bejm-2016-0109
- Cullison, W. (1993). Public investment and economic growth. FRB Richmond Economic Quarterly, 79(4), 19–33.
- Dao, M. Q. (2012). Government expenditure and growth in developing countries. Progress in Development Studies, 12(1), 77–82. https://doi.org/10.1177/146499341101200105
- Devarajan, S., Swaroop, V., & Zou, H. F. (1996). The composition of public expenditure and economic growth. Journal of Monetary Economics, 37(2-3), 313–344. https://doi.org/10.1016/S0304-3932(96)90039-2
- Dissou, Y., Didic, S., & Yakautsava, T. (2016). Government spending on education, human capital accumulation, and growth. Economic Modelling, 58, 9–21. https://doi.org/10.1016/j.econmod.2016.04.015
- Dudzevičiūtė, G., Šimelytė, A., & Liučvaitienė, A. (2018). Government expenditure and economic growth in the European Union countries. International Journal of Social Economics, 45(2), 372–386. https://doi.org/10.1108/IJSE-12-2016-0365
- European Commission/EACEA/Eurydice. (2020). The structure of the european education systems 2020/21: Schematic diagrams. Eurydice facts and figures. Publications Office of the European Union.
- European Education and Culture Executive Agency, Eurydice, Baïdak, N., Sicurella, A., & Matti Riiheläinen, J. (2020). The structure of the European education systems 2020/21: schematic diagrams, European Commission. https://data.europa.eu/doi/10.2797/39049
- Di Gioacchino, D., Sabani, L., & Tedeschi, S. (2019). Individual preferences for public education spending: Does personal income matter? Economic Modelling, 82, 211–228. https://doi.org/10.1016/j.econmod.2019.01.007
- Ifa, A., & Guetat, I. (2018). Does public expenditure on education promote Tunisian and Moroccan GDP per capita? ARDL approach. The Journal of Finance and Data Science, 4(4), 234–246. https://doi.org/10.1016/j.jfds.2018.02.005
- Kabók, J., Radišić, S., & Kuzmanović, B. (2017). Cluster analysis of higher-education competitiveness in selected European countries. Economic Research-Ekonomska Istraživanja, 30(1), 845–857. https://doi.org/10.1080/1331677X.2017.1305783
- Kiran, B. (2014). Testing the impact of educational expenditures on economic growth: New evidence from Latin American countries. Quality & Quantity, 48(3), 1181–1190. https://doi.org/10.1007/s11135-013-9828-2
- Mallick, L., Das, P. K., & Pradhan, K. C. (2016). Impact of educational expenditure on economic growth in major Asian countries: Evidence from econometric analysis. Theoretical & Applied Economics, 23(2), 173–186.
- Masca, S. G., Nistor, S., & Vaidean, V. L. (2019). Do government arrangements matter for CEE countries’ growth? A two-piece puzzle perspective. Applied Economics Letters, 26(19), 1612–1626. https://doi.org/10.1080/13504851.2019.1591582
- Matousek, R., & Tzeremes, N. G. (2021). The asymmetric impact of human capital on economic growth. Empirical Economics, 60(3), 1309–1326. https://doi.org/10.1007/s00181-019-01789-z
- Ogundari, K., & Awokuse, T. (2018). Human capital contribution to economic growth in Sub-Saharan Africa: Does health status matter more than education? Economic Analysis and Policy, 58, 131–140. https://doi.org/10.1016/j.eap.2018.02.001
- Pesaran, M. H., Shin, Y., & Smith, R. J. (2001). Bounds testing approaches to the analysis of level relationships. Journal of Applied Econometrics, 16(3), 289–326. https://doi.org/10.1002/jae.616
- Pritchett, L. (2001). Where has all the education gone?. World Bank. https://openknowledge.worldbank.org/handle/10986/17434
- Suri, T., Boozer, M. A., Ranis, G., & Stewart, F. (2011). Paths to success: The relationship between human development and economic growth. World Development, 39(4), 506–522. https://doi.org/10.1016/j.worlddev.2010.08.020
- Teixeira, A. A., & Queirós, A. S. (2016). Economic growth, human capital and structural change: A dynamic panel data analysis. Research Policy, 45(8), 1636–1648. https://doi.org/10.1016/j.respol.2016.04.006
- Wang, B. (2005). Effects of government expenditure on private investment: Canadian empirical evidence. Empirical Economics, 30(2), 493–504. https://doi.org/10.1007/s00181-005-0245-9
- Zeira, J. (2009). Why and how education affects economic growth. Review of International Economics, 17(3), 602–614. https://doi.org/10.1111/j.1467-9396.2009.00836.x