
Abstract
The coronavirus (COVID-19) pandemic has shaken the global economy and significantly affected the financial markets. This anxiety triggered panic reactions. The article aims to explain impact of abrupt changes in structural stability of four key asset markets due to pandemic. It includes a detail discussion regarding structural change in co-movement of stock indices, exchange rates, minerals and metal returns. The daily returns of 14 financial indices across four groups during a span of 25 January 2019 to 3 February 2021 are sampled. The selection of financial assets is based on trading volume and velocity in each of the four groups. The results of Markov Switching model explain that pandemic not only increase volatility of financial markets but also have a significant long-term impact on structural behaviour in daily returns. The analysis further reveals differences in co-movement of financial returns during two periods. However, on a positive note, pandemic does make a way for few financial assets to dominate the market, especially ones recognised as ‘safe-haven’ assets.
1. Introduction
On 30 January 2020, the World Health Organization (W.H.O.) announced outbreak of new virus strain SARS-CoV-2 (WHO, Citation2020a) and classified it officially as a worldwide epidemic on 11 March 2020 (Maier & Brockmann, Citation2020). As a result, worldwide economies in 2020 were confronted with severe challenges. The emergencies created a significant impact on psychological and behavioural aspects of investors, which in return created a substantial effect on share prices in financial markets (He et al., Citation2020). Spillover effects were observed, such as oil movement correlation with stock returns (Elsayed & Abdelrhim, Citation2020). Moreover, exchange rate resilience changed and the majority of returns exhibit an oscillating and depreciating evolution (Narayan et al., Citation2020). The states advised people to practice ‘staying home’ (WHO, Citation2020b) in order to beat the pandemic, a situation that led to severe falls in production and consumption in specific sectors. For example, the crude oil price crashed during the first quarter of 2020. The countries in total (partial) isolation recorded a decline of 25% in energy request until the half of April 2020 (International Energy Agency, Citation2020). However, agricultural commodity prices exhibits an insignificant drop, except in rubber (Ezeaku et al., Citation2021). Considering ‘safe-haven’ assets, investors began to include precious metals in their portfolios, for instance gold (Bouri et al., Citation2020).
The pandemic impact on international stock markets is difficult to predict and quantify because of economic sector fluctuations. According to statistics, many major stock markets throughout the world lost about 20% of their initial worth (Segal & Gerstel, Citation2020).The market value of S&P indicators fell to 30% due to COVID-19 outbreak and a very high level of uncertainty influences the profitability rate (Azimili, Citation2020). Further studies (Schoenfeld, Citation2020) justifies inverse impact on S&P 500 stock profitability but a less significant impact on Nasdaq indicator. Similarly, the impact of the pandemic on the Dow Jones indicator is observed significant. Studies show that on 16 March 2020, indicator recorded an almost 3,000 points drop and had the highest precentral loss in one day, after a negative situation recorded in 1987, when it crashed (Ambros et al., Citation2021). A recently published study (Maheta & Shah, Citation2021) based on the confirmed COVID-19 cases number and the closing price of Dow Jones Indicator on 21 January 2020–31 May 2020, emphasised that the COVID-19 pandemic has a positive impact on price of stock market in a short run, by applying the Johnsen integration test. Hence, the first research question proposed what is the nature and direction of COVID-19 shock on individual stock indices and how its impact is transmitted within a market?
Another financial market which suffered the highest impacts of the pandemic is exchange rates (Narayan et al., Citation2020). Currencies suffered strong depreciation, and the portfolio investors have important losses, accentuated as the local currencies and exchange rate remains unsteady (Hofmann et al., Citation2021). During the period 10 May 2020 and 3 January 2021, exchange rate of the U.S. dollar compared to Euro dropped by 13.5%, a fact which affects the dollar's role as a reserve currency (Fetiniuc et al., Citation2020). The yen–dollar exchange rate volatility expansion identified as positive resilient, without any statistical signification during the COVID-19 pandemic (Kim, Citation2020). Similarly, the G.B.P. fell against the U.S. dollar by more than 12% during the first quarter of 2020 (BBC news, 18 March 2020). However, the impact of the pandemic observed on the Canadian exchange rate was less significant and it suggested that an element critical in short-term dynamics of Canadian–US dollar relationship is petroleum price (Kurita & James, Citation2020). Similarly, it is well-known that the evolutions specific to U.S. dollar currency in the U.S.A. and Europe affect the exchange rate of the Swiss franc. There are authors for whom the Swiss franc represents a secure refuge currency for reserves (Lee, Citation2017), yet another part of this domain's representatives declines the previous opinion adhesion, considering the Swiss franc an insecure option in terms of refuge currency quality (Hossfeld & MacDonald, Citation2015). However, the literature suggests that the pandemic had a negative impact on both the demand and supply sides of international commerce, while trade restrictions and currency rate fluctuations had no significant impact on Swiss trade in the first half of 2020 (Büchel et al., Citation2020). This preplex relationship of various exchange rates and pandemic impact leads to formulate second research hypothesis as follows: How COVID-19 impact exchange rate returns against U.S. dollar and what is the behaviour of ‘safe-haven’ currencies during turmoil period?
Next, the pandemic brought an unprecedented risk degree, inclusively on the petroleum market, through the severe petroleum price drop and American stock exchange evolution. The investors suffered large losses in a very short period of time. Neither the financial crisis from 2008 does not equal the dramatic effects the pandemic brought on the petroleum and shares markets volatility. Further, the pandemic effects are felt on the petroleum market, unable to be yet calculated at their true dimension (Zhang & Hamori, Citation2021). During the current pandemic, petroleum recorded the lowest price of all times (Štulec, Citation2020). Strategies, measures and rehabilitation policies of the order are required on this market, which suffered unprecedented and very strong modifications. Recent research has identified a bilateral effect of contagion of petroleum and gold bubbles during the pandemic (Gharib et al., Citation2021). In this context, gold shall be mentioned as a refuge or cover against crude oil prices risks (Salisu et al., Citation2021). The petroleum price strongly influences many sectors including the natural gas market (Abadie, Citation2021). The energetic systems from all over the world were affected by the pandemic, investments fell, and the enlargement of certain technologies in the field was stopped. At the beginning of the year 2020, the world natural gas market suffered the biggest negative shock on demand, because of both the virus and warm temperatures in certain regions (International Energy Agency, Citation2020). The petroleum and natural gas markets recorded very high-risk levels during the pandemic (Nyga-Łukaszewska & Aruga, Citation2020). In the coal market some authors tried to evaluate the pandemic effects, as well as the recovering perspectives, in the medium- and long-term, for coal production and trade (Parra et al., Citation2021). For the moment, it is observed that the coal price remained stable, but as a pandemic impact, it is expected in the short- and long-term that there will be a price drop for this on the market, at a global level (Azarova & Mier, Citation2021). Hence we investigated: What is the strength of financial integration in the minerals market and how do oil, gas and coal returns react to the COVID-19 crisis?
Finally, the precious metals markets are an integrated part of the general financial market, with a very important role in financial flows redistribution, currently under the direct influence of pandemic factors (Baranova et al., Citation2020). Due to this pandemic, an important drop in petroleum price was recorded, as well as significant growth in gold price (Bora & Basistha Citation2021). The precious metals prices reached the highest tops at all times, and the speculations in this sector are numerous (Sifat et al., Citation2021). During any crises period, market risks may be covered by the gold evolution on the market, which can be an option for investment and diversification (Adekoya et al., Citation2021). The gold offers better protection against exogenous shocks caused by the pandemic, yet the refuge it offers to the investors was more efficient in the previous pandemic period (Salisu et al., Citation2021). Gold is recognised as a precious metal for investment and is risk-averse. In fact, gold is secure and active on financial markets, energy markets and during inflation growth, and it is used by many central banks as active in their reserves. The gold market suffered a significant impact with regard to both price and the entire industry as a whole (Calvimontes et al., Citation2020). The pandemic impact in this sector is complex and unpredictable, with a direct effect on gold prices. However, some researchers (Syahri & Robiyanto, Citation2020) remarked the same volatility structure in the gold price, exchange rate and key stock indices during COVID-19. If some types of investment portfolios are not encouraged, others constitute diversification opportunities, including silver investment. During the pandemic, the silver volatility indicator exceeded the jump observed in the global financial crisis (Shaikh, Citation2021). Similar to the previously mentioned gold and silver, platinum may be used as a rebalancing instrument of the investors' portfolio to minimise or cancel risks (Salisu et al., Citation2021). Precious metals, including platinum, offer a better coverage efficiency than the individual portfolios of their own capital, including during the pandemic. The COVID-19 pandemic does not have a significant statistical impact on the exchange rate of precious metals, including platinum (Hassan & Gavilanes, Citation2021). Finally, the last research question of this study is formulated as follows: How does COVID-19 impact the ‘safe-haven’ metal assets like gold, and what strength of financial integration exists among gold, silver and platinum?
Summing up, this article aims to shed light on the impact of abrupt changes in the structural stability of important assets in various markets due to COVID-19. This research provides investors and policymakers with a reasonable guideline regarding trading patterns in various financial markets during turmoil periods such as COVID-19. The financial markets are selected, keeping in view that these four categories attract the highest investors from all around the world. The top 14 different financial assets across four different markets are selected based on the trading volume in each market. By employing the Markov Switching model, our results explain that COVID-19 not only increased the volatility of financial markets but does have a significant long-term impact on structural behaviour in the majority of markets. Our analysis reveals that stock market exhibits the earliest reaction to pandemic. Financial contagion effect is also observed. Financial integration among few assets increased during crises period whereas few returns exhibit a new co-movement behaviour. However, on positive note, results also indicates that the pandemic does make a way for few financial assets to enter into the market, especially the ones recognised as ‘safe-haven’ assets.
In conclusion, our study contributes to the existent recent literature in three fundamental ways. First, we investigate the COVID-19 pandemic impact on the most important four global major markets. Second, this research identifies the markets, which reacted most favourably in the conditions generated by the pandemic. Practically, we explore the reaction capacity of every market to the pandemic. Third, the results identify two latent states for 14 different financial assets. One which exhibits a normal market condition and another explaining the crises period. This can help investors to make a clear comparison between two market states and potential diversification opportunities of the portfolio in each particular condition.
The rest of the article is organised as follows. Section 2 describes the data and methodology applied for estimation of the results. Section 3 presents results and discussions. Section 4 offers conclusions and limitations of the study.
2. Data description and methodology
In order to carry out the empirical analysis, daily prices of 14 selected financial indices across four different groups during a span of 25 January 2019 to 3 February 2021 are sampled. On 25 January 2020, W.H.O. situation report 5Footnote1 documented the presence of 1,320 cases globally and hence the data for preceding year is selected to provide meaningful comparison. This justifies the starting date of a sample. The authors started research in February 2021 which restricted them accessing data beyond the end date. The selection of financial assets is based on the top trading volume and velocity in each of the four groups. The list is provided in . The motivation of current study is to analyse the crisis impact of COVID-19, hence the data for preceding year is selected only to provide meaningful comparison. It is known that the future prices not only reflect quantitative estimates but also exhibits the market sentiments of the investors (Yang, Citation2021). Hence, the daily future price data is collected and converted into log-returns. This consequently convert the financial returns series stationary in all cases too.
Before applying an econometric model, the correlation structure among assets in four different groups using Karl Pearson formula is examined. Next, each return series is checked for the presence of structural break. Although a number of structural break tests are available, but we assume the break point is unknown and the impact of COVID-19 is persistent on financial returns, the Zivot and Andrews (Citation2002) structural break test with innovational outlier approach is carried out. We conducted the structural break test as per Eviews, Citation2017. The default settings are ‘innovational outlier approach’ and in trend and break specifications, ‘trend and intercept’ is considered in all cases. Once the structural break is established in all financial returns, we proceed to an econometric approach which examines structural relationship of assets in each group and how the relationship is changed with respect to different financial returns behaviour. We assume the presence of two different periods during the sample time. This is justified since the structural break test identified only one break in all cases. Markov switching models (Hamilton, Citation1989) are the class of dynamic regression models which characterises time-variation in parameters with respect to latent states governed by Markov chain. The model is considered a good representation when the spontaneous change in co-movement of financial markets is a question of interest or in the case of event-study analysis. The latent state is unobservable and characterised by the common switching of all variables from one time period to the next. The current state value is determined by the transition probability based on previous state value. In other words, the model does not assume timing of an event to occur, but relies on the stochastic process that explains the intensity of an event and characterises the state. Hence, the probability of being in another state based on the current state is calculated and the expected time duration in each state is also determined. The model captures the non-linear and non-symmetrical returns patterns effectively too. This research assumes that financial returns data in various markets between 2019 and 2021 is governed by the mixture of two distributions. One which explains the low stress period behaviour of the financial markets presumably in 2019 and the other representing the high stress period covering COVID-19 from 2020 onwards. Although our hypothesis already proved in the majority of cases when the unit root test of a structural break was applied, but how the event impacted the individual parameters in terms of conditional mean return or volatility is still a question of interest. Further, the Markov switching model also reveals the differences in the co-movement impact of various financial indices in each of the markets during the two periods. Initially, to examine the appropriate Markov switching model for various financial indices, Bayesian Information criteria (B.I.C.) is considered and the one with least value is selected. Three different model specifications are examined. The first model assumes that the conditional mean and volatility is not changed by state transition, the second assumes that the conditional mean of stochastic process is different in low and high stress periods, and finally the last model assumes that conditional volatility varies in low and high stress periods, respectively. The test is implemented as per Stata, A. (Citation2015) and the initial checks of model adequacy are performed using log-likelihood maximisation whereas the post-estimation model checks include residual analysis.
3. Results and discussion
The empirical analysis is carried out in three different stages: The first subsection presents preliminary analysis which explains the descriptive statistics, breakpoint test results and optimal model selection using B.I.C. values. The next subsection entails main findings of analysis. It includes a detailed discussion regarding the structural change in co-movement of selected stock indices due to pandemic, the impact of COVID-19 on exchange rate returns, the reaction of selected minerals during crisis period and finally the impact of COVID-19 on precious metals market. The last subsection briefly explains the forecasting performance and model adequacy through residual analysis of selected financial indices.
3.1. Preliminary analysis
list the descriptive statistics for sample financial returns. The results implies that in stock market, Dow Jones exhibit more volatile structure compared to S&P 500 and NASDAQ. The findings are supported by standard deviation (1.6%), kurtosis (19.24) and highly significant value of Jarque-Bera normality statistic. In the case of exchange rate returns, the U.S. dollar exhibits the most stable behaviour against Swiss Franc during the sample period 2019–2021. The findings are evident from the comparison of statistics mentioned earlier. Oil is an expensive mineral compared to gas or coal in terms of high volatility and the highest daily gains and losses. The platinum futures exhibit highest losses and gains in daily returns accompanied with frequent shocks of abnormal returns whereas gold is found as least volatile metal.
Table 1. Descriptive statistics of returns.
Next, the results of structural break test are presented in . The analysis implies that stock markets exhibit the earliest reaction to the impact of COVID-19. This is evident from the optimal structural break point which is observed around February 2020 for all three indices. Next, the exchange rates seems to be affected. This can be explained by the structural break point of daily returns for U.S. dollar against various currencies found in mid-March 2020. The daily returns in oil futures exhibits structural change due to COVID-19 around May 2020. However, the coal and gas exhibits structural break in September 2020 and January 2021, respectively. The distinct pattern of structural breaks in oil, gas and coal verify the low financial integration among minerals returns. The movement of oil seems to observe stock and exchange market patterns, but coal and gas futures does not exhibit any such relationship. Finally, COVID-19 does impact the metals futures like gold, silver and platinum. The results are evident by the structural breakpoint point observed in March 2020 for all three metals.
Table 2. Unit root test with structural break.
The analysis implies that in case of stock market, Markov switching model with different volatility structure seems appropriate for S&P 500 and Dow Jones, whereas the model with same mean and volatility structure provided lowest B.I.C. value for NASDAQ. In exchange rate returns, the Markov switching model capturing different volatility structure of U.S. dollar against Japanese yen, Canadian dollar and British pound in two periods seems appropriate whereas the model with unchanged mean and volatility for U.S. dollar against the euro and Swiss franc seems adequate. For oil, coal and gas future returns, the model with different volatility structure in low and high stress periods yield lowest B.I.C. value. The same behaviour is observed in metal future returns. The analysis concluded that in the majority of cases, COVID-19 impacts the volatility structure of returns in various financial markets. However, in few cases the mean returns and volatility remains unchanged in two different periods.
3.2. Global markets reaction to COVID-19
3.2.1. Stock market reaction to the pandemic
The global financial risk rose significantly in response to the apparition and instalment of the pandemic period (Zhang et al., Citation2020). For this ongoing research, we included in the group of stock exchange indicators selected for analysis the following indicators: S&P 500, NASDAQ, Dow Jones. COVID-19 impacted the financial markets significantly and returns became more unsteady (Ambros et al., Citation2021). In a detailed study of the impact of COVID-19 on financial market volatility (Albulescu, Citation2021), the author stated that the S&P’s 500 indicator's volatility rises during the pandemic, and currently, the pandemic represents the main source of financial instability. Many authors investigated that before the pandemic, the macro-global impact, as well as other risk factors on companies stokes (Bakanauskienė et al., Citation2020; Laopodis, Citation2022), as well as after the pandemic outbreak (Aygoren & Balkan, Citation2020).
Studies (Shehzad et al., Citation2020) show a COVID-19 negative impact on the S&P 500 stock profitability and a less significant impact on the Nasdaq indicator. By analysing the impact of the pandemic on the financial markets, some authors (Zhang et al., Citation2020) consider negatively the pandemic impact regarding the financial markets evolution's dynamic worldwide, which brought significant financial losses.
In our study, the results of Markov switching model for S&P 500, NASDAQ and Dow Jones during sample period of January 2019–February 2021 are presented in . For each of the financial return, initially dynamic regression models with (and without) autoregressive term is considered and in cases where model fit is not improved, the term is dropped. The analysis for S&P 500 identifies two different periods characterised by low and high volatility. We attribute the presence of high stress period during this period to COVID-19. The results implies that in pre-COVID-19 (state of low stress), the average volatility in S&P 500 future returns is observed to be 0.15%. During COVID-19, our analysis implies that volatility in S&P 500 is increased to 0.41%. Further, the results reveals that impact of NASDAQ returns on S&P 500 reduced to 24% whereas the impact of Dow Jones increased to 72.6% respectively. The expected duration of being in low stress period is around six times more compared to period of high stress. This provides an optimistic approach that once the stress period is over, S&P 500 returns to its normal state and start functioning regularly. The impact of S&P 500 and Dow Jones on NASDAQ returns decreased (with low standard errors) during period of high stress (COVID-19) .This explains that co-movement of NASDAQ returns is reduced during COVID-19 and the index seems to perform independently. The result makes sense, since the index is dominated by Tech companies which are actually driving global economy during COVID-19. The impact of S&P 500 returns on Dow Jones returns is positive and five times higher compared to NASDAQ returns in both states. The impact is increased by 30% during a high stress period (COVID-19). The structural relationship of the Dow Jones with S&P 500 and NASDAQ is stable in both periods characterised by the transition probability of staying in low and high stress periods equals 93% and 87%, respectively. The Dow Jones returns observed more frequent jumps compared to S&P 500 in a high stress period. Thus we conclude that financial integration of S&P 500 and Dow Jones is increased during COVID-19, whereas NASDAQ improved its functionality independently.
Table 3. Markov switching model for stock indices.
3.2.2. Foreign exchange market reaction to the pandemic
The crisis we face is different to any other crisis we have confronted throughout history (1997–1998, 2007–2008, 2014, 2015) when significant exchange rate fluctuations occurred. This crisis particularity is that it is caused by an external shock (Auzan, Citation2020) with global effects. There are authors for whom the Swiss franc represents a secure refuge currency for reserves (Habib & Stracca, Citation2012; Lee, Citation2017).
Regarding our study, in case of U.S.D./EURO returns, the conditional mean and volatility remains invariant in both periods characterised by the Markov switching model during 2019–2021. The analysis implies that during low stress periods, U.S.D./C.H.F. is most significant currency pair in explaining the variation of U.S.D./EURO returns. The first justification is the presence of dominant U.S. dollar for both currencies. Second, stable government and financial system of Swiss government make U.S.D./C.H.F. ‘safe-haven’ or financial refuge for other currency pairs.
Finally, the physical proximity and strong economic ties between Switzerland and eurozone enables this relationship highly significant. Similarly, highly significant coefficient of U.S.D./G.B.P. returns (in low stress periods) with lowest standard error explains the long-term consistent trading relationship of European Union with United Kingdom. The probability of staying in a high stress period equals 98%. In other words, the probability of going back to a normal (or low stress) period is 2%. This concludes that COVID-19 has a long-term impact on U.S.D./EURO daily returns, however the invariant mean and volatility in both periods and expected short duration of high stress periods gives an optimistic view that U.S.D./EURO returns can resist the external shock and made effective adjustments to keep returns stable and consistent. Japan is known to be top-creditor nation and this makes U.S.D./YEN currency pair highly sensitive to geopolitical risks in international investments. However, the yen is still considered the ‘safe-haven’ currency because of zero interest rates, high return government securities and positive net foreign asset positions. During the COVID-19 crisis period, when the interest rates in Europe and U.S.A. fell, Japanese Government bonds offered high inflation adjusted returns. Before the pandemic outbreak, in 2019, the yen suffered a depreciation of 105.12 yen on U.S. dollar to 109.78 yen on a dollar. The observed average exchange rate was 108 yen on one U.S. dollar. Through comparison, during the COVID-19 averaging, the exchange rate was 107.22, indicating that the yen currency was valued during the COVID-19 compared to pre-COVID-19 periods. At same time, the yen’s valorisation during the pandemic was stronger, from 112.15 yen per U.S. dollar to 102,06 (Narayan, Citation2020).
Our analysis implies that in low stress periods, U.S.D./C.H.F. and U.S.D./EURO explains the movement of U.S.D./Y.E.N. whereas the impact of U.S.D./C.A.D. and U.S.D./G.B.P. is insignificant. The result is justified based on the world’s largest bilateral free trade agreement ‘European Union–Japan Economic Partnership’ made on 1 July 2018. The low stress period seems persistent since the likelihood of staying in same state equals 91%, however the expected duration last only 11 days. Interestingly, in period of high stress (COVID-19) the impact of U.S.D./EURO on U.S.D./YEN disappeared whereas the impact of U.S.D./C.H.F. almost doubled. The result justifies the search of ‘safe-haven’ currency pair during crisis period. Another important finding is the significant variation of U.S.D./YEN explained by the U.S.D./G.B.P. currency pair during high stress periods. The result can be justified on the high correlation of both currency pairs with gold. We can conclude that the upsurge in gold prices due to the low interest rates during COVID-19 establishes this relationship.
Research carried out before the pandemic showed that the element with a critical role in the short-term dynamics of the exchange rate Canadian dollar–U.S. dollar is the petroleum price (Kurita & James, Citation2020). In the short-term, through coordination of interest rate or other fundamental elements of each economy, there is a possibility to tend for positive coordination of the economic policy between the two countries (the U.S.A. and Canada). An analysis published last year (2020) presented the monthly exchange rates in the U.S.A. and the Canadian dollar in the period 1 January 1986–1 September 2019. The highlighted model demonstrated that by using the Canadian interest rate values once in three months, the inflation rate in the U.S.A., the petroleum price and the net exports of U.S.A., the monthly exchange rate of the U.S. dollar and Canadian dollar might be estimated the exchange rate of both American and Canadian dollar (Iehl, Citation2020).
The highly significant impact of four exchange rate pairs on U.S.D./C.A.D. in both stress periods justifies Canadian high currency ranking. Interestingly, EURO and YEN exhibits inverse impact whereas G.B.P. and C.H.F. explains positive impact in low volatility periods. The inverse impact of the euro and yen on the Canadian dollar can be justified by carry trade activities. Further, any carry trade activity of EURO leads to appreciation of Swiss Franc. This can be verified by positive impact of U.S.D./C.H.F. on U.S.D./C.A.D. Finally, the highly positive significant impact of U.S.D./G.B.P. on U.S.D./C.A.D. is justified by the fact that the United Kingdom is one of the largest gold export market for Canada in Europe. In the period of low stress, the highest significant positive impact on G.B.P. comes from the European Union, next from Japan followed by Canada. However, the impact of Swiss Franc remains insignificant in both periods. Our analysis implies that due to Swiss National Bank FX interventions, the country maintains invariant mean and volatility structure in both identified periods. The currency pair that explains the movement of U.S.D./C.H.F. is U.S.D./EURO justified by the highest significant coefficient in low stress periods. However, a small but significant impact of U.S.D./J.P.Y. on U.S.D./C.H.F. is also observed. The impact of the Canadian dollar and British pound remains insignificant in both periods ( and ).
Table 4. Markov switching model for exchange rates.
Table 5. Markov switching model for minerals.
3.2.3. Minerals market reaction to the pandemic
The petroleum price strongly influences many sectors. Still, the pandemic moderated the exposition of a certain domain to the direct influence the petroleum price had before the pandemic outbreak (Borgards et al., Citation2021). During the current pandemic, petroleum recorded the lowest price of all times (Štulec, Citation2020). Almost all sectors are negatively affected by the COVID-19 pandemic, including the natural gas market (Abadie, Citation2021). The petroleum and natural gas markets recorded risk levels during the pandemic (Nyga-Łukaszewska & Aruga, Citation2020). Coal ensures one-third of the global supply of primary energy, respectively 40% from the global emissions of carbon dioxide (International Energy Agency, Citation2020). Many countries worldwide wish to extend on a larger scale the use of coal, while others intend to eliminate coal use in the following 30 years (Audoly et al., Citation2018; Jewell et al., Citation2019). For the moment, it is observed that the coal price has remained stable, but an impact of the pandemic with regard to coal is that a market price drop at a global level is expected, in the short- and long-term (Azarova & Mier, Citation2021).
Our analysis explains that during periods of low-stress, the impact of natural gas returns is three times more compared to coal on oil returns. The relationship is stable characterised by the likelihood of staying in the low volatility state equals 99% with an expected duration of three months. However, in high-stress periods (COVID-19), the impact of coal returns on oil returns remains significant at 10% level of significance, whereas the impact of gas returns on oil returns disappeared. The result is justified based on the fact that although COVID-19 hit the global gas demand, the actual consumption areas of natural gas are electricity generation and industry instead of transport, so the fall is less severe compared to oil and coal. This leads to rebounding the decline price of first two quarters with an average increase of 18% in natural gas prices in third quarter of 2020. Thus, the movement of gas returns does not influence the oil returns and hence the impact disappeared in high volatility periods. Interestingly, our analysis implies that coal returns influence more from its own historical movements compared to minerals like gas and oil. We further observe that the impact of natural gas on coal returns is invariant and insignificant in both periods. Our analysis identified two latent periods for natural gas returns during 2019–2021 characterised by a different volatility structure. The result explains that in low volatility periods both oil and coal returns impact the natural gas returns. During COVID-19, analysis implies that impact of oil returns become insignificant whereas the coal returns shows negative significant impact. The result justifies the consequence of coal to gas switch strategy adopted by various countries.
3.2.4. Metals market reaction to the pandemic
According to recent studies, gold constitutes a good diversification and refuge for investments, especially for fluctuant or unstable periods (Triki & Maatoug, Citation2021), having special benefits as an investment option (Garg, Citation2021). Gold is recognised as a precious metal for investment and risk-aversion reasons. In fact, the gold is a secure active on financial markets (Baur & Lucey, Citation2010), energy markets (Reboredo, Citation2013) and during the inflation growth (Aye et al., Citation2017) and it is used by many central banks as active in their reserves. The investment in precious metals, of which silver is not an exception, is indicated and recommended by the specialists. If some types of investment portfolios are not encouraged, others constitute diversification opportunities, including silver investment (Lahmiri & Bekiros, Citation2020). Similar to the already mentioned gold and silver, platinum may be used as a rebalancing instrument of the investors' portfolio to minimise or cancel risks (Salisu et al., Citation2021). The precious metals, including platinum, offers a better coverage efficiency than the individual portfolios of their own capital, including during the pandemic (Mensi et al., Citation2021).
Our analysis reveals that during 2019–2021, the gold future returns characterised by two latent periods having different volatility structure. Interestingly, in low volatility periods the silver returns seems to have highly significant impact whereas the impact of platinum returns is insignificant. One justification could be the slower Euro area GDP growth rate which is observed 1.2% in 2019 compared to 1.9% of 2018 which consequently lowered the platinum demand. The probability of gold returns to stay in low stress periods equals 80% which explains the persistence of current state. However, in a high volatility period (COVID-19) the impact of silver returns increased three times, compared to a low volatility periods and the impact of platinum returns becomes highly significant too. This clearly explains the financial integration of gold return with other precious metals during crisis period. The analysis explain that during 2019–2021, two latent states of platinum returns are characterised by different volatility structures. Interestingly, the movement of daily platinum returns remains unaffected by other metal returns in both periods, except silver in low volatility periods. The result is reasonable since both silver and platinum are widely used in industrial applications and consequently co-move during normal periods. During low volatility periods, the results indicates that positive impact of gold future returns on silver returns is five times more compare to platinum returns. The result is justified from the ‘gold-silver ratio’ which always exhibit perfect correlation between the two commodities. During this pandemic, market risks may be covered by the gold evolution on the market, which can be an option for investment and diversification (Adekoya et al., Citation2021).
From we observe that the relationship among three metals seems persistent justified by the low standard errors and the probability of staying in a low volatility period equals 93%. During high volatility periods (COVID-19), the impact of gold and platinum returns on silver returns is increased. The result explains the financial integration of commodities during a crisis period and like gold, silver has been used as a ‘safe-haven’ asset too during crisis period.
Table 6. Markov switching model for metals.
3.3. Model adequacy
Once an econometric model is estimated, next we proceed to examine appropriateness of suggested models for forecasting. We check the model fit against two criteria. The first is a scatter plot of residuals and the other is Bartlett Periodogram white noise test (Bartlett, Citation1955, Citation1967). Scatter plots of residuals are becoming increasingly popular due to their simplicity in examining the potential problems such as heteroskedasticity, autocorrelation and curvilinear trend of data points. The requirement is that residuals extracted from the model are independent and identically distributed or in other words follows a ‘white noise’ process. The results obtained from scatterplot are presented in . The residuals extracted from Markov switching models applied to three different stock returns indicates a random horizontal pattern which explains that errors are independent and identically distributed. However, the closeness of data points hints to the problem of heteroskedasticity. In case of exchange rate market returns, residuals extracted from the models applied to EURO, Swiss franc and Canadian dollar against U.S. dollar exhibits scattered pattern and hence indicates the appropriateness of model. Although in case of the British pound and Japanese yen against the U.S. dollar, the data point seems clustered but a horizontal pattern indicates absence of all time series components, except noise. Thus, justification of independent and identically distributed residuals can be made. The residuals extracted from models applied to mineral market returns explains the presence of outliers in oil and coal returns. Further, closeness of data points hints the problem of heteroskedasticity. This is justified on the previous discussion of volatility and heavy-tailed distribution for oil and coal returns However, the gas returns residuals exhibits a scattered pattern of data points.
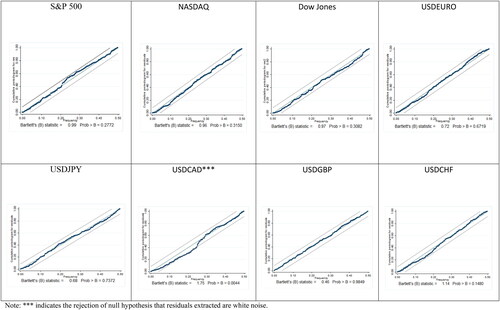
Although scatter plots of residuals are a first choice for any model diagnostics, they cannot lead to any concrete decision about the model adequacy. For this reason, we consider another well-known test which is based on spectral analysis. Spectral density is the Fourier transformation of autocorrelation series for any given stochastic process. It is estimated using a periodogram which plots the frequencies on horizontal axis and the intensity of signals on y-axis. In case of any periodicities, the signal shows peaks at certain frequencies. The Bartlett Periodogram white noise test assumes that signal is a white noise and so it has a flat spectrum. The periodogram is based on a sequence of independent and identically distributed exponential random variable asymptotically, so the cumulative periodogram is a straight line at 45 degree angle. The Bartlett’s test statistic is based on the maximum deviation between the straight line and the normalised cumulative periodogram of residuals. The null hypothesis assume that residuals follows a white noise process and corresponding p-value is calculated. The results of Bartlett’s test are presented in . The test provides an optimistic result, since 10 out of 14 financial assets across different markets prove that the residuals extracted from suggested models is just white noise and hence models are appropriate for forecasting. However, the p-value of Bartlett’s test statistic is obtained less than 1% significance level for residuals extracted from the models applied to U.S.D./C.A.D., oil, silver and platinum returns. The volatile behaviour of oil returns and residuals could be one justification. Similarly the presence of outliers in metal return residuals explains the violation of white noise property. Overall, the analysis suggests that Markov switching econometric approach works well in identifying different market conditions during periods of turmoil.
Figure 1. Bartlett Periodogram white noise test results for selected series.
Source: authors’ calculation.
4. Conclusions and limitations
The aim of the article was to elucidate the impact of abrupt changes in the structural stability of various assets due to crises like COVID-19. In order to do so, we employed the Markov switching model to reveal the differences in the co-movement impact of various financial indices in each of the markets during two periods. The research assumes that financial returns data in various markets between 2019 and 2021 is governed by the mixture of two distributions. One which explains low stress periods behaviour of the financial markets presumably in 2019 and the other representing high stress period covering COVID-19 from 2020 onwards. The stated hypothesis proved in majority of the cases when unit root test of structural break was applied. The finding of this study includes long-run impact of COVID-19 in selected stock returns. The reaction of S&P 500 and Dow Jones to COVID-19 is similar but the behaviour of NASDAQ returns is different. COVID-19 increased the volatility of S&P 500 and Dow Jones returns but the volatility of NASDAQ returns remains unchanged. Financial integration of S&P 500 and Dow Jones is increased whereas NASDAQ returns is decreased during crisis period. Except EURO and Swiss franc against U.S. dollar, all other selected currencies exhibit change in volatility due to COVID-19. The impact of U.S.D./C.H.F. a ‘safe-haven’ currency pair is increased on other currency pairs during COVID-19. Financial integration of U.S.D./EURO with other currency pairs is reduced during COVID-19 whereas U.S.D./YEN observe financial contagion behaviour. The highest impact of COVID-19 in minerals market is observed in oil returns where the volatility increased five times compared to normal market condition. Insignificant financial integration is observed among selected minerals returns, except oil. The long-run impact of COVID-19 is observed in minerals market. The financial integration of ‘safe-haven’ assets like gold or silver with other metal returns is increased during crisis period. Silver returns exhibits the highest change in volatility during sample period. However, on positive note, results also indicates that pandemic does make a way for few financial assets to enter into the market, especially the ones recognised as ‘safe-haven’ assets.
This research provides investors and policymakers a reasonable guideline regarding trading patterns in various financial markets during turmoil period like COVID-19. Few implications to the research are among four considered markets, the earliest response to COVID-19 is observed in stock returns. Second, we can observe that foreign exchange rate market provided an early warning signals too about COVID-19 crisis. Third, the long-run impact of COVID-19 is observed in foreign exchange rate market too. Fourth, financial contagion is observed in all mineral returns due to the change in volatility structure during COVID-19 crisis period. Fifth, the long-run impact of COVID-19 characterised by high volatility on precious metal returns is observed.
The potential limitations of our work are that impact of COVID-19 on cross-market co-movements is not studied. The justification is that four different financial markets with 14 financial indices for two different periods is studied. Hence, in total 28 different models are obtained. The breadth of analysis does not allow us to extend further. Second, the dependence structure of returns up to lag one is studied. The complete dependence history of returns is ignored. This results in a lack of justification about efficient market hypothesis for individual returns. Although the applied Bartlett Periodogram white noise test provides hint to the results, still a concrete conclusion cannot be made. The Markov switching model identifies two latent states where the model changes its behaviour. We studied this closely and recognise that in majority of cases the period of high stress corresponds to COVID-19, but it is possible that in a few cases the exogenous shocks might change the model structure and stability. Finally, in period of high stress, majority returns exhibit high standard error which may reduce the inferential power beyond the studied sample.
Disclosure statement
No potential conflict of interest was reported by the authors.
Notes
References
- Abadie, L. M. (2021). Energy market prices in times of COVID-19: The case of electricity and natural gas in Spain. Energies, 14(6), 1632. https://doi.org/10.3390/en14061632
- Adekoya, O. B., Oliyide, J. A., & Oduyemi, G. O. (2021). How COVID-19 upturns the hedging potentials of gold against oil and stock markets risks: Nonlinear evidences through threshold regression and Markov-regime switching models. Resources Policy, 70, 101926. https://doi.org/10.1016/j.resourpol.2020.101926
- Albulescu, C. T. (2021). COVID-19 and the United States financial markets’ volatility. Finance Research Letters, 38, 101699. https://doi.org/10.1016/j.frl.2020.101699
- Ambros, M., Frenkel, M., Huynh, T. L. D., & Kilinc, M. (2021). COVID-19 pandemic news and stock market reaction during the onset of the crisis: Evidence from high-frequency data. Applied Economics Letters, 28(19), 1686–1684. https://doi.org/10.1080/13504851.2020.1851643
- Audoly, R., Vogt-Schilb, A., Guivarch, C., & Pfeiffer, A. (2018). Pathways toward zero-carbon electricity required for climate stabilization. Applied Energy, 225, 884–901. https://doi.org/10.1016/j.apenergy.2018.05.026
- Auzan, A. A. (2020). The economy under the pandemic and afterwards. Population and Economics, 4(2), 4–12. https://doi.org/10.3897/popecon.4.e53403
- Aye, G. C., Carcel, H., Gil-Alana, L., & Gupta, R. (2017). Does gold act as a hedge against inflation in the UK? Evidence from a fractional cointegration approach over 1257 to 2016. Resources Policy, 54, 53–57. https://doi.org/10.1016/j.resourpol.2017.09.001
- Aygoren, H., & Balkan, E. (2020). The role of efficiency in capital asset pricing: A research on Nasdaq technology sector. Managerial Finance, 46(11), 1479–1493. https://doi.org/10.1108/MF-12-2019-0612
- Azarova, V., & Mier, M. (2021). Market Stability Reserve under exogenous shock: The case of COVID-19 pandemic. Applied Energy, 283, 116351. https://doi.org/10.1016/j.apenergy.2020.116351
- Azimili, A. (2020). The impact of COVID‐19 on the degree of dependence and structure of risk‐return relationship: A quintile regression approach. Finance Research Letters, 36, 101648. https://doi.org/10.1016/j.frl.2020.101648
- Bakanauskienė, I., Bendaravičienė, R., Juodelytė, N., & Vveinhardt, J. (2020). Sustainability of Nasdaq-listed companies: The effects of participation in the UNGC. Polish Journal of Management Studies, 21(1), 87–103. https://doi.org/10.17512/pjms.2020.21.1.07
- Baranova, V., Sergienko, O., Stepurina, S., & Lyashenko, V. (2020). Price environment for gold and silver in the context of the development of COVID-19. Journal of Asian Multicultural Research for Economy and Management Study, 1(2), 25–32.
- Bartlett, M. S. (1955). An introduction to stochastic processes with special reference to methods and applications. Cambridge University Press. https://doi.org/10.2307/2342717
- Bartlett, M. S. (1967). Some remarks on the analysis of time-series. Biometrika, 54(1-2), 25–38. https://doi.org/10.1093/biomet/54.1-2.25
- Baur, D. G., & Lucey, B. M. (2010). Is gold a hedge or a safe haven? An analysis of stocks, bonds and gold. Financial Review, 45(2), 217–229. https://doi.org/10.1111/j.1540-6288.2010.00244.x
- Bora, D., & Basistha, D. (2021). The outbreak of COVID‐19 pandemic and its impact on stock market volatility: Evidence from a worst‐affected economy. Journal of Public Affairs, 21(4). https://doi.org/10.1002/pa.2623
- Borgards, O., Czudaj, R. L., & Van Hoang, T. H. (2021). Price overreactions in the commodity futures market: An intraday analysis of the Covid-19 pandemic impact. Resources Policy, 71, 101966. https://doi.org/10.1016/j.resourpol.2020.101966
- Bouri, E., Shahzad, S. J. H., Roubaud, D., Kristoufek, L., & Lucey, B. (2020). Bitcoin, gold, and commodities as safe havens for stocks: New insight through wavelet analysis. The Quarterly Review of Economics and Finance, 77, 156–164. https://doi.org/10.1016/j.qref.2020.03.004
- Büchel, K., Legge, S., Pochon, V., & Wegmüller, P. (2020). Swiss trade during the COVID-19 pandemic: An early appraisal. Swiss Journal of Economics and Statistics, 156(1), 22. https://doi.org/10.1186/s41937-020-00069-3
- Calvimontes, J., Massaro, L., Araujo, C. H. X., Moraes, R. R., Mello, J., Ferreira, L. C., & De Theije, M. (2020). Small-scale gold mining and the COVID-19 pandemic: Conflict and cooperation in the Brazilian Amazon. The Extractive Industries and Society, 7(4), 1347–1350. https://doi.org/10.1016/j.exis.2020.08.013
- Elsayed, A., & Abdelrhim, M. (2020, May 23). The effect of COVID-19 spread on Egyptian stock market sectors. Available at SSRN: https://ssrn.com/abstract=3608734 or https://doi.org/10.2139/ssrn.3608734
- Eviews. (2017). User guide II. Version 10.0 (pp. 601–616). QMS Quantitative Micro Software.
- Ezeaku, H. C., Asongu, S. A., & Nnanna, J. (2021). Volatility of international commodity prices in times of COVID-19: Effects of oil supply and global demand shocks. The Extractive Industries and Society, 8(1), 257–270. https://doi.org/10.1016/j.exis.2020.12.013
- Fetiniuc, V., Luchian, I., & Ţvircun, A. (2020). The financial anatomy of current pandemic crisis. Journal of Financial and Monetary Economics, România, Bucureşti, (8), 104–110.
- Garg, S. (2021). A study of factors influencing investor behaviour towards gold as an investment avenue with factor analysis. Materials Today: Proceedings, 37, 2587–2590. https://doi.org/10.1016/j.matpr.2020.08.503
- Gharib, C., Mefteh-Wali, S., & Jabeur, S. B. (2021). The bubble contagion effect of COVID-19 outbreak: Evidence from crude oil and gold markets. Finance Research Letters, 38, 101703. https://doi.org/10.1016/j.frl.2020.101703
- Habib, M. M., & Stracca, L. (2012). Getting beyond carry trade: What makes a safe haven currency? Journal of International Economics, 87(1), 50–64. https://doi.org/10.1016/j.jinteco.2011.12.005
- Hamilton, J. D. (1989). A new approach to the economic analysis of nonstationary time series and the business cycle. Econometrica, 57(2), 357–384. https://doi.org/10.2307/1912559
- Hassan, S., & Gavilanes, J. M. R. (2021). First to react is the last to forgive: Evidence from the stock market impact of COVID 19. Journal of Risk and Financial Management, 14(1), 26. https://doi.org/10.3390/jrfm14010026
- He, P., Sun, Y., Zhang, Y., & Li, T. (2020). COVID–19’s impact on stock prices across different sectors – An event study based on the Chinese stock market. Emerging Markets Finance and Trade, 56(10), 2198–2212. https://doi.org/10.1080/1540496X.2020.1785865
- Hofmann, B., Shim, I., & Shin, H. S. (2021). Emerging market economy exchange rates and local currency bond markets amid the Covid-19 pandemic. BIS Bulletin, no 5, April. https://doi.org/10.2139/ssrn.3761875
- Hossfeld, O., & MacDonald, R. (2015). Carry funding and safe haven currencies: A threshold regression approach. Journal of International Money and Finance, 59, 185–202. https://doi.org/10.1016/j.jimonfin.2015.07.005
- Iehl, E. (2020). The US dollar and Canada dollar exchange rate. In Proceedings of the Jepson Undergraduate Conference on International Economics, Vol. 2, 5. https://scholarworks.uni.edu/jucie/vol2/iss1/5
- International Energy Agency. (2020). IEA coal report – The Covid-19 crisis and clean energy progress. Retrieved January 05, 2022, from https://www.iea.org/reports/the-covid-19-crisis-and-clean-energy-progress
- Jewell, J., Vinichenko, V., Nacke, L., & Cherp, A. (2019). Prospects for powering past coal. Nature Climate Change, 9(8), 592–597. https://doi.org/10.1038/s41558-019-0509-6
- Kim, C. S. (2020). A study on the coupling effect & volatility spillover effect between Won-Yen and Won-Dollar exchange rate before and after COVID-19 pandemic. The Korean Academy for Trade Credit Insurance, 221(4), 53–68.
- Kurita, T., & James, P. (2020). A regime-shifting approach to modeling the Canadian-US dollar exchange rate: Four decades of the post-Bretton Woods float. https://doi.org/10.13140/RG.2.2.15008.12801
- Lahmiri, S., & Bekiros, S. (2020). Renyi entropy and mutual information measurement of market expectations and investor fear during the COVID-19 pandemic. Chaos, Solitons, and Fractals, 139, 110084. https://doi.org/10.1016/j.chaos.2020.110084
- Laopodis, N. T. (2022). Global risk factors of NYSE-and NASDAQ-listed shipping companies’ stock returns. Maritime Business Review, 7(2), 90–108. https://doi.org/10.1108/MABR-09-2020-0059
- Lee, K.-S. (2017). Safe-haven currency: An empirical identification. Review of International Economics, 25(4), 924–947. https://doi.org/10.1111/roie.12289
- Maheta, D., & Shah, J. (2021). Impact of Covid-19 pandemic on Dow Jones Index. Asia-Pacific Journal of Management and Technology, 01(03), 18–21. https://ejournal.lincolnrpl.org/index.php/ajmt/article/view/20 https://doi.org/10.46977/apjmt.2021v01i03.003
- Maier, B. F., & Brockmann, D. (2020). Effective containment explains subexponential growth in recent confirmed COVID-19 cases in China. Science, 368(6492), 742–746. https://doi.org/10.1126/science.abb4557
- Mensi, W., Vo, X. V., & Kang, S. H. (2021). Time and frequency connectedness and network across the precious metal and stock markets: Evidence from top precious metal importers and exporters. Resources Policy, 72, 102054. https://doi.org/10.1016/j.resourpol.2021.102054
- Narayan, P. K. (2020). Has COVID-19 changed exchange rate resistance to shocks? Asian Economics Letters, 1(1), 17389. https://doi.org/10.46557/001c.17389
- Narayan, P. K., Devpura, N., & Wang, H. (2020). Japanese currency and stock market – What happened during the COVID-19 pandemic? Economic Analysis and Policy, 68, 191–198. https://doi.org/10.1016/j.eap.2020.09.014
- Nyga-Łukaszewska, H., & Aruga, K. (2020). Energy prices and COVID-immunity: The case of crude oil and natural gas prices in the US and Japan. Energies, 13(23), 6300. [CrossRef]. https://doi.org/10.3390/en13236300
- Parra, P. Y., Hauenstein, C., & Oei, P. Y. (2021). The death valley of coal–modelling COVID-19 recovery scenarios for steam coal markets. Applied Energy, 288, 116564. https://doi.org/10.1016/j.apenergy.2021.116564
- Reboredo, J. C. (2013). Is gold a hedge or safe haven against oil price movements? Resources Policy, 38(2), 130–137. https://doi.org/10.1016/j.resourpol.2013.02.003
- Salisu, A. A., Vo, X. V., & Lawal, A. (2021). Hedging oil price risk with gold during COVID-19 pandemic. Resources Policy, 70, 101897. https://doi.org/10.1016/j.resourpol.2020.101897
- Schoenfeld, J. (2020). The invisible risk: Pandemics and the financial markets. Tuck School of Business Working Paper No. 3567249. Available at SSRN: https://ssrn.com/abstract=3567249 or https://doi.org/10.2139/ssrn.3567249
- Segal, S., & Gerstel, D. (2020). The global economic impacts of COVID-19. http://resp.llas.ac.cn/C666/handle/2XK7JSWQ/250233
- Shaikh, I. (2021). On the relation between pandemic disease outbreak news and crude oil, gold, gold mining, silver and energy markets. Resources Policy, 72, 102025. https://doi.org/10.1016/j.resourpol.2021.102025
- Shehzad, K., Xiaoxing, L., & Kazouz, H. (2020). COVID‐19's disaster are perlous than global financial crisis: A rumor or fact? Finance Research Letters, 36, 101669. https://doi.org/10.1016/j.frl.2020.101669
- Sifat, I., Ghafoor, A., & Mand, A. A. (2021). The COVID-19 pandemic and speculation in energy, precious metals, and agricultural futures. Journal of Behavioral and Experimental Finance, 30, 100498. https://doi.org/10.1016/j.jbef.2021.100498
- Stata, A. (2015). Stata base reference manual release 14 (pp. 427–446). Stata Corporation.
- Štulec, I. (2020). COVID-19 and commodity futures markets. Proceedings of the International Scientific Conference Zagreb, Croatia, 26th and 27th November 2020. Vol. Trade Perspectives 2020 the Interdependence of COVID-19 Pandemic and International Trade, Zagreb. https://www.efzg.unizg.hr/UserDocsImages/TRG/Proceedings%20Trade%20Perspectives%202020.pdf#page=64
- Syahri, A., & Robiyanto, R. (2020). The correlation of gold, exchange rate, and stock market on covid-19 pandemic period. Jurnal Keuangan dan Perbankan, 24(3), 350–362. https://doi.org/10.26905/jkdp.v24i3.4621
- Triki, M. B., & Maatoug, A. B. (2021). The GOLD market as a safe haven against the stock market uncertainty: Evidence from geopolitical risk. Resources Policy, 70, 101872. https://doi.org/10.1016/j.resourpol.2020.101872
- WHO. (2020a). World Health Organization Statement on the Second Meeting of the International Health Regulations (2005)-Emergency Committee Regarding the Outbreak of Novel Coronavirus 2019.
- WHO. (2020b). A guide to WHO’s guidance on COVID-19. https://www.who.int/news-room/feature-stories/detail/a-guide-to-who-s-guidance
- Yang, H. (2021). Investor sentiment and market dynamics: Evidence from index futures markets. Investment Analysts Journal, 50(4), 258–272. https://doi.org/10.1080/10293523.2021.2010376
- Zhang, D., Hu, M., & Ji, Q. (2020). Financial markets under the global pandemic of COVID‐19. Finance Research Letters, 36, 101528. https://doi.org/10.1016/j.frl.2020.101528
- Zhang, W., & Hamori, S. (2021). Crude oil market and stock markets during the COVID-19 pandemic: Evidence from the US, Japan, and Germany. International Review of Financial Analysis, 74, 101702. https://doi.org/10.1016/j.irfa.2021.101702
- Zivot, E., & Andrews, D. W. K. (2002). Further evidence on the great crash, the oil price shock, and the unit root hypothesis. Journal of Business & Economic Statistics, 20(1), 25–270. https://doi.org/10.1198/073500102753410372
Appendix
Figure A1. Scatter plot of model standardised residuals.
Note: *** indicates the rejection of null hypothesis that residuals extracted are white noise.
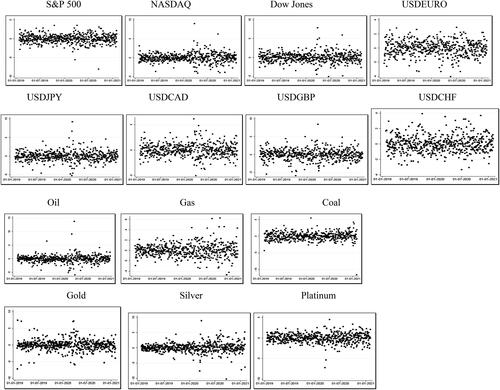
Table A1. Daily returns series name.