
 ?Mathematical formulae have been encoded as MathML and are displayed in this HTML version using MathJax in order to improve their display. Uncheck the box to turn MathJax off. This feature requires Javascript. Click on a formula to zoom.
Abstract
China is implementing a structural tax reduction policy to upgrade the structure of household consumption and promote the development of high-tech industry. This article constructs a heterogeneous NK-DSGE (New Keynesian - Dynamic Stochastic General Equilibrium) model to study the effects of tax reduction policies on consumption upgrading and the development of high-tech industry. The tax categories involved in this model are divided into demand-side tax and supply-side tax. We build two indexes to measure the consumption structure and the development of high-tech industry. It is found that reducing high-tech enterprise income tax would upgrade the consumption structure and promote the development of high-tech industries in the short term. Reducing low-tech enterprise income tax would achieve similar effects in the medium and long term. Moreover, tax such as consumption tax, labour income tax and capital income tax reduction policies can upgrade the consumption structure and promote the development of high-tech industry in the long term. Finally, this article finds that when the elasticity of labour substitution is smaller, reducing high-tech enterprise income tax is more effective.
1. Introduction
In China, with the intrinsic motivation and exogenous policy shocks on the demand side, the consumption of residents has gradually changed from subsistence to quality service. Meanwhile, the upgrading of consumption structure has created a structural ‘gap’ and ‘shortfall’ of high-tech goods, thus promoting the development of high-tech industry. Moreover, the technology spillover effect of high-tech industry can improve the technology of the whole society, thus improving the supply quality to meet the increasing consumer demand of the residents (Sun & Xu, Citation2018). It can be seen that a country’s consumption upgrading and industrial structure upgrading have an interactive endogenous decision mechanism, which are important intermediate targets for inferring economic development. In order to promote China's economic growth, the government officially proposed to cut taxes and fees since 2015, and reduced the tax burden by a total of 2.05 trillion yuan (around 302.6 billion dollars) from 2016 to 2018. According to the 2019 Government Work Report released by China, the tax reform should further reduce the corporate tax and social security contributions by nearly 2 trillion yuan (around 289.9 billion dollars). In 2019, the reduced tax burden accounted for 12.6% of China's total tax revenue.
Deepening institutional reform is an important driving force for the effective co-evolution of supply and demand, and it is the basic reason for the sustained economic growth (Huang, Citation2015). Therefore, it is necessary to conduct an in-depth study on how the structural tax reduction policy promotes the coordinated development and common upgrading of the consumer and industrial structure.
This article studies the incentive effect of structural tax reduction policy on consumption upgrading and high-tech industry. We will seek to provide answers to the following questions. How to give full play to the demand-side tax reduction policy to release the consumption potential of residents and then force the development of China’s high-tech industry? How to stimulate the development of high-tech industry and upgrade the product supply structure through the supply-side tax reduction policy and then promote the advanced consumption structure of residents? Moreover, we will also assess the macroeconomic fluctuations quantitatively.
However, the effects of macro-control policies on the upgrading of consumption structure and the upgrading of industrial structure may not be consistent, so the choice of economic policies on both sides of supply and demand is the core issue of macro-control. In particular, in view of the marginal diminishing effect of China's monetary macro-control policy recently, it is necessary to play the role of fiscal policy, especially to the advantages of tax policy in structural management to solve the ‘mismatch of supply and demand’ in the final consumer goods market. The existing literature either studies the resident wealth effect of the fiscal policy to promote the consumption structure upgrading (Babecký et al., Citation2019), or investigates the innovative incentive effect of fiscal policy to drive the development of high-tech industry as well as guide the upgrading of industrial structure.
In this article, we establish a DSGE model containing household heterogeneous consumption, labour, investment, and technology heterogeneity at the macroeconomic level and study the effects of taxation policy on residents’ consumption structure upgrading and the development of high-tech industry. Moreover, the model subdivides tax into demand-side tax policies for consumption tax, labour income tax and capital income tax, and supply-side tax policies for high-tech enterprise income tax and low-tech enterprise income tax. On the one hand, the influence mechanism and transmission path of structural tax reduction policies on household consumption upgrading and the development of high-tech industry are revealed. On the other hand, theoretical basis and quantitative reference are provided for promoting the coordinated upgrading of consumption structure and industrial structure.
The rest of this article is organized as follows. Section 2 is a literature review. Section 3 describes the theoretical model and explains the parameters calibration used China's actual economic data. Section 4 discusses the effect of tax reduction policies and Section 5 presents conclusion.
2. Literature Review
The implementation of macroeconomic policies will inevitably influence the decision-making and choice at the micro level, which is reflected in the changes in residents’ consumption and optimal decision-making of enterprise production. Scholars have studied the effects of fiscal policy, the upgrading of household consumption structure, and the upgrading of industrial structure from different perspectives. By reviewing the literature, it can be found that: (1) The analysis of the macroeconomic effects of fiscal policies mainly focus on the impact of fiscal expenditure policies and fiscal revenue policies on macroeconomic variables such as total consumption and total output; (2) Research on the upgrading of residents’ consumption structure based on micro-data to examine the impact of residents’ income changes on consumption decision-making; and (3) Research on the development of high-tech industry generally analyzes the path of industrial upgrading from the perspectives of industrial policy and technological innovation capabilities. According to the objectives of this article, we summarize the literature about the impact of fiscal policy on household consumption and the development of high-tech industry.
The existing research on the impact of fiscal policy on residents' consumption mainly focuses on the impact of fiscal expenditure policy and fiscal revenue policy on residents' consumption decision-making. For example, Huang (Citation2005) developed a three-sector real economic cycle model by taking government expenditure as an exogenous random shock, and confirmed government expenditure has crowding-out effect on residents’ consumption. When the government finance according to the proportional interest rate, government expenditure has crowding-out effect on residents’ consumption (Mountford & Uhlig, Citation2009). Meanwhile, fiscal revenue policy also affects private consumption; the government's total taxation has significant stimulus effects on total output and consumption (Gali et al., Citation2007). Capital income tax has crowding-out effects on private consumption. Labour income tax and consumption tax have crowding-out effects on private consumption (Fodio et al., Citation2020; Iwata, Citation2011). Takyi and Gonzalez (Citation2020) applied the model to examine the effects of government spending, consumption tax, and labour income tax shocks on household consumption. They argued that increasing government spending has positive effects on consumption, output, employment and inflation while it turns to crowd-out consumption and to dampen the expansionary effect on output when wages are sticky. Djinkpo, (Citation2019) applied a DSGE model with the fiscal sector to analyse the contribution of government expenditure on aggregate demand, who also analyzed the impact of tax on domestic debt.
At the same time, scholars have also noticed the effect of fiscal policy on the development of high-tech industry and the upgrading of industrial structure. For example, Zhang and Gao (Citation2012) constructed a CGE model of high-tech industry and found that both fiscal and tax incentives can improve the value-added rate of high-tech industry and optimizing the internal structure, and tax incentives have even more effective effects. Cappelen et al. (Citation2012) pointed out that the government will adopt tax policies to make up for the R&D expenditures of enterprises, increase the income of private enterprises, mobilize the enthusiasm of enterprises for innovation. Meanwhile, Cernikova and Hyblerova (Citation2021) agreed that tax support will help increase R&D outputs generated by companies and measured its impact. Su and Fan (Citation2021) provided evidence that there is a significant positive correlation between Chinese income tax preference and R&D investment of high-tech enterprises. Lokshin and Mohnen, (Citation2013) concluded that there is a positive correlation between preferential tax policies and the wage level of scientific innovation personnel. The preferential tax policies make enterprise managers willing to pay higher wages for R&D work, which is conducive to the improvement of innovation and technology.
In fact, researchers have paid attention to the equilibrium relationship and interaction mechanism between the consumption structure and the industrial structure. For example, According to Sun and Xu, (Citation2018), the transformation direction of consumption structure in developing countries mainly depends on the independent innovation effect of the innovation product sector and the difference in technology absorption effects of the basic product sector. Balibago et al. (Citation2013) believed that China produces and exports more and more capital goods and consumer durables, so China’s industrial structure is transforming rapidly. Alcott, (Citation2015) argued that manufacturing growth and structural transformation are the sources of economic development and have a positive impact on the upgrading of residents’ consumption structure. Zhang et al. (Citation2020) found that the increase in Chinese residents' high-tech consumption in the world is the driving force for the upgrading of industrial structure. There is a statistically significant positive correlation between Chinese residents' consumption and industrial structure.
In summary, the existing literature either studies the resident wealth effect of the fiscal policy to promote the consumption structure upgrading, or investigates the innovative incentive effect of fiscal policy to drive high-tech industry development and guide industrial structure upgrading. As for the research methods, the existing research mainly examines the fiscal policy effects of total consumption and total output based on structural macro-econometric models (such as SVAR model, simultaneous equations model and DSGE model). In recent years, the heterogeneous characterization and policy subdivision of agents in DSGE model has become the frontier of improving the DSGE model, such as Zwick and Mahon (Citation2017) and Takyi and Gonzalez, (Citation2020), the purpose of which is to study the influence of different policy tools on the optimal decision-making of residents and enterprises with different characteristics.
This article establishes a DSGE model containing household heterogeneous consumption, labour, investment and technology heterogeneity at the macroeconomic level, and studies the effects of taxation policy on residents’ consumption structure upgrading and high-tech industry development. Moreover, the model subdivides tax into demand-side tax policies for consumption tax, labour income tax and capital income tax, and supply-side tax policies for income tax of differentiated enterprises including high-tech enterprises and low-tech enterprises.
3. Source of Data and Methodology
3.1. Model
In this section, we derive and present the DSGE model that we will estimate in Section 3.2. In order to study effect of tax policy on the residents' consumption structure upgrading and the development of high-tech industry, we distinguish the family heterogeneity consumption, labour and investment, and NK-DSGE modelFootnote1 containing heterogeneous technology and output was constructed based on typical features of the Chinese economy. In general, our model economy consists of a representative household, a final goods producing firm, a continuum of goods producing firms, and a monetary as well as a fiscal authority. Households maximize a utility function with goods (or products) and leisure (or labour) over an infinite life horizon. The consumption of representative households consists of high-tech products and low-tech products. Firms produce differentiated goods, decide on labour and capital inputs, and set prices according to the Calvo (Citation1983) model. The manufacturer department sets up high-tech manufacturers and low-tech manufacturers. High-tech products are produced by high-tech manufacturers, and low-tech products are produced by low-tech manufacturers. At the same time, representative households provide different types of labour to the two types of manufacturers. This article describes the consumption structure and industrial structure by setting the heterogeneity of residents’ consumption, labour and manufacturer sectors. We introduce distortionary taxes including consumption tax, labour income tax, capital income tax, and income tax for high-tech enterprises and low-tech enterprises. Also, we introduce a fiscal authority (government) who collects those taxes from the households and issues debt to finance its expenditures.
We expect to clarify the economic mechanism of structural tax reduction policy promoting the upgrading of consumption structure and the development of high-tech industry, and provide reference for the coordination and collocation of tax policies in China. First of all, household consumptions that are heterogeneous into high, low-tech product consumption provide the basis for describing the characterization of household consumption structure. We differentiate heterogeneous manufacturers from production technology and income tax rate level to depict the output level of China's high-tech industry and low-technology industry. Second, the tax policy of fiscal revenue can distinguish the effects of policy from the perspectives of the demand side (consumption tax, labour income tax and capital income tax) and the supply side (differentiated corporate income tax between high-tech enterprises and low-tech enterprises).
3.1.1. Households
Assuming that the economic system contains countless homogeneous families that can survive infinite periods, the utility of representative families in period t (U) depends on their consumption Ct and labour supply Nt.
(1)
(1)
The parameters
are the risk aversion coefficient of consumption and the reciprocal of Frisch Elasticity of Labour, respectively. We assume that total of household consumption is summed up by the consumption of high-tech products and low-technology products in the form of CES
(2)
(2)
The composite labour supply is composed of
and
(3)
(3)
where
and
represent the labour provided by households for high-tech and low-tech production sectors, respectively.
represents the elasticity of labour substitution between two production sectors and reflects the heterogeneity of labour demand of different technology enterprises.
The household’s budget constraint is
(4)
(4)
where
and
represent the actual investment of the families in the high-tech enterprise and the low-tech enterprise in period t, respectively;
and
represent the capital stock of the high-tech and low-technology enterprises in period t, respectively;
and
represent the nominal capital prices of the high-tech and low-technology enterprises, respectively;
represents government bond purchased by households;
is the rate of return on government bond.
and
represent the nominal wages of the high-tech and low-tech enterprises, respectively;
is the general price level;
and
represent consumption tax, labour income tax, capital income tax in period t, respectively.
The law of motion of capitalFootnote2 of the two production sectors are given by:
(5)
(5)
(6)
(6)
where
and
are the capital depreciation rates of high-tech production sector and low-technology production sector. This article assumes
The goal of the household is to maximize utility EquationEquation (1)
(1)
(1) subject to the budget constraint EquationEquation (4)
(4)
(4) , the summation rule of
and
EquationEquations (2
(2)
(2) , Equation3)
(3)
(3) and the law of motion of capital EquationEquations (5
(5)
(5) , Equation6)
(6)
(6) .
The household's total consumption expenditure
(7)
(7)
and
represent the prices of high-tech products and low-tech products determined by the optimal production decision of the manufacturer department. Therefore, on the premise of a given household optimal total consumption path, the total price level can be obtained by solving the problem of total consumption expenditure minimization
(8)
(8)
where
is the proportion of the consumption of high-tech products in the total consumption that reflects the preference degree of families for high-tech products.
is the elasticity of substitution between high-tech products and low-tech products.
3.1.2. Firms
In order to study the impact of heterogeneous tax policies on the upgrading of household consumption structure and the development of high-tech industry, this article uses Wang and Xu (Citation2018) for reference to set up final good producers (retail) and intermediate goods producers (wholesale), respectively, with the characteristics of dual economy.
3.1.2.1. Final good producers
We suppose that the high-tech final good producer (low-tech final good producer) buys high-tech intermediate product (low-tech intermediate product
) at the price
(
) to produce homogeneous high-tech final product (low-tech final product). Then, in two perfectly competitive final product markets, households buy high-tech and low-tech products at prices
and
to meet demand. And the production function of high-tech final good producer and low-tech final good producer are given by:
(9)
(9)
(10)
(10)
and
are the elasticity of substitution between high-technology intermediates and the elasticity of substitution between low technology intermediates, respectively.
High-tech final good producers maximize their profits under the constraint of production technology EquationEquation (9)(9)
(9) . Low-tech final good producers maximize their profits under the constraint of production technology EquationEquation (10)
(10)
(10)
(11)
(11)
(12)
(12)
According to the first-order condition, the demand function and the price function of the high-tech and low-tech final product can be obtained, respectively,
(13)
(13)
(14)
(14)
(15)
(15)
(16)
(16)
3.1.2.2. Intermediate goods producers
In order to consider the heterogeneity and monopoly of production technology between high-tech intermediate products and low-technology intermediate products, the production function of high-tech and low-tech intermediate goods producers are set as Cobb-Douglas type function
(17)
(17)
(18)
(18)
and
are the capital elasticity of output of high-tech enterprises and low-tech enterprises.
The total production cost of high-tech intermediate goods producers is the payment to labour and capital:
(19)
(19)
Producers minimize production costs under the constraint of production technology EquationEquation (17)(17)
(17) . Wage rate and marginal rate of return on capital are obtained from the first-order conditions of firm optimal decision
(20)
(20)
(21)
(21)
From EquationEquations (20)(20)
(20) and Equation(21)
(21)
(21) , we arrive at:
(22)
(22)
We can get the following equation by combining EquationEquations (17)(17)
(17) and Equation(22)
(22)
(22)
(23)
(23)
(24)
(24)
In addition, for the high-tech intermediate goods producers with pricing power, the price of its product in period t is determined according to the maximization of its profit. The profit maximization is solved under the conditions of EquationEquations (13) (20)(20)
(20) and Equation(21)
(21)
(21)
(25)
(25)
is high-tech enterprise income tax. Thus, the first order condition can be obtained
(26)
(26)
And, it can be obtained by substituting EquationEquation (26)(26)
(26) into EquationEquations (20)
(20)
(20) and Equation(21)
(21)
(21)
(27)
(27)
(28)
(28)
According to Calvo (Citation1983) pricing rule, it is assumed that high-tech intermediate goods producers with a ratio of 1- can choose the price of their good in each period. The remaining producers of high-tech intermediate goods (ratio of
) maintain the price level of the previous period.
Therefore, the high-tech intermediate goods producer j that has the pricing power in period t and do not adjust the price in the future are based on the expectation of maximizing the discount of their future profits
(29)
(29)
is the price of high-tech intermediate products, and it is determined by the first-order condition
(30)
(30)
Under the above setting, the price level of high-tech products is
(31)
(31)
Furthermore, the New Keynesian Phillips curve of high-tech production sector can be obtained according to the log-linearization of EquationEquations (30)–(31).
(32)
(32)
The production decision-making and price setting of low-tech intermediate goods producers are similar to that of high-tech intermediate goods producers mentioned above. We will get the production decision derivation of low-tech intermediate goods producers similar to EquationEquations (20)–(28). Similarly, assuming that low-tech intermediate goods producers with a ratio of 1- have the pricing right in each period, the optimal pricing of low-tech intermediate goods producers with adjustable prices in period t can be obtained
(33)
(33)
The price level of low-tech products is
(34)
(34)
We can similarly obtain the New Keynesian Phillips curve of low-tech production sector
(35)
(35)
Finally, the inflation level of the economic system is
(36)
(36)
3.1.3. Government and monetary authority
The income of the government comes from taxes and bonds
represents government purchases. Therefore, the budget constraints faced by the government are as follows
(37)
(37)
where the total tax is the sum of the demand-side tax and the supply-side tax. The demand-side tax includes consumption tax, labour income tax and capital income tax. The supply-side tax includes high-tech enterprise income tax and low-tech enterprise income tax.
(38)
(38)
In order to achieve the dual goals of promoting economic growth and stabilizing inflation, monetary policy is represented by a generalized Taylor (Citation1993) rule of the form
(39)
(39)
where
is the smoothing parameter of interest rate,
is the sensitivity coefficient of interest rate relative to inflation, and
is the sensitivity coefficient of interest rate relative to output.
3.1.4. Market clearing conditions
General equilibrium requires all agents to achieve objective function optimization under resource constraints and finally achieve market clearing. Market clearing condition is the total output is the sum of the weighted output of the two production sectors and the government purchases.
(40)
(40)
3.1.5. Indicators of household consumption structure and development of high-tech industry
In order to reflect the tax policies to promote the upgrading of household consumption and promote the development of high-tech industry, we not only analyse the dynamic response of residents' consumption of high-tech products and output of high-tech enterprises to external shocks, but also construct the relative change index of consumption upgrading and the development of high-tech industry
(41)
(41)
(42)
(42)
The indexes do not reflect economic transmission mechanism, but only describe the response of relevant endogenous variables in the model to tax reduction. In this article, and
are defined as ‘consumption structure index’ and ‘high-tech industry development index’, respectively. Obviously,
is the positive deviation from steady-state and reflects the increase in the proportion of high-tech products consumed in total consumption, while
is the positive deviation from steady-state and reflects the increase in the proportion of high-tech enterprises' output in total output. Therefore, they respectively depict the changes of consumption structure and the industrial structure guided by the development of high-tech industry. On the demand-side, the tax reduction policy (consumption tax, labour income tax and capital income tax) directly influences the consumption choice of residents and changes the consumption structure through the total wealth path of residents on the demand side. At the same time, the change of labour supply and investment will affect the supply-side, and then affect the output of high-tech enterprises and the structure of product supplying. The tax reduction policy of supply-side tax (high-tech enterprise income tax and low technology enterprise income tax) directly affects the output and price addition of the enterprise on the supply side, and finally changes the structure of product supplying. At the same time, the choice of factors of production has an indirect impact on residents’ labour, investment, consumption and consumption structure.
3.2. Parameter calibration and estimation
In order to make the model reflect the basic characteristics of China's actual economic operation, this article adopts the method of parameter calibration to solve the model according to the standard solution steps of DSGE model. Some of the parameters are assigned with reference to relevant empirical literature, while the other part is calculated with China's actual economic data.
In this article, the form of utility function of household sector is similar to that used in the classic literature of relevant domestic studies. We can refer to Kang and Gong (Citation2014) and set the discount factor at 0.99. Referring to the research of Wang and Tian (Citation2014), the quarterly capital depreciation rate in steady state
was calibrated to 0.025. We refer to Liu (Citation2008) and set the consumption risk aversion coefficient
at 2 and the reciprocal of the Frisch Elasticity of Labour
at 1.5.
According to the estimation results of Lifeng Chen (Citation2017), and
are set at 5.12 and 6.19,
and
are calibrated at 0.3 and 0.5, respectively. Since high-tech enterprises are more dependent on capital, while low-tech enterprises are more labour-intensive, this article calibrates the capital-output elasticity of high-tech manufacturers and low-tech manufacturers at 0.6 and 0.4, respectively. According to Xu et al. (Citation2010), the parameter of price stickiness
is set at 0.75. According to the research of Bin Liu (Citation2008), the values of
and
were set at 0.95, 0.7 and 0.5, respectively.
According to 《China Statistics Yearbook on High Technology Industry》 (2016), special equipment manufacturing, transportation equipment manufacturing, computer, communication and other electronic equipment manufacturing and instrument manufacturing are set as high-tech industry, while other industries are set as low technology industries. We use the input-output table of China to get the consumption data of various industries in each year, the final calculation shows that the proportion of the consumption of high-tech products in the total consumption is 0.124. The part of individual income tax levied on labour income is represented as labour income tax income; Consumption tax revenue is represented by the portion of consumption tax levied on consumption by tariff, value-added tax and business tax; The capital income tax revenue is the sum of land use tax, property tax, vehicle purchase tax, urban maintenance and construction tax, value-added tax and individual income tax. The effective tax rates of China's consumption, labour and capital income from 1997 to 2015 are calculated, and the mean of each effective tax rate is taken as the steady-state value of each tax in the model .Thus, we get steady state of consumption tax rate
labour income tax rate
and capital income tax rate
In addition, according to 《Enterprise Income Tax Law of the People’s Republic of China》 (2007), the enterprise income tax rate is 25%, and the income tax rate of high-tech enterprises is reduced to 15%.
4. Results
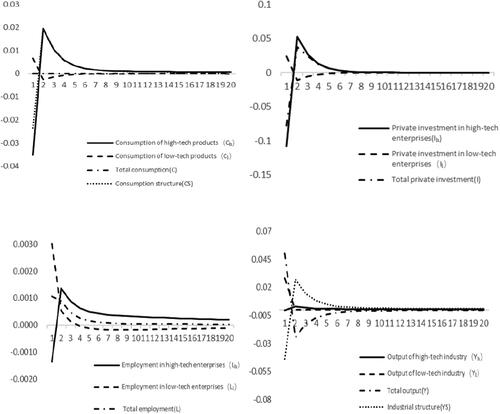
We consider the trend of Chinese policy is implementing active fiscal policy and combining with structural tax reduction to promote the development of economy. On this basis, it simulates the dynamic impact of the tax reduction policies of consumption tax, labour income tax, capital income tax, high-tech enterprise income tax and low-tech enterprise income tax. At the same time, this article examines the influence of policies on the consumption decision-making of residents, employment, investment, the allocation of corporate resources, and the price setting. Besides, it analyzes the dynamic changes of consumption structure index and the development index of high-tech industry. In general, the following are the responses of consumers, producers and economic structures (consumption structure: and industrial structure:
) to the tax reduction policies.
4.1. Analysis of the effects of consumption tax reduction
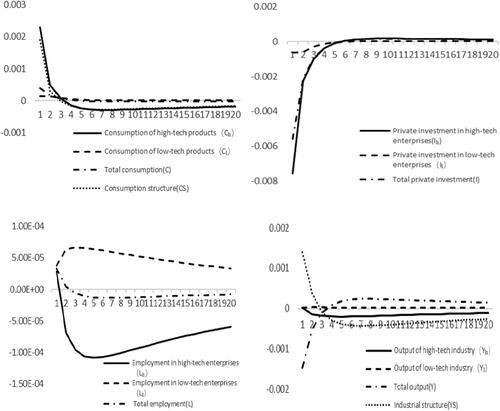
As shown in , the reduction of consumption tax in the short term is conducive to stimulating consumption and promoting the upgrading of consumption structure, but it is not favorable to the increase in output. In the short term, the development of high-tech industry can be boosted. For one thing, the reduction of consumption tax rate has a positive wealth effect on residents. To be specific, the residents will increase the consumption of high-tech products and low-tech products. Besides, high-tech products with high technological level and high value-added are more popular among consumers. The decrease of consumption tax rate promotes the upgrading of residents’ consumption structure. What’s more, the increase in household consumption has a crowding-out effect on investment. Under the condition that the elements can be replaced, the total employment demand will increase. However, due to the large labour demand and low employment threshold of low-tech enterprises, they are easy to obtain more labour supply. In the short run, the capital substitution of high-tech enterprises is relatively low, and the sharp decrease of investment may lead to the net outflow of labour. As a result, the output of high-tech enterprises and low-tech enterprises will drop. In addition, the inhibitory effect of the consumption tax reduction policy on the output of high-tech enterprises is higher than that on the output of low-tech enterprises, resulting in the decline of the total social output. Since the decline degree of high-tech industry output is lower than that of total output, the indicators to measure the development of high-tech industry will rise in a short period. Nevertheless, with the gradual rise of the total output, the development indicators of high-tech industry will fall back to be slightly lower than the steady-state level.
Figure 1. Response to the impacts of consumption tax reduction.
Source: all drawn by author, and the data used are obtained by numerical simulation of the model built in the paper through MATLAB.
4.2. Analysis of the effects of capital income tax reduction
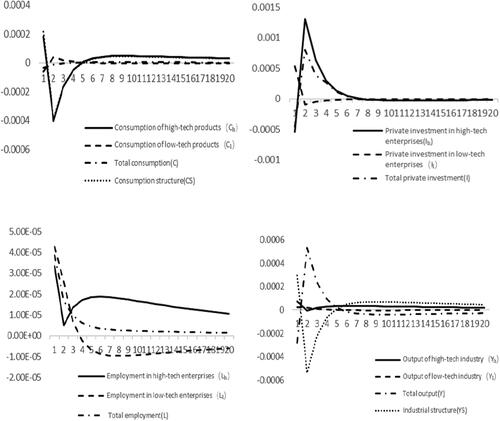
As displayed in , the capital income tax reduction policy can significantly promote investment from the second quarter. Particularly, the medium and long-term effect on investment in high-tech enterprises is more significant. With the coordinated growth of capital and labour force, the output of high-tech enterprises continues to grow steadily. However, due to the lag of consumption inertia and income expectation, the reduction of capital income tax has only a weak stimulating effect on the consumption of high-tech products and the upgrading of consumption structure. Beyond that, there will be some negative effects in the short and medium term. Therefore, in the choice of capital income tax reduction policy, it is essential to weigh its effects on consumption structure upgrading and output growth of high-tech industry.
Figure 2. Response to the impacts of capital income tax reduction.
Source: all drawn by author, and the data used are obtained by numerical simulation of the model built in the paper through MATLAB.
4.3. Analysis of the effects of labour income tax reduction
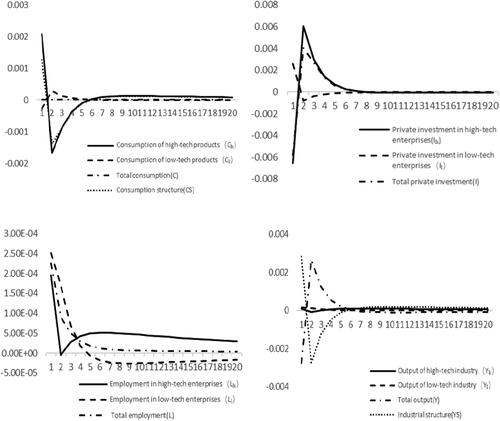
As indicated in , the labour income tax reduction is conductive to expanding employment, increasing low-tech labour supply, driving the growth of investment, and promoting the growth of total output. In particular, the growth effect of low-tech industry is significantly higher than that of high-tech industry. In the long term, the reduction of labour income tax can promote the total consumption, yet the short-term positive policy effect is lower than that of consumption tax. The reduction of labour income tax has promotion effect on the upgrading of consumption structure in the first phase. However, it then becomes negative. Due to the flow of labour to high-tech enterprises in the medium and long term, high-tech enterprises need more investment. Since the increase in private investment in high-tech enterprises has squeezed out the consumption of high-tech products, the reduction of labour income tax will not greatly influence the upgrading of consumption structure. Nevertheless, the reduction of labour income tax can promote the consumption structure to a certain extent in the long term. On the other hand, the policy of labour income tax reduction boosts the development of high-tech industry.
Figure 3. Response to the impacts of labour income tax reduction.
Source: all drawn by author, and the data used are obtained by numerical simulation of the model built in the paper through MATLAB.
4.4. Analysis of the effects of income tax reduction for high-tech enterprises
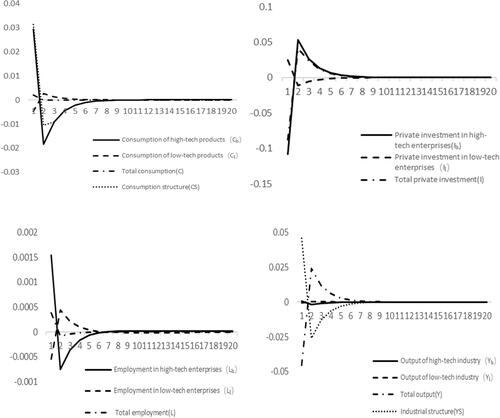
As shown in , reducing high-tech enterprise income tax increases the profits of high-tech enterprises, transfers the risks of innovation investment of enterprises, drives the expansion of investment scale of high-tech enterprises, and promotes the innovation activities of enterprises (Eberhart et al., Citation2008). Overall, it is conducive to the upgrading of industrial structure. In the short term, the labour flows from low-tech enterprises to high-tech enterprises, so that the output growth of high-tech industry can be achieved. According to the dynamic change of the development index of high-tech enterprises, it can be seen that reducing high-tech enterprise income tax plays a role in promoting the development of high-tech industries. However, it has not exerted an ideal stimulating effect on the output of high-tech enterprises in the medium and long term. This shows that the incentive effect of some preferential tax policies has been significantly weakened, and even hindered the development of high-tech industry. Therefore, in order to ensure the long-term development of high-tech industry, China should strengthen the implementation of indirect preferential policies (e.g., depreciation, investment credit, loss carry forward, expense deduction and technical reserve system), coordinate the use of direct and indirect preferential policies, and effectively promote the output growth of high-tech industry. Besides, reducing high-tech enterprise income tax makes the relative price of high-tech products drop, which further causes the residents to increase the consumption of high-tech products and reduce the consumption of low-tech products. In the short term, it can significantly promote the upgrading of the consumption structure.
Figure 4. Response to the impacts of income tax reduction for high-tech enterprises.
Source: all drawn by author, and the data used are obtained by numerical simulation of the model built in the paper through MATLAB.
4.5. Analysis of the effects of income tax reduction for low-tech enterprises
As displayed in , in a short term, reducing low-tech enterprise income tax is conducive to the improvement of profits and output growth of low-tech enterprises, which can promote the increase in total consumption and the reverse upgrading of consumption. However, due to the lack of entry barriers in low-tech industries, reducing low-tech enterprise income tax intensifies the competition within the industry. In the medium and long term, it will also stimulate enterprises to enhance the power of independent innovation, improve the level of R&D investment. Finally, low-tech enterprises have been transformed into high-tech enterprises, so as to realize the upgrading of consumption and industrial structure
Figure 5. Response to the impacts of income tax reduction for low-tech enterprises.
Source: all drawn by author, and the data used are obtained by numerical simulation of the model built in the paper through MATLAB.
4.6. Analysis of the effects of tax reduction on economic structure
In addition to the above-mentioned analysis of the impacts of tax reduction policies on major macro variables, this article is concerned about the effects of tax reduction on economic restructuring. The ‘consumption structure index’ () and ‘high-tech industry development index’ (
) are constructed in EquationEquations (41)
(41)
(41) and Equation(42)
(42)
(42) . For the purpose of comparing the impacts of five tax reduction policies on consumption structure and industrial structure, this article separately plots the responses of the ‘consumption structure index’ and ‘high-tech industry development index’ to various tax cuts (see ).
Figure 6. Response of the ‘consumption structure index’ to various tax cuts.
Source: all drawn by author, and the data used are obtained by numerical simulation of the model built in the paper through MATLAB.
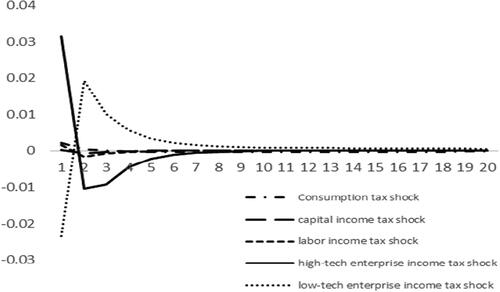
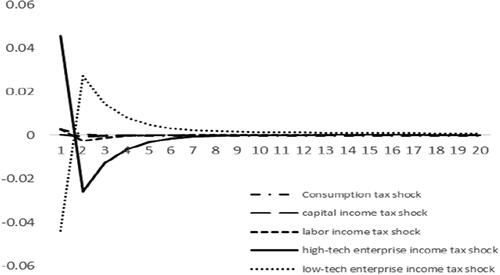
Figure 7. Response of the ‘high-tech industry development index’ to various tax cuts.
Source: all drawn by author, and the data used are obtained by numerical simulation of the model built in the paper through MATLAB.
As shown in , compared with the demand-side tax reduction policies (e.g., consumption tax, capital income tax and labour income tax reduction), the supply-side tax reduction policies (e.g., enterprise income tax reduction) is more effective to adjust the consumption structure. Under the background of continuous improvement of consumption ability and more rational consumption concept, the effect of demand-side tax reduction policies (consumption tax, capital tax, and labour tax) on the upgrading of consumption structure is not significant enough. In fact, the structural imbalance on the supply side of Chinese economy is more serious, and the burden of enterprise taxes is also heavy. In short, the structural tax reduction on the supply side can upgrade the consumption structure, stimulate enterprises to increase spontaneous innovation and R&D investment, and promote the development of high-tech industry in coordination with the demand-side structural tax reduction policy. At the same time, it is of great necessity to make up the ‘quantity gap’ and ‘quality gap’ in the supply of high-end products so as to boost the upgrading of consumer structure.
As shown in , the supply-side tax reduction policies have a more obvious incentive effect on the development of high-tech enterprises than the demand-side tax reduction ones. In the context of supply-side reform in China, the government should take a positive supply-side structural tax reduction policy, so as to improve the efficiency of resource allocation and drive the development of high-tech industry. At the same time, it is important to coordinate with the demand-side tax reduction policy. We will promote the transformation of China’s innovation path from ‘learning by doing and imitating’ to the core technology innovation based on the high-end human capital, and foster endogenous growth path.
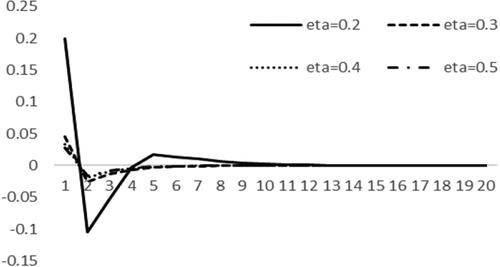
4.7. Sensitivity analysis of the effect of high-tech enterprise income tax reduction on the elasticity of labour substitution
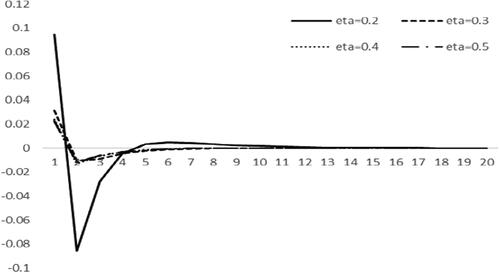
For investigating the impact of labour substitution elasticity between high-tech and low-tech enterprises on the corporate income tax reduction effect, this article sets four values of labour substitution elasticity coefficient and takes the high-tech enterprise income tax reduction policy as an example for sensitivity analysis. The response of the ‘high-tech industry development index’ to high-tech enterprise income tax reduction is shown in . It is obvious that the smaller the elasticity of labour substitution between high-tech and low-tech enterprises, the greater impact of high-tech enterprise income tax rate on the development of high-tech industry. Under all kinds of elasticity of labour substitution, reducing high-tech enterprise income tax plays a certain role in promoting the development of high-tech industry. If the elasticity of labour substitution is lower, the barrier of the labour market of high-tech enterprises is higher. Owing to the lack of supply of high-tech labour in the short term, it is impossible to increase the investment of high-tech enterprises caused by tax reduction policies. Therefore, it will restrain the development of high-tech industry. However, in the medium and long term, when it is 0.2 (i.e., when the technological level and innovation ability of high-tech enterprises are the strongest), the enterprise income tax reduction effect of promoting the development of high-tech industry is obvious. Indeed, the smaller the elasticity of labour substitution, the higher the professional skills of the high-tech enterprises’ labour and the higher the efficiency of resource allocation. Then, it is conductive to promoting the upgrading of the industrial structure. In addition, reducing high-tech enterprise income tax not only lowers the R&D risk for enterprises, but also helps enterprises increase R&D investment and obtain monopoly profits. At the same time, high-tech has the positive externality of quasi-public goods, which will inevitably promote the industrial development of the whole society and guide the upgrading of industrial structure.
Figure 8. Response of the ‘high-tech industry development index’ to high-tech enterprise income tax reduction under different labour substitution elasticities.
Source: all drawn by author, and the data used are obtained by numerical simulation of the model built in the paper through MATLAB.
The response of the ‘consumption structure index’ to high-tech enterprise income tax reduction is shown in . It can be seen that the smaller elasticity of labour substitution between high-tech and low-tech enterprises, the greater impact of high-tech enterprise income tax reduction on the upgrading of consumer structure. As a matter of fact, the lower elasticity of labour substitution, the lower labour substitutability of high-tech industry, and the higher skill barrier in labour market of high-tech industry. This also means that high-tech enterprises have a high level of technological progress and innovation ability. As a result, the increase in profits brought by the tax reduction policy will make enterprises actively reduce the price mark-up of finished products and expand the market. In this way, it will promote the higher consumption structure of residents. Meanwhile, the promotion of high-tech enterprise income tax reduction to the development of high-tech industry has also boosted the upgrading of consumption structure.
Figure 9. Response of the ‘consumer structure index’ to high-tech enterprise income tax reduction under different labour substitution elasticities.
Source: all drawn by author, and the data used are obtained by numerical simulation of the model built in the paper through MATLAB.
From to , we can find that there are differences in the degree and timeliness of the effects of different tax reduction policies. In addition to the above dynamic analysis, we also provide cumulative present value multipliers of the ’consumption structure index’ and ‘high-tech industry development index’ for the short-term (four quarters) and the longer term (twenty quarters) in Appendix 3 to enable comparability across the figures.
5. Conclusions
In this article, we study the impact of structural tax cuts based on the heterogeneous NK-DSGE model. Specifically, we analyse the effects of consumption tax, labour income tax, capital income tax, and income tax for high-tech enterprises and low-tech enterprises shocks on both aggregate and disaggregate consumption, on investment, on labour, and on two indexes that we build to measure the structure of household consumption and the development of high-tech industry. In addition, this article considers changes in the elasticity of labour substitution between high-tech enterprises and low-tech enterprises can influence the effect of cuts in tax (We take the cuts in income tax for high-tech enterprises as an example for research).
Based on the above, this article draws the following conclusions:
Reducing the income tax of high-tech enterprises can significantly promote the upgrading of consumption structure and the development of high-tech industries in the short term. In addition, reducing the income tax of low-tech enterprises can promote the upgrading of consumption structure and the development of high-tech industries in the medium and long term. However, the reduction of income tax for low-tech enterprises is negative in the short term. Especially, the lower the elasticity of labour substitution between high-tech and low-tech enterprises, the more effective the income tax reduction policy for high-tech enterprises. The income tax relief policy of high-tech enterprises has the greatest impact on the upgrading of consumption structure and industrial structure when
In general, income tax reduction for high-tech enterprise and income tax reduction for low-tech enterprises can promote the upgrading of consumption structure and the development of high-tech industry, despite their different degrees of influence and effective time.
This article finds that cuts in demand-side tax (consumption tax, labour income tax, and capital income tax) all can promote the upgrading of consumption structure and the development of high-tech industry in the long run. Among them, the incentive effect of reducing consumption tax is the most significant. The effect of supply-side tax reduction plays a greater role in adjusting consumption structure than demand-side tax reduction. The different effects of supply-side tax reduction and demand-side tax reduction illustrate that supply of high-tech products is insufficient to meet the needs of residents, which restricts the upgrading of the consumption structure of Chinese residents.
The tax reduction policy of a single tax cannot upgrade the consumption structure and industrial structure at the same time. To achieve this goal, we need the collocation and coordination of a variety of tax policies.
According to the conclusion, this article puts forward the policy recommendations for the Chinese government. China can use more corporate income tax to adjust the consumption structure and industrial structure effectively. Meanwhile, it needs to be accompanied by the change of demand-side tax rate. For example, the upgrading of consumption structure and the development of high-tech industries can be realized by using different levels of consumption tax and low-tech corporate income tax reduction policies simultaneously.
However, if considering employment or investment, the Chinese government is required to consider choosing other combinations policy tools. The Chinese government should strengthen education to reduce employment barriers in the labour market, which is a good way to enhance the policy effect.
Moreover, the model based on this article can also study some deeper problems, as this model brings heterogeneous consumers and manufacturers into a unified NK-DSGE model. Further research can be expanded in two perspectives: consumer behavior and manufacturer decision-making. Possible future research propositions are presented in Appendix 4.
Disclosure statement
No conflict of interest has been declared by the authors.
Additional information
Funding
Notes
1 The earliest prototype of DSGE model is the Real Business Cycle (RBC) theory proposed by Kydland and Prescott (Citation1982). The New Keynesian DSGE model incorporates the innovation of RBC theory in methodology and adds more realistic microeconomic assumptions. For example, researchers introduced price stickiness, monopolistic competition and other factors into the RBC model (Yun, Citation1996; Christiano et al., Citation2005).
2 This hypothesis draws on the experience of Christiano et al. (Citation2005), Celso (Citation2016).
3 Autoregressive Process of Order One is recorded as AR(1). Just like the most relevant literature, in order to depict the dynamic change of policy for this model, the process of policy change is set as AR(1). As a result, policy changes create economic fluctuations that level off over time.
References
- Alcott, L. (2015). Industrialization, employment and the sustainable development agenda. Development, 58(4), 528–539.
- Babecký, J., Berson, C., Fadejeva, L., Lamo, A., Marotzke, P., Martins, F., & Strzelecki, P. (2019). Non-base wage components as a source of wage adaptability to shocks: Evidence from European firms, 2010–2013. IZA Journal of Labor Policy, 8(1), 1–18. https://doi.org/10.1186/s40173-018-0106-8
- Balibago, T., Diao, X. S., Terry, R., & Somwaru, A. (2013). Measuring strucutral change: The case of China, Malaysia, and Ghana. The Journal of Developing Areas, 1, 373–393.
- Calvo, G. A. (1983). Staggered prices in a utility maximizing framework. Journal of Monetary Economics, 12(3), 383–398. https://doi.org/10.1016/0304-3932(83)90060-0
- Cappelen, A., Raknerud, A., & Rybalka, M. (2012). The effects of R&D tax credits on patenting and innovations. Research Policy, 41(2), 334–380. https://doi.org/10.1016/j.respol.2011.10.001
- Celso, C. J. (2016). Understanding DSGE models. Vernon Press.
- Cernikova, M., & Hyblerova, S. (2021). Tax support evaluation for R&D activities of companies. Technological and Economic Development of Economy, 27(5), 1057–1071. https://doi.org/10.3846/tede.2021.15147
- Chen, L. F. (2017). Skill mismatch, inequality and social welfare: A DSGE model based on heterogeneous skills. Economic Science, 6, 58–71.
- Christiano, L., Eichenbaum, M., & Evans, C. (2005). Nominal rigidities and the dynamic effects of a shock to monetary policy. Journal of Political Economy, 113(1), 1–45. https://doi.org/10.1086/426038
- Djinkpo, M. (2019). A DSGE model for Fiscal Policy Analysis in The Gambia. MPRA paper.
- Eberhart, A., Maxwell, W., & Siddique, A. (2008). A reexamination of the tradeoff between the future benefit and riskiness of R&D increases. Journal of Accounting Research, 46(1), 27–52. https://doi.org/10.1111/j.1475-679X.2007.00264.x
- Fodio, A., Shen, W., & Yang, S. S. (2020). The fiscal state-dependent effects of capital income tax cuts. Journal of Economic Dynamics and Control, 117, 103860.
- Gali, J., Valles, J., & Lopez-Salida, J. D. (2007). Understanding the effects of government spending on consumption. Journal of the European Economic Association, 5(1), 227–270.
- Huang, Z. L. (2005). A study on business cycle and the effects of fiscal policy in China: An empirical study on a RBC model with three sections. Economic Research Journal, 6, 27–39.
- Huang, K. N. (2015). Coevolution between supply side and demand side: From the perspective of evolutionary growth. South China Journal of Economics, 12, 1–9.
- Iwata, Y. (2011). The government spending multiplier and fiscal financing: Insights from Japan. International Finance, 14(2), 231–264. https://doi.org/10.1111/j.1468-2362.2011.01285.x
- Kang, L., & Gong, L. T. (2014). Financial Friction, net worth of bank and the transmission of international economic crisis – Based on multi-sector DSGE model analysis. Economic Research Journal, 49(05), 147–159.
- Kydland, F., & Prescott, E. (1982). Time to build and aggregate fluctuations. Econometrica, 50(6), 1345–1370. https://doi.org/10.2307/1913386
- Liu, B. (2008). The development of DSGE model in China and its application in monetary policy analysis. Journal of Financial Research, 10, 1–21.
- Lokshin, B., & Mohnen, P. (2013). Do R&D tax incentives lead to higher wages for R&D workers evidence from The Netherlands. Research Policy, 30(2), 39–50.
- Mountford, A., & Uhlig, H. (2009). What are the effects of fiscal policy shocks? Journal of Applied Econometrics, 24(6), 960–992. https://doi.org/10.1002/jae.1079
- Su, W. H., & Fan, Y. H. (2021). Income tax preference and R&D investments of high-tech enterprises in China. E + M Ekonomie a Management, 24(4), 156–173. https://doi.org/10.15240/tul/001/2021-4-010
- Sun, Z., & Xu, X. L. (2018). Industrial innovation and consumption upgrade: An empirical study based on the perspective of supply-side structural reform. China’s Industrial Economics, 7, 98–116.
- Takyi, P. O., & Gonzalez, R. L. (2020). Macroeconomic impact of fiscal policy in Ghana: Analysis of an estimated DSGE model with financial exclusion. Economic Analysis and Policy, 67, 239–260. https://doi.org/10.1016/j.eap.2020.07.007
- Taylor, J. B. (1993). Discretion versus policy rules in practice. Carnegie-Rochester Conference Series on Public Policy, 39, 195–214. https://doi.org/10.1016/0167-2231(93)90009-L
- Wang, G. J., & Tian, G. Q. (2014). Government spending multiplier. Economic Research Journal, 49(09), 4–19.
- Wang, L. Y., & Xu, X. L. (2018). Enterprise heterogeneity, financial frictions and the government spending multiplier. Economic Research Journal, 53(08), 100–115.
- Xu, Z. W., Xue, H. X., & Luo, D. Q. (2010). Financial constraint and Chinese business cycles: A dynamic analysis in the New Keynesian framework. China Economic Quarterly, 10(01), 83–110.
- Yun, T. (1996). Nominal price rigidity, money supply endogeneity, and business cycles. Journal of Monetary Economics, 37(2–3), 345–370. https://doi.org/10.1016/0304-3932(96)01246-9
- Zhang, M. X., Guo, X. X., & Li, Y. H. (2020). Research on the mechanism of the reflux of overseas high-end consumption on digital and intelligent upgrade of Chinese industry. Word Economy Studies, 1, 107–120.
- Zhang, T. B., & Gao, T. M. (2012). Finance and taxation policy motivation, high-tech industry development and industrial structure adjustment. Economic Research Journal, 47(05), 58–70.
- Zwick, E., & Mahon, J. (2017). Tax policy and heterogeneous investment behavior. American Economic Review, 107(1), 217–248. https://doi.org/10.1257/aer.20140855
Appendix 1
This section introduces the more detailed equations of the model and their derivation.
A1.1 Households
The utility of representative families:
(A.1)
(A.1)
The total of consumption:
(A.2)
(A.2)
The total of labour supply:
(A.3)
(A.3)
The law of motion of capital:
(A.4)
(A.4)
(A.5)
(A.5)
The household’s budget constraint:
(A.6)
(A.6)
The goal of representative agent is maximizing the lifetime utility U. The Lagrange is given by:
(A.7)
(A.7)
We substitute EquationEquation (A.3)–(A.5) into EquationEquation (A.7)(A.7)
(A.7) to calculate the partial derivative. First order conditions are given below:
(A.8)
(A.8)
(A.9)
(A.9)
(A.10)
(A.10)
(A.11)
(A.11)
(A.12)
(A.12)
The household's total consumption expenditure:
(A.13)
(A.13)
We solve the minimization of consumption expenditure by combining EquationEquations (A.2) (A.6)(A.6)
(A.6) and Equation(A.13)
(A.13)
(A.13) . The overall price level and residents' consumption choices can be obtained.
(A.14)
(A.14)
(A.15)
(A.15)
(A.16)
(A.16)
A1.2 Firms
This part focuses on the detailed equations of intermediate goods producers.
For high-tech intermediate goods producers
Production function:
(A.17)
(A.17)
Production cost:
(A.18)
(A.18)
Using the Lagrangian function to solve the previous problem of high-tech intermediate goods producers
(A.19)
(A.19)
The first order conditions are:
(A.20)
(A.20)
(A.21)
(A.21)
From EquationEquations (A.20)(A.20)
(A.20) and Equation(A.21)
(A.21)
(A.21) , we arrive at
(A.22)
(A.22)
We can obtain from EquationEquations (A.17)(A.17)
(A.17) and Equation(A.22)
(A.22)
(A.22)
(A.23)
(A.23)
(A.24)
(A.24)
Substituting EquationEquation (A.23)(A.23)
(A.23) into EquationEquation (A.17)
(A.17)
(A.17) , we arrive that
(A.25)
(A.25)
(A.26)
(A.26)
For the high-tech intermediate goods producers with pricing power, the price of its product in period t is determined according to the maximization of its profit subject to EquationEquations (A.25)(A.25)
(A.25) and Equation(A.26)
(A.26)
(A.26) :
(A.27)
(A.27)
The first order condition can be obtained
(A.28)
(A.28)
Wage and return on capital can be obtained by substituting EquationEquation (A.28)(A.28)
(A.28) into EquationEquations (A.20)
(A.20)
(A.20) and Equation(A.21)
(A.21)
(A.21) .
(A.29)
(A.29)
(A.30)
(A.30)
The price setting process has been described in detail in the article. Then, we continue to deduce the equation of low-tech intermediate goods producers.
For low-tech intermediate goods producers
Production function:
(A.31)
(A.31)
Production cost:
(A.32)
(A.32)
Using the Lagrangian function to solve the previous problem of low-tech intermediate goods producers:
(A.33)
(A.33)
The first order conditions are:
(A.34)
(A.34)
(A.35)
(A.35)
From EquationEquations (A.34)(A.34)
(A.34) and Equation(A.35)
(A.35)
(A.35) , we arrive at:
(A.36)
(A.36)
We can obtain from EquationEquations (A.31)(A.31)
(A.31) and Equation(A.36)
(A.36)
(A.36)
(A.37)
(A.37)
(A.38)
(A.38)
Substituting EquationEquation (A.37)(A.37)
(A.37) into EquationEquation (A.31)
(A.31)
(A.31) , we arrive that
(A.39)
(A.39)
(A.40)
(A.40)
For the low-tech intermediate goods producers with pricing power, the price of its product in period t is determined according to the maximization of its profit subject to EquationEquations (A.39)(A.39)
(A.39) and (A.40):
(A.41)
(A.41)
The first order condition can be obtained
(A.42)
(A.42)
Wage and return on capital can be obtained by substituting EquationEquation (A.43)(A.43)
(A.43) into EquationEquations (A.34)
(A.34)
(A.34) and Equation(A.35)
(A.35)
(A.35) .
(A.43)
(A.43)
(A.44)
(A.44)
A1.3 Government and monetary authority
The budget constraints faced by the government:
(A.45)
(A.45)
Monetary policy:
(A.46)
(A.46)
A1.4 Aggregate resource constraints
(A.47)
(A.47)
A1.5 Exogenous processes
There are five exogenous shocks in the model. It is assumed that the logarithm of the demand-side tax rate (consumption tax, labour income tax, and capital income tax rate) and the supply-side tax rate (high-tech enterprise income tax, low-tech enterprise income tax) follows the Footnote3.
(A.48)
(A.48)
(A.49)
(A.49)
(A.50)
(A.50)
(A.51)
(A.51)
(A.52)
(A.52)
and
are the shock innovations from tax cuts, all being serially uncorrelated and independent of each other.
and
are the sustainability coefficient of tax policy.
Appendix 2
The parameter calibration values of the DSGE model constructed in this article are shown in .
Table 1. The result of parameter calibration.
Appendix 3
Multipliers are calculated as in Mountford and Uhlig (Citation2009) with the following formula:
(A.53)
(A.53)
where
From , we can see more clearly the total effect of tax reduction policies on consumption structure and industrial structure in a period of time. If we reduce low-tech enterprise income tax to promote consumption upgrading and the development of high-tech industry, the short-term adverse effects of the policy must be considered. We can consider reducing the consumption tax to make up for its short-term adverse effects. Similarly, we should reduce labour income tax or capital income tax if the high-tech enterprise income tax reduction policy is adopted. This can make up for the long-term negative effects of the high-tech enterprise income tax reduction policy.
Table 2. Multipliers.
Appendix 4
From the perspective of consumer behavior, tax cuts will increase consumer income. Residents’ total consumption and consumption structure will increase in the same way. We find that structural tax reduction policy can promote the upgrading of consumption structure and the development of high-tech industries by influencing macroeconomic variables such as investment and labour. As we all know, the marginal propensity to consume is an important topic. It is interesting that whether the tax cut will have an impact on the marginal propensity to consume. If the marginal propensity to consume changes, then the reason is the direct impact of tax cuts or the indirect impact of changes in the consumption structure. Moreover, this article pays attention to the changes in the elasticity of labour substitution (The results can be seen in and ). However, consumption preference parameter in EquationEquation (13)
(13)
(13) reflects the preference of Chinese residents for high-tech products. Different value of
will make cuts in tax have different impacts on residents' consumption behavior. And the degree of change in the consumption structure will also be different. Demand-side tax cuts will increase household consumption. The increase in consumption of high-tech products is smaller than the increase in total consumption when
is smaller. We predict that the positive effect of tax reduction on the upgrading of consumption structure decreases with the decrease in
From the perspective of corporate decision-making, production function is extremely important. Capital share of output ( and
) and labour share of output (1-
and 1-
) determine the manufacturer’s production method. We can focus on the effect of structural tax reduction policy on investment and labour by changing the value of
and
This will tell us the changes in the impact of tax reduction policies on the economic system under different production methods. Government judges what level of taxation is more beneficial based on its own business conditions. On the other hand, changes in output will also affect the demand side. Changing the value of
and
will affect product prices and effective supply through the path of output. So, it has an impact on residents' consumption.