
 ?Mathematical formulae have been encoded as MathML and are displayed in this HTML version using MathJax in order to improve their display. Uncheck the box to turn MathJax off. This feature requires Javascript. Click on a formula to zoom.
Abstract
Paying attention is one of the most important brain-based cognitive skills. The detrimental effect of air pollution on brain function has been largely studied by way of experiments in Neuroscience. In this paper, we provide a new way to study the impact of air pollution - in particular PM2.5 - on brain attention through observing the inattentive responding of the participants in online surveys. We construct the inconsistent index and connect it to the individual’s exposure to air pollution. The preferred estimate reveals that a one standard deviation of PM2.5 (around 30 ) increases the likelihood of inconsistency by 2.25%. Further heterogeneous analysis shows that air pollution appears to have larger effects on those young groups with high education but low income, especially for students, and the number is 5.36%. This study explores the impact of air pollution on brain health from a new perspective, and also provides a mechanism to support the recent study about air pollution and productivity.
1. Introduction
This article attempts to explore the possible link between air pollution and people’s brain attention by observing the inconsistent responses when filling out the web-based survey. After controlling for all the other confounding factors, the inconsistent index that changes with air pollution could be inferred to be driven by the polluted attention of the participants. Paying attention is the first step of learning and sustained concentration is essential in the workplace. Exploring the underlying environmental factors that affect people’s attention not only helps to improve brain health in its own right, but also contributes to the existing research of air pollution and work performance.
Brain’s attention, related to perception and memory, is one of the most important brain-based cognitive skills (Zhang, Citation2019). There is a growing body of cross-sectional literature that recognises the association between air pollutants and brain function. The common pollutants in the atmosphere mainly include dust or inhalable particulate matter (PM), sulfur dioxide (SO2), nitrogen oxides (NO2), carbon monoxide (CO) and Ozone (O3), among which PM is the most harmful component to brain health (Ao et al., Citation2021; Peeples, Citation2020; Younan et al., Citation2020). PM2.5 with particle size less than 2.5 microns, acting as a vector, is more likely to be attached by toxic and harmful substances (such as heavy metals, microorganisms, etc.).
Neurotoxicologist Deborah Cory-Slechta indicated that tiny particles could be carried to the brain through the olfactory nerve (Elder et al., Citation2006).Footnote1 A recent study by Peeples (Citation2020) suggested that particulate pollutants could affect the brain’s function through the bloodstream, even without directly entering the brain. Cory-Slechta’s team studied the newborn mice exposed to air pollution in short term, and found a large amount of inflammation existing in all of their brain regions. Moreover, they also reported that the white matter in the corpus callosum was significantly reduced, and the mice appeared to show autism, attention deficit disorder and schizophrenia (Jew et al., Citation2019). Kilian and Kitazawa (Citation2018) reviewed the literature from epidemiological and animal studies, and provided a large amount of evidence supporting the neurotoxic effects of air pollutants. In this study, we provide a new way to study the impact of air pollution on brain’s attention by observing the inattentive responding of the participants in online surveys.
Online survey has been one of the most popular methods to realize data collection and information processing attributable to its convenience, low cost, speed and efficiency (Cobanoglu et al., Citation2001; Rice et al., Citation2017). Since network is widely distributed, web-based surveys break the restrictions of time and space, and effectively increase the survey response rates compared to the traditional methods, like mail-in surveys and phone interviews. However, when collecting data from anonymous Internet users, the reliability and consistency of the responses have been the biggest challenges (Tuten et al., Citation2002).
Due to the lack of guidance and assistance from the professional investigators, online participants are more likely to be inattentive and make careless mistakes in uncontrolled settings (Cheung et al., Citation2017). According to the identification method from Meade and Craig (Citation2012), there were nearly 10% to 20% of the participants exhibiting the careless behaviour when filling out the online surveys, which was also referred to as insufficient effort responding (Bowling et al., Citation2016). Brühlmann et al. (Citation2020) conducted a Latent Profile Analysis and revealed that almost 45.9% of the respondents showed careless behaviour to a certain extent. This kind of error, caused by the participants’ insufficient attention, could directly reduce the quality of online survey data, even irrelevant to the content of the questionnaire.
The inattentive or careless responding of participants in online surveys has been extensively studied in the fields of psychology and sociology (Curran, Citation2016; Maniaci & Rogge, Citation2014). Most of the existing research pays attention to its causes, impact on data accuracy, and how to identify and prevent the problem (Brühlmann et al., Citation2020; Kam & Meyer, Citation2015). In this paper, we focus on the external environmental factors, and provide the first evidence that the elevated air pollution increases the inconsistent response existing in web-based surveys. The underlying mechanism behind the results could be inferred that air pollution threatens brain health through physiological pathways and reduce the attention of the participants, so that people fail to make sufficient efforts to the responding work (Jew et al., Citation2019).
The inconsistent response is the most representative mistake due to inattentiveness, that is people offering the different responses when answering two very similar questions. There is a large volume of research developing the psychometric tests to identify the inattentive responses in the surveys, like the Personality Assessment Inventory (PAI) developed by Leslie Morey at the Texas A&M University (Morey & Lowmaster, Citation2010) and the Minnesota Multiphasic Personality Inventory (MMPI) developed by Starke R. Hathaway and J. C. McKinley at the University of Minnesota (Butcher, Citation2010). Maniaci and Rogge (Citation2014) mainly introduced two approaches of the infrequency scales and the inconsistency scales, and also stated their effectiveness at measuring the people’s inattentive responses.Footnote2
In this paper, we follow the approach introduced by Maniaci and Rogge (Citation2014) and take advantage of the unique feature existing in the Netizen Ideology Survey launched in 2014, 2015 and 2017, where the pair of identical questions or contents are presented in different ways. Based on the attitude differences in responses of the participants, we construct the inconsistent index which is a binary variable, with 0 representing the consistency and 1 for the existence of the inconsistent behaviours. Correspondingly, the individual’s exposure to air pollution is matched to every respondent according to the disclosed IP address and their responding time. We implement the probit model to regress the binary inconsistent index on the daily average concentration of PM2.5 at the city level. In an effort to alleviate the endogeneity problem, city fixed effects and temporal dummies are controlled throughout the regression work. Moreover, considering the potential confounding factors, a series of weather covariates and demographic characteristics are also involved in the estimation.
In our preferred specifications, the estimates reveal that a one standard deviation of PM2.5 (around 30 ) increases the likelihood of inconsistency by 2.25%. The estimates prove to be remarkably significant and robust under a variety of tests. Provided that the effect size could differ under the heterogeneous demographic groups, we further replicate the regressions in sub-samples of different gender, age, education, income and jobs. The results suggest that air pollution appears to have larger effects on those young groups with high education but low income, especially for students, and the number is 5.36%.
In addition, thermal environment is also a significant factor that affects people’s attention ability to accomplish a certain task. Many recent studies (e.g. Choi and Chun (Citation2009); Lee et al. (Citation2012)) have shown that temperature controlled at 20 C to 25
C is conductive to exerting the better attention ability. The similar result is found in our work. We create seven bins of average temperature in the regression, with 5
C as each of bin width. Compared to the temperature under 5
C, temperature between 20
C to 25
C decreases the inconsistency by 26.46%. The additional study on temperature could also be seen as a supplement to confirm the validity of our construction of the inconsistent index.
Focus on the attention loss due to air pollution is interesting. However, we are careful not to over-interpret the outcomes. Measuring the effect of attention impairment falls outside the scope of this article. The results are instructive from two aspects. Firstly, as far as the survey itself is concerned, inattentive responding impacts the accuracy and validity of the data, reducing the statistical power. Secondly, the results could also be extended to other learning and work scenarios, providing a mechanism to support the study that explores the association between air pollution and labour productivity (Graff Zivin & Neidell, Citation2012; Liu et al., Citation2021), worker performance (Chang et al., Citation2019), school-based grade point (Balakrishnan & Tsaneva, Citation2021; Grineski et al., Citation2016), and traffic accidents (Sager, Citation2019; Wan et al., Citation2020).
The remainder of the paper is organized as follows. Section 2 describes the data sources. Section 3 explains the empirical methodology involved in the regression. Section 4 presents the main results. Section 5 further discusses the heterogeneous effects. Section 6 conducts the robust tests. Section 7 examines the placebo tests. Section 8 concludes the study.
2. Data
The objective of this paper is to investigate the potential link between air pollution and the impaired attention. Thus, the measurement of people’s inattention has become the most important challenge at the beginning. Here, we provide a new thought to study the inattentive (or careless) responding existing in the online surveys, and examine whether the inattentive behaviours of the participants are affected by their exposure to air pollution.
2.1. Online survey
The online survey we mainly use for this analysis is the ‘Netizen Ideology Survey’ designed and implemented by Dr.Ma at the Renmin University in Beijing, that was published on the platform of the Chinese General Social Survey (CGSS). The project aims to explore the ideology of netizens from multiple perspectives, such as social identity, patriotism, nationalism, ideological stance, political and social trust, democratic values, etc.
The ‘Netizen Ideology Survey’ had carried out three rounds of online questionnaires in 2014, 2015 and 2017, respectively. Specifically, during May to July in 2014, July to August in 2015, and April in 2017, online questionnaires were released on the mainstream media platforms in China like Aidiaoyan (www.idiaoyan.com), Sina Weibo (www.weibo.com), Kaidi club (club.kdnet.net), and Tianya Forum (www.tianya.cn). The netizens responded to the survey voluntarily. Each round of the survey contains around fifty questions including demographic information, media use, psychological traits, social attitudes and political attitudes. Meanwhile, the survey also records the respondent’s IP address, as well as the start time and end time of filling in the questionnaire online, so that we can track the location of the respondent and the date of the answering day.
There are total of 10107 participants involved in the dataset, of which 62.4% are male. The respondents are relatively young groups (54.7% are aged under 40), with high level of education (72.3% hold degrees of or higher than Bachelor) and middle-level household income (50.6% have household income of 60k to 200k RMB)Footnote3. The occupational groups that account for the largest proportion are company employees (26.5%) and students (17.5%). Therefore, demographic information in our sample is also in line with the characteristics of Internet users in the contemporary media environment.
2.2. Measuring inattention
There are several methods for identifying the inattentive (or careless) respondents via the specific indicators obtained from their responses. Meade and Craig (Citation2012) discussed the usage of five indices in their paper: (1) special items designed to have obvious right answers; (2) the inconsistent index from the pair of similar questions; (3) multivariate outliers detection; (4) time to fill out the questionnaire; (5) self-reported authenticity in answering questions. Maniaci and Rogge (Citation2014) mainly introduced the infrequency scales and inconsistency scales to examine the inattentive responding, which are similar to the first and second indices listed above. The infrequency scales helps to detect the infrequent responding among highly skewed responses (e.g., ‘I have been to every country in the world’, that is almost unlikely to happen for respondents.). The inconsistency scales are built based on the inconsistent responses when people answer the similar questions.
2.3. Inconsistent index
Taking into account the characteristics of the existing surveys, we construct the inconsistent index based on the inconsistent responses from a series of identical questions presented in different ways. Among the three waves of the Netizen Ideology Survey, such questions are not always consistent within the year of 2014, 2015, and 2017.
We focus on the most representative pair of questions designed in both of 2015 and 2017 waves, that is ‘Our nation is insecure and chaotic, and there could be major disturbances at any time’. and ‘In spite of the challenges we are facing, our nation is still orderly and thriving as a whole’. Both questions are designed to reflect the sense of social security, with five points Likert scale ranging from strongly disagree, disagree, neutral, agree to strongly agree. As for that in 2014, the selected pair of questions are related to national satisfaction, that is ‘Do you trust our national leadership? (definitely don’t trust, rather don’t trust, rather trust, and definitely trust)’ and ‘What is your attitude at the future and destiny of our country? (very optimistic, rather optimistic, not optimistic, definitely optimistic)’.
We create the binary inconsistent index with the number equal to 1 representing that the participant holds different views on the same issue. To avoid over-evaluating the inconsistency, we do not distinguish the strength of the opinions, for example, strongly disagree and disagree are classified as the same attitude, and the thing is also the same to four-item scales of trust and optimism.Footnote4 In , it can be seen that, among 9474 observations, 28.1% of the responses are detected to be inattentive responding in our sample.
Table 1. Summary statistics.
2.4. Air pollution
We collect the air pollution data from the Chinese Ministry of Environmental Protection (MEP) which is responsible for disclosing the hourly concentration of six air pollutants from the monitoring sites at each city, including PM10 (), PM2.5 (
), CO (
), NO2 (
), and O3 (
). The disclosure of official air quality data in China has achieved a significant improvement since 2014. On the one hand, the data are pushed forward to cover more cities. By the end of 2014, a total of 189 cities had released their real-time ambient data, and the number increased to 366 in the year of 2015 and 2017.Footnote5 On the other hand, the accuracy of the data has been greatly enhanced. Stoerk (Citation2016) tested Chinese data against US Embassy data for consistency with Benford’s Law, and concluded that misreporting had likely ended after 2013.
It is our main interest to explore the possible link between air pollution and the inattentive behaviour of the participants in online surveys. Due to the disclosed IP address and responding time, air pollution data can be linked to the city where each user is located, as well as the current date (even hour).Footnote6 It is worth pointing out that there could exist the missing data of several remote cities for the lack of monitors in the early years, we replace with the data from the nearest neighbouring city whose data are available. Provided that the short-term effect of ambient pollutants on brain health could sustain for at least 24 hours, our air pollution data are integrated into the daily average at the city level, which is also consistent with the previous study like Chang et al. (Citation2019).
Among those six pollutants reported, we mainly focus on PM2.5, since the fine particle has a larger detrimental effect on brain function (Elder et al., Citation2006). Now our topic has been specific to explore the effect of PM2.5 on the inconsistent index we built based on the online survey. Other pollutants will also be included to conduct the joint estimation as the robustness check. The standard deviation of PM2.5 in is reported to be 29.9 which will be used as our estimation unit when we describe the effect size.
2.5. Weather
Weather is an obviously important factor in affecting the ability of sustained attention. In particular, the brainwork has been well documented to be more vulnerable in heat and cold scenarios (Yeganeh et al., Citation2018). Besides that, weather covariates are also a series of confounding parameters that affect the formation of air pollutants through the complex photochemical reactions, which could lead to the endogeneity of air pollution variable and the biased estimates if ignored in the regression. In order to alleviate the potential endogeneity, we attempt to include the comprehensive meteorological characteristics.
The meteorological data are collected from the National Oceanic and Atmospheric Administration (NOAA). Corresponding to the air pollutant, the hourly data are merged into daily average at the city level and connected to the inconsistent index of each respondent. The involved parameters include average temperature (C), humidity (%), precipitation (mm), wind speed (km/h), sea-level pressure (hPa) and cloud coverage. lists the summary statistics with the mean and standard deviation for each meteorological factor.
3. Methodology
In this paper, we attempt to explore the potential link between air pollution and people’s inattentive behaviour. Our analysis is placed in the scenario of web-based online surveys where the inconsistent index is constructed to proxy the inattentive and careless responses of the participants. We perform the estimation by regressing the inconsistent index on air pollution, especially PM2.5, as well as a series of controls.Footnote7
3.1. Probit model
In this paper, the probit model is mainly adopted to estimate the probability of inattentive behaviour in online surveys due to air pollution, which is one of the most common methods to deal with the discrete choices regression. We set up the model in the following form:
(1)
(1)
where the inconsistent index yict is the binary variable we construct, with 1 representing the existence of the inattentive responses for the respondent i in the city c at the date t, and 0 being normal. CPct stands for a variety of multi-pollutants such as CO, SO2, NO2, and O3. Wct denotes a set of weather covariates including temperature, humidity, precipitation, wind speed, sea-level pressure and cloud coverage. Di controls the respondent i’s demographic characteristics, like gender, age, education, income and jobs ().
Table 2. Demographic characteristics.
In addition, we also incorporate the city fixed effects λc in the regression, so as to control for the time-invariant characteristics across cities. νt represents the temporal controls, including year by month fixed effects and weekday dummies, which help to control for the seasonal patterns and daily changes across a week. ϵict is the error term. β is our main parameter of interest. The sign of the estimate is expected to be positive, indicating the effect of PM2.5 on respondents’ inattentive behaviours in online surveys.
3.2. Nonlinear effects
In the probit model discussed above, air pollution is involved in the linear form of daily average concentration at each city. However, people’s response to different levels of ambient pollutants could be uneven and more likely to increase at a diminishing rate due to the potential adaptability to the dirty air. With that in mind, we categorize the concentration of PM2.5 into five groups: (the reference group),
and
according to the Technical Regulation on Ambient Air Quality Index (on trial) (HJ 633-2012). Each group corresponds to the different levels of ambient pollution, and is converted from the relevant Air Quality Index (AQI).Footnote8 The five bins of PM2.5 will be introduced into the regression and replace the daily average. After transformed into the average marginal effect, each estimate could be interpreted as how much increase in the probability of inconsistent response when the participants are exposed to higher pollution levels than in clean weather with PM2.5 under 35
4. Results
4.1. Effect of PM2.5 on inattentive behaviour
presents the effect of PM2.5 on inattentive behaviour of the participants that is proxied by the inconsistent index. All the regressions are estimated by probit model introduced above, and the results reported have been transformed into the average marginal effects in the form of percentage. From left to right, additional controls are added to complete the model structure. Moreover, considering the existence of the heteroscedastic and autocorrelated problems in error terms, we also cluster the robust standard errors at the city level. It can be seen that all the estimates reveal the positive correlation between PM2.5 and inconsistent index, most of which are significant at 1% level.
Table 3. The effect of PM2.5 on inconsistent responses.
In column (1), city fixed effects are included in the basic regression and help to control for the unobserved time-invariant characteristics of each city, which might affect the citizensbehaviour and local pollution’ behaviour and local pollution level. In column (2), year by month fixed effects and weekday fixed effects are considered to control for the seasonal and periodic variations that are constant across individuals. As expected, time fixed effects play an important role in people’s attention ability. The outcome increases a bit in magnitude. Weather covariates in column (3) contain average temperature, average humidity (and their interaction term), wind speed, cloud coverage, sea-level pressure, and precipitation. Demographic characteristics in column (4) involve gender, age, education, household income, and jobs. From column (2) to column (4), the outcomes are quite robust in both magnitude and significance. Column (5) summarizes our preferred estimation under full controls with the inclusion of multi-pollutants (NO2, SO2, CO, and O3). The result can be explained that a one standard deviation increase in daily average PM2.5 will increase the probability of being inattentive by 2.25%.Footnote9
4.2. Nonlinear effect of PM2.5 on inattentive behaviour
In order to examine the nonlinear effect of air pollution on inattentive behaviours, we construct five bins for PM2.5 (with 40 as bin width) according to the guidance of the Technical Regulation HJ 633-2012, and implement the identical regressions as those for linear estimation. As shows, the same controls are added from left to right, and the estimates appear to be rather robust especially when models have enough controls. The most striking result to emerge from the outcomes is that the marginal effects have larger values in magnitude when exposed to a higher level of PM2.5 compared to the reference group with PM2.5 under 35
implying that people are more likely to be inattentive as air pollution worsens.
Table 4. The non-linear effects of PM2.5 on inconsistent responses.
To be more clear, plots the estimates and 95% confidence intervals according to the coefficients under full controls shown in column (5) of . Interestingly, people’s response to air quality increases quickly when exposed to low-to-medium levels of air pollution. According to the AQI categories shown in , a ‘Good’ day with PM2.5 between 36 and 75 leads to 2.97% increase in inconsistent responses. Moreover, a ‘Light Polluted’ day with PM2.5 between 76 and 115
leads to 6.21% increase in inconsistent responses. Until now, an approximate linear growth trend can be found when PM2.5 is less than 115
Subsequently, the growth rate of people’s response to air pollution begins to stabilize for their increased adaptability to dirty air, which is also consistent with the previous studies (Graff Zivin & Neidell, Citation2012; He et al., Citation2019; Qin & Zhu, Citation2018). A ‘Moderately Polluted’ day with PM2.5 ranging from 116 to 150
causes a growth of 7.42%, not much increase compared with the previous group. Notably, the curve also becomes flat between those two intervals.
Figure 1. The non-linear effects of PM2.5 on inconsistent index under full controls.
Notes: This graph displays the non-linear impacts of PM2.5 on people’s inconsistent responses compared to the reference group under full controls. PM2.5 is categorized into five groups: PM2.5 less than 35 (reference group), PM2.5
PM2.5
PM2.5
and PM2.5
The figure plots the estimates and their 95% confidence intervals according to the coefficients shown in column (5) of .
Source: estimated and made by authors.
![Figure 1. The non-linear effects of PM2.5 on inconsistent index under full controls.Notes: This graph displays the non-linear impacts of PM2.5 on people’s inconsistent responses compared to the reference group under full controls. PM2.5 is categorized into five groups: PM2.5 less than 35μg/m3 (reference group), PM2.5 ⊂(35,75], PM2.5 ⊂(75,115], PM2.5 ⊂(115,150], and PM2.5 ⊂(150,250]. The figure plots the estimates and their 95% confidence intervals according to the coefficients shown in column (5) of Table 4.Source: estimated and made by authors.](/cms/asset/5dda397c-7c42-437b-a267-a87314847e8b/rero_a_2094984_f0001_c.jpg)
Table 5. Air quality index.
Taken together, our results suggest a positive link between air pollution and people’s inattentive behaviours, as well as a diminishing increase rate of the effects under high-level polluted days with PM2.5 larger than 115 Since 96.76% of the days in our sample have PM2.5 less than 115
we will continue to estimate the effect of PM2.5 in linear form during the following analysis.
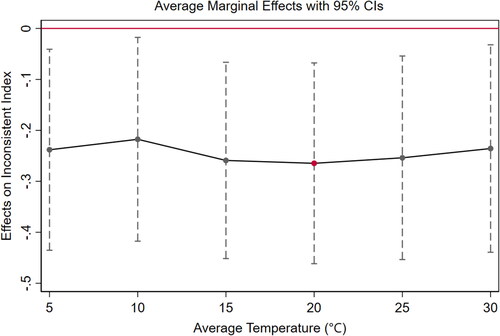
4.3. Effect of temperature on inattentive behaviour
Temperature is an essential factor that affects people’s brain function (Yeganeh et al., Citation2018). It has been demonstrated that hot (32.22C or above) and cold (10
C or less) temperature decreases the performance on a wide range of mental work like attention, perception and memory (Pilcher et al., Citation2002). Therefore, such results should be verified again in our research. Here, the analysis on temperature can also be seen as a supplement to confirm the validity of our construction of the inconsistent index. We categorized daily average temperature into seven bins (with 5
C as each bin width): less than 5
C (the reference group),
and above 30
C. presents the marginal effects of different temperatures on people’s inattentive behaviour, compared to that in the cold scenario under 5
C. Identically, the same additional controls are added from left to right as we did in previous tables. The estimates are quite robust in both magnitude and significance.
Table 6. The non-linear effects of temperature on inconsistent responses.
What is striking about the figures in this table is that all the estimates are negative in relatively large value, suggesting that temperature above 5C is much better for people to maintain sustained attention. In addition, the effects appear to be falling first and then rising. Correspondingly, depicts the non-linear estimates under full controls and their 95% confidence intervals according to the coefficients shown in column (5) of . The overall trend seems to be plausibly a U-shape pattern, in which the red dot around 20
C marks the temperature that has the least impact on the inconsistent index. It can be concluded that compared to the temperature under 5
C, temperature between 20
C to 25
C decreases the inattentive responses by 26.46%. The result we obtain is fairly consistent with that in the recent findings. The studies like Choi and Chun (Citation2009) and Lee et al. (Citation2012) have also shown that temperature controlled at 20
C to 25
C is conductive to exerting the better attention ability.
Figure 2. The non-linear effect of temperature on inconsistent responses under full controls.
Notes: This graph displays the non-linear impacts of average temperature on people’s inconsistent responses compared to the reference group under full controls. The average temperature is categorized into seven groups, with 5C as each of bin width and temperature less than 5
C as the reference group. The figure plots the estimates and their 95% confidence intervals according to the coefficients shown in column (5) of . The red dot in the figure marks the temperature that has the least impact on the inconsistent index.
Source: estimated and made by authors.
4.4. Various demographic characteristics and inattentive behaviour
Besides the external factors like air pollution and weather discussed above, the internal demographic characteristics could also affect the individual’s attention ability to a large extent. and 8 report the impacts of various demographic variables on inconsistent responses, like gender, age, education and income. All the estimates have been transformed into the marginal effects in percentage compared to the reference group. Correspondingly, plots four graphs one by one according to the estimates and their 95% confidence intervals reported in the tables.
Figure 3. The marginal effects of demographic characteristics on inconsistent response.
Source: estimated and made by authors.
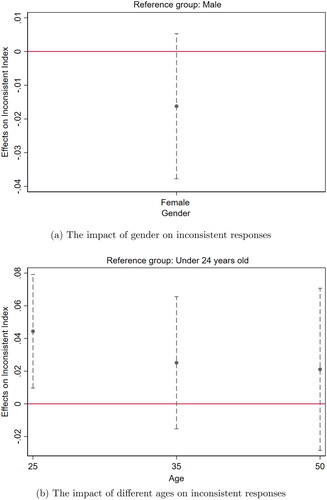
Table 7. The impact of various demographic characteristics on inconsistent responses.
4.4.1. Gender and age
As for gender, the female seem to be slightly better at concentration than the male, and the difference is 1.77% significant at 10% level reported in column (3) of without controlling for pollution. Besides, the more surprising result is reflected in the performance of different age groups. People aged from 25-34 appear to be the most inattentive, with 4.44% more inconsistent responses compared to the younger group under 25. The effects are statistically significant at 1% and robust under additional controls from column (1) to column (4). Young adults from 25-34 years of age are physically young and energetic, and less likely to have brain defects. The potential reason for their unsatisfactory performance on attention could be a problem with pressure from both work and life, which should be paid more attention to. Interestingly, as we continue to look down, although not significant, the performance of attention is numerically better when age increases shown in Panel (b) of .
4.4.2. Education
In regard to education, from the top to the bottom, different degree levels are listed from doctorate (the highest, reference group) to no formal education (the lowest). When looking down, the estimates show a plausibly increasing trend (see Panel (c) in ), implying that the participants with lower education levels are more likely to have inattentive responses. Junior college or higher secondary groups have a 7-8% higher probability of inconsistent responses than the doctorate group, and the elementary group is even higher with the number being around 20%.
4.4.3. Household earnings
continues to present the association between income and inconsistent responses, where household earnings are categorized into 11 groups from the lower one less than 5,000 RMB to the highest one above 2,000,000 RMB. From the data, it can be seen that there is no obvious trend as household income increases. However, for the upper class whose income is above 1,000,000 RMB, people are more likely to have better attention ability, and their probability of inconsistent responses has dropped drastically with around 10% decrease compared to the low-income class.
Table 8. (Continued) The impact of various demographic characteristics on inconsistent responses.
Together these results from education and income provide important insights into the link between attention ability and work performance. Our outcome indicates that people engaged in jobs that require a high level of education or high-paying jobs are more likely to have better attention ability. From another perspective, it is attention that helps them to have outstanding work performance on cognitive-demanding tasks, such as advanced learning, and high-productivity jobs corresponding to high income.
5. Heterogeneous effects
As discussed above, different demographic characteristics of respondents may show different levels of attentiveness. In this section, we further analyse whether the influence of air pollution on people’s inattentive behaviour will show heterogeneous changes under different demographic characteristics. –13 demonstrate the marginal effects of PM2.5 on inconsistent responses under full controls among the varying gender, age, education, household income and occupational groups.
Table 9. The effects of PM2.5 on inconsistent responses under different gender groups.
5.1. Heterogeneous effects of PM2.5 under different genders and ages
In , column (1) and column (2) conduct the regressions under female and male, respectively. Column (3) replicates the preferred result in column (5) of based on the whole sample. It seems that PM2.5 affects men more than women, with larger values in magnitude and significance. displays the effect of PM2.5 among groups with increasing average age. Given the limited subsample size at different ages, people in the higher group are added from left to right, so that the average age of the samples rises sequentially, in which we explore the impact of air pollution at different age levels. There is a plausibly decreasing trend in the estimates as the average age increases, suggesting that the attention ability of youth and young adult groups is most vulnerable to air pollution. A one standard deviation of PM2.5 increases the likelihood of inattentive responses by 4.05% among the youth aged of 18-24.
Table 10. The effect of PM2.5 on inconsistent responses among groups with increasing average age.
5.2. Heterogeneous effects of PM2.5 under different education levels
implements the similar regressions as above with decreasing level of education added from column (1) to column (5), so that the effect of PM2.5 could be studied among the various levels of education. It can be seen that higher education groups are more sensitive to air quality although they are less likely to have inattentive responses that have been discussed in the previous section. The estimate in column (1) indicates that a one standard deviation in PM2.5 increases the probability of inattentive responses by 3.46% among Bachelor, Master and Doctorate groups.
Table 11. The impact of PM2.5 on inconsistent responses among groups with decreasing average education levels.
5.3. Heterogeneous effects of PM2.5 under different income levels
The impacts of PM2.5 among different income groups are highlighted in . Column (1) runs the regression under the low-income group whose household earnings are less than 20,000. It can be seen that air pollution has the most significant impact on the lower-income people, that is a one standard deviation in PM2.5 increases the probability of inattentive responses by 6.11%, about three times the average. The middle class added in column (2) refers to the group between 20,000 to 100,000, and the upper-middle class in column (3) refers to be between 100,000 to 500,000, among which there is no significant difference found.
Table 12. The impact of PM2.5 on inconsistent responses among groups with increasing average household income.
5.4. Heterogeneous effects of PM2.5 under different jobs
In , we select four occupational subsamples (worker, employee in company, official and manager, and student) that have relatively large sizes, and conduct the individual regressions.Footnote10 Interestingly, students are observed to be the most vulnerable, among which the elevated air pollution in one standard deviation increases 5.36% probability of inattentive responses. Official and manager are also quite sensitive, with the number of 4.33%.
Table 13. The impact of PM2.5 on inconsistent responses among different occupational groups.
6. Robust tests
presents the alternative models to estimate the effect of air pollution on inattentive behaviours. Column (1) adopts the probit model in our main analysis and replicates the preferred outcome listed in column (5) of . Column (2) and column (3) re-run the identical regressions under the same full controls under the linear model and the logit model, respectively. The estimate in column (3) has also been adjusted into the marginal effects in the form of percentage, so that all the estimates now can be comparable in values. We find that the estimates remain quite robust across columns in both magnitude and significance.
Table 14. Alternative models to estimate the effect of air pollution on inconsistent responses.
Recall that the inattentive behaviours in our study are measured by the inconsistent responses existing in online surveys. In , we follow the introduction in Meade and Craig (Citation2012) and construct the alternative indices based on the characteristics of our existing sample. Column (1) reports our preferred way in which inconsistent index is used as a proxy for the inattentive or careless response, and the estimate reprints the outcome listed in column (5) of . Column (2) and column (3) construct the dummy index (with 1 being inattentive and o being normal) based on people’s responding time, where fill-in time exceeding one (or half) standard deviation above or below the mean is considered to be inattentive behaviour. Both estimates have been adjusted into the marginal effects in the form of percentage.
Table 15. Alternative ways to measure the inattentive behaviours.
Besides that, the last two columns further implement the estimations based on the self-report authenticity, which is measured on a scale of 1 (completely untrue) to 10 (completely true) in our sample. Column (4) incorporates the discrete self-report variables directly into the linear model. As expected, a significant negative effect is found between air pollution and self-report authenticity. We also construct the corresponding binary index with 1 being not completely true and 0 being completely true. Column (5) re-runs the probit model, and reports the marginal effect.
Overall, although the results vary a bit in magnitude across different measures, they all indicate a clear negative effect of air pollution on people’s attention.
7. Placebo tests
In this section, referring to Heyes and Zhu (Citation2019), we further conduct two placebo tests in by replacing our matched air pollution with other irrelevant data in time and space. Column (1) reprints the preferred estimate displayed in column (5) of . Column (2) re-runs the identical regressions under full controls based on the air pollution in reverse chronological order. Column (3) scrambles the air pollution data within our sample of cities in reverse-alphabetic order. Both of the results in column (2) and column (3) break down. It is apparent from the table that only properly correlated air pollution data in column (1) have a significant negative effect on the participants’ attention ability.
Table 16. Placebo tests.
8. Conclusion
Paying attention is one of the most important brain-based cognitive functions, and its disturbance has been correlated to a variety of problems in both work and life. To date, the detrimental effect of air pollution on brain health has been largely studied by way of experiments in Neuroscience. In this paper, we provide a novel way to explore the potential decrease in people’s attention due to the elevated air pollution by observing the inattentive responses in online surveys.
We follow the way in Maniaci and Rogge (Citation2014) and construct the inconsistent index to measure the inattentive behaviour of the participants in online surveys. The corresponding daily average air pollution is connected to each observation according to the disclosed IP address and the responding time. The estimated effect is substantial and robust under a set of controls. In our preferred specification, a one standard deviation of PM2.5 (around 30 ) increases the likelihood of inconsistency by 2.25%. Taking into account the heterogeneous effects of air quality, we further examine the regressions under different demographic levels. It seems that air pollution appears to have larger effects on those young groups with high education but low income, especially for students, and the number is 5.36%.
Exploring the polluted attention existing in online surveys is an important outcome in its own right, helping to enhance the reliability and statistical power, and also provides a mechanism to support the recent study about air pollution and productivity.
Disclosure statement
No potential conflict of interest was reported by the authors.
Additional information
Funding
Notes
1 Dr. Cory-Slechta is a well-known expert on neurotoxicology and psychology at the University of Rochester Medical School (URMC).
2 The detail description of the infrequency scales and the inconsistency scales will be explained in the following data section.
3 50.6% of the respondents have household income of $6,123.60 to $15,309.01 if converting Chinese Yuan to US Dollar.
4 Neutrality is a tricky issue, and the most direct way to deal with that is to ignore any potential inconsistency when people reply neutral, in which the effect of air pollution is estimated to be statistically significant. However, after our in-depth thinking about the question designed for the respondents in 2015 and 2017, neutrality in this case is viewed as a positive sense of social security.
As for the first question, the words of “chaotic”, “major disturbance” are strongly negative, which is in fact obviously inconsistent with the national conditions at that moment. If the respondents keep neutral and do not fully agree with it, they might think that there are some problems in the society, but it is less likely to fall into the extreme slumps, which just fits with the part of contents in another question. Therefore, neutrality can be seen as a positive attitude here. For the second question, the statement is positive. Neutrality to a positive question can also be considered as a positive attitude.
5 There were 1598 monitoring sites established by the end of 2017.
6 The IP address is an “identity card” obtained based on each computer’s network connection point. Querying the IP address allows us to effectively locate the user’s city.
7 All the data analysis and regressions are performed using Stata 16.0.
8 PM2.5 larger than 250 is ignored for the lack of enough data in our sample.
9 The effect size (2.25%) can be computed by multiplying the standard deviation of PM2.5 (29.9028 ) and the average marginal effect (0.0751%).
10 Worker includes the jobs in agriculture, forestry, animal husbandry, Fishery, and factory.
References
- Ao, C.-K., Dong, Y., & Kuo, P.-F. (2021). Industrialization, indoor and ambient air quality, and elderly mental health. China Economic Review, 69, 101676. https://doi.org/10.1016/j.chieco.2021.101676
- Balakrishnan, U., & Tsaneva, M. (2021). Air pollution and academic performance: Evidence from India. World Development, 146, 105553. https://doi.org/10.1016/j.worlddev.2021.105553
- Bowling, N. A., Huang, J. L., Bragg, C. B., Khazon, S., Liu, M., & Blackmore, C. E. (2016). Who cares and who is careless? Insufficient effort responding as a reflection of respondent personality. Journal of Personality and Social Psychology, 111(2), 218–229. https://doi.org/10.1037/pspp0000085
- Brühlmann, F., Petralito, S., Aeschbach, L. F., & Opwis, K. (2020). The quality of data collected online: An investigation of careless responding in a crowdsourced sample. Methods in Psychology, 2, 100022. https://doi.org/10.1016/j.metip.2020.100022
- Butcher, J. N. (2010). Minnesota multiphasic personality inventory. The Corsini Encyclopedia of Psychology, 1–3. https://doi.org/10.1002/9780470479216.corpsy0573
- Chang, T. Y., Graff Zivin, J., Gross, T., & Neidell, M. (2019). The effect of pollution on worker productivity: Evidence from call center workers in China. American Economic Journal: Applied Economics, 11(1), 151–172. https://doi.org/10.1257/app.20160436
- Cheung, J. H., Burns, D. K., Sinclair, R. R., & Sliter, M. (2017). Amazon Mechanical Turk in organizational psychology: An evaluation and practical recommendations. Journal of Business and Psychology, 32(4), 347–361. https://doi.org/10.1007/s10869-016-9458-5
- Choi, Y.-R., & Chun, C.-Y. (2009). The effect of indoor temperature on occupants’ attention abilities. In Proceeding of Spring/Autumn Annual Conference of KHA (pp. 199–203). The Korean Housing Association.
- Cobanoglu, C., Moreo, P. J., & Warde, B. (2001). A comparison of mail, fax and web-based survey methods. International Journal of Market Research, 43(4), 1–15. https://doi.org/10.1177/147078530104300401
- Curran, P. G. (2016). Methods for the detection of carelessly invalid responses in survey data. Journal of Experimental Social Psychology, 66, 4–19. https://doi.org/10.1016/j.jesp.2015.07.006
- Elder, A., Gelein, R., Silva, V., Feikert, T., Opanashuk, L., Carter, J., Potter, R., Maynard, A., Ito, Y., Finkelstein, J., & Oberdörster, G. (2006). Translocation of inhaled ultrafine manganese oxide particles to the central nervous system. Environmental Health Perspectives, 114(8), 1172–1178. https://doi.org/10.1289/ehp.9030
- Graff Zivin, J., & Neidell, M. (2012). The impact of pollution on worker productivity. The American Economic Review, 102(7), 3652–3673. https://doi.org/10.1257/aer.102.7.3652
- Grineski, S. E., Clark-Reyna, S. E., & Collins, T. W. (2016). School-based exposure to hazardous air pollutants and grade point average: A multi-level study. Environmental Research, 147, 164–171. https://doi.org/10.1016/j.envres.2016.02.004
- He, J., Liu, H., & Salvo, A. (2019). Severe air pollution and labor productivity: Evidence from industrial towns in China. American Economic Journal: Applied Economics, 11(1), 173–201. https://doi.org/10.1257/app.20170286
- Heyes, A., & Zhu, M. (2019). Air pollution as a cause of sleeplessness: Social media evidence from a panel of Chinese cities. Journal of Environmental Economics and Management, 98, 102247. https://doi.org/10.1016/j.jeem.2019.07.002
- Jew, K., Herr, D., Wong, C., Kennell, A., Morris-Schaffer, K., Oberdörster, G., O’Banion, M. K., Cory-Slechta, D. A., & Elder, A. (2019). Selective memory and behavioral alterations after ambient ultrafine particulate matter exposure in aged 3xTgAD Alzheimer’s disease mice. Particle and Fibre Toxicology, 16(1), 1–17. https://doi.org/10.1186/s12989-019-0323-3
- Kam, C. C. S., & Meyer, J. P. (2015). How careless responding and acquiescence response bias can influence construct dimensionality: The case of job satisfaction. Organizational Research Methods, 18(3), 512–541. https://doi.org/10.1177/1094428115571894
- Kilian, J., & Kitazawa, M. (2018). The emerging risk of exposure to air pollution on cognitive decline and Alzheimer’s disease-Evidence from epidemiological and animal studies. Biomedical Journal, 41(3), 141–162. https://doi.org/10.1016/j.bj.2018.06.001
- Lee, H., Choi, Y., & Chun, C. (2012). The effect of indoor air temperature on occupants’ attention ability based on the electroencephalogram analysis. In 10th International Conference on Healthy Buildings 2012 (pp. 2083–2088).
- Liu, M., Tan, R., & Zhang, B. (2021). The costs of “blue sky”: Environmental regulation, technology upgrading, and labor demand in China. Journal of Development Economics, 150, 102610. https://doi.org/10.1016/j.jdeveco.2020.102610
- Maniaci, M. R., & Rogge, R. D. (2014). Caring about carelessness: Participant inattention and its effects on research. Journal of Research in Personality, 48, 61–83. https://doi.org/10.1016/j.jrp.2013.09.008
- Meade, A. W., & Craig, S. B. (2012). Identifying careless responses in survey data. Psychological Methods, 17(3), 437–455. https://doi.org/10.1037/a0028085
- Morey, L. C., & Lowmaster, S. E. (2010). Personality assessment inventory. The Corsini Encyclopedia of Psychology, 1–4. https://doi.org/10.1002/9780470479216.corpsy0663
- Peeples, L. (2020). News Feature: How air pollution threatens brain health. Proceedings of the National Academy of Sciences of the United States of America, 117(25), 13856–13860. https://doi.org/10.1073/pnas.2008940117
- Pilcher, J. J., Nadler, E., & Busch, C. (2002). Effects of hot and cold temperature exposure on performance: A meta-analytic review. Ergonomics, 45(10), 682–698. https://doi.org/10.1080/00140130210158419
- Qin, Y., & Zhu, H. (2018). Run away? Air pollution and emigration interests in China. Journal of Population Economics, 31(1), 235–266. https://doi.org/10.1007/s00148-017-0653-0
- Rice, S., Winter, S. R., Doherty, S., & Milner, M. (2017). Advantages and disadvantages of using internet-based survey methods in aviation-related research. Journal of Aviation Technology and Engineering, 7(1), 5. https://doi.org/10.7771/2159-6670.1160
- Sager, L. (2019). Estimating the effect of air pollution on road safety using atmospheric temperature inversions. Journal of Environmental Economics and Management, 98, 102250. https://doi.org/10.1016/j.jeem.2019.102250
- Stoerk, T. (2016). Statistical corruption in Beijing’s air quality data has likely ended in 2012. Atmospheric Environment, 127, 365–371. https://doi.org/10.1016/j.atmosenv.2015.12.055
- Tuten, T. L., Urban, D. J., & Bosnjak, M. (2002). Internet surveys and data quality: A review. Online Social Sciences, 1, 7–26.
- Wan, Y., Li, Y., Liu, C., & Li, Z. (2020). Is traffic accident related to air pollution? A case report from an island of Taihu Lake, China. Atmospheric Pollution Research, 11(5), 1028–1033. https://doi.org/10.1016/j.apr.2020.02.018
- Yeganeh, A. J., Reichard, G., McCoy, A. P., Bulbul, T., & Jazizadeh, F. (2018). Correlation of ambient air temperature and cognitive performance: A systematic review and meta-analysis. Building and Environment, 143, 701–716. https://doi.org/10.1016/j.buildenv.2018.07.002
- Younan, D., Petkus, A. J., Widaman, K. F., Wang, X., Casanova, R., Espeland, M. A., Gatz, M., Henderson, V. W., Manson, J. E., Rapp, S. R., Sachs, B. C., Serre, M. L., Gaussoin, S. A., Barnard, R., Saldana, S., Vizuete, W., Beavers, D. P., Salinas, J. A., Chui, H. C., … Chen, J.-C. (2020). Particulate matter and episodic memory decline mediated by early neuroanatomic biomarkers of Alzheimer’s disease. Brain, 143(1), 289–302. https://doi.org/10.1093/brain/awz348
- Zhang, J. (2019). Cognitive functions of the brain: Perception, attention and memory. ArXiv, abs/1907.02863. https://doi.org/10.48550/arXiv.1907.02863