
 ?Mathematical formulae have been encoded as MathML and are displayed in this HTML version using MathJax in order to improve their display. Uncheck the box to turn MathJax off. This feature requires Javascript. Click on a formula to zoom.
Abstract
The paper examines the relationship between dependent variables (spending on social protection and spending on social protection benefits) and variables that capture the economic structure of the population and economic activity on the example of panel data of 26 European Union (EU) countries (except for Bulgaria and Croatia) over the years 2000-2017. In particular, the economic structure of the population is analysed by the age dependency ratio, while economic activity is expressed by the real GDP per capita growth rate and the unemployment rate. Regardless of the estimation technique for specifications with variables transformed to first differences, the results of the study indicate a statistically significant association between the dependent variables and the macroeconomic conditions of the EU countries. By contrast, the relationships between the dependency ratios and the dependent variables are positive but generally statistically insignificant, although EU countries are undergoing advanced processes of population ageing.
Introduction
The recent socio-economic structural trends, mainly including demographic changes, and economic fluctuations (due to the latest crises and recovery times), have affected the budget balances of many European Union countries considerably, mainly in the field related to social protection. In fact, spending on social protection represents the largest area of general government expenditure in the European Union (EU). For example, in 2001 (the earliest available data for the 28 EU-average), the share of COFOG (i.e., Classification of the Function of Government) spending on social protection in total spending was 38.1%, and 40.9% in 2017. If the COFOG data is presented as a per cent of GDP, that indicator rose from 17.2% in 2001 to 18.5% in 2017.
The importance of spending on social protection is a result of different phenomena that have affected the EU economies. One of them is the global financial and economic crisis from the beginning of the 21st century. Analysis of the statistical data for the crisis period suggests that the real GDP growth rate (based on data expressed in millions of euros, chain-linked volumes, 2010) in 2009 compared to 2008 was lower by 4.3% on EU-average. As emphasised by the European Commission (EC, Citation2009), among others, the EU countries responded to the crisis by implementing different social protection spending programs as part of their recovery programs. Moreover, the crisis changed policy orientations, expressed by, e.g., socialising the European Semester (see Zeitlin & Vanhercke, Citation2018). The observed economic trends have affected spending, especially in the area of protection spending related to the labour market and family support.
On the other hand, social spending, especially in the area of old age and health, is affected by the population’s age structure. The European Union’s population is getting older, and the process of ageing is very advanced. The Ageing Report (EC, Citation2017), which presents projections for all 28 EU countries (including the UK, and measuring the dependency ratio as the share of people under 14 and people over 65 with respect to the population aged 15-64), shows that in 2070, the dependency ratio will exceed 75% for 22 European Union countries, while in 2016, all 28 EU countries were below 60% (the calculated average was 53.5% for 2016). Similar trends were also emphasised by He et al. (Citation2016) – in 2015, the world’s 25 oldest countries included 20 EU countries, while projections for 2050 indicate 17 countries.
shows relationships between real spending on social protection benefits in million euro (in constant 2010 prices) and real GDP in million euro (in constant 2010 prices) on the left panel, and the relationship between the overall age dependency ratio and real spending on social protection benefits on the right panel. The picture presents average data for all 28 EU countries between 2008 and 2017 (the used time sample is due to the data availability for all EU countries).
Figure 1. Left panel: real GDP in million EUR (r_gdp) and real spending on social protection benefits (r_spb) in million EUR; Right panel: age dependency ratio (adr) and real spending on social protection benefits (r_spb) in million EUR; all data for 28 EU-average.
Source: own work based on Eurostat data
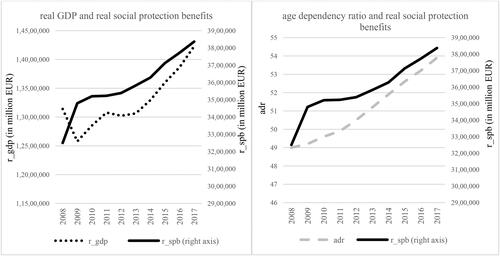
As shown, the decrease in real GDP in the period of the global financial crisis (i.e. 2008-2009) was associated with an increase in the social protection benefits. However, after 2013 both variables have rather increased over time. The comparison of the real spending on social protection benefits and the overall age dependency ratio exhibits growing trends of the variables. allows for concluding about the possibility of a positive relationship between real social protection spending and the age dependency ratio, while the relationship between real GDP and real spending seems to be unclear.
Taking the above into account, there is an interest in analysing what determinants – demographic or economic conditions – have been mainly responsible for shaping social protection spending in EU countries in recent years. The motivation is strengthened by the importance of population ageing and business cycle fluctuations for the area associated with social support. As a result, the goal of the paper is to compare the effects of the economic structure of the population and the effects of economic conditions on social protection spending.
The comparison of the effects involved by the economic structure of the population and the economic conditions of economies is the main contribution of the study, broadening the existing state of the art aimed at EU countries. Due to the overlapping determinants, recognising the importance of these two factors is valuable and is considered as an input to the literature review. The motivation is strengthened by the ambiguous results in the literature regarding the relationship between social spending and the dependency ratio, and the effects of selected economic determinants. The value added of this study is also expressed by the analysis of both types of factors on social spending and a set of robustness analyses, including the control variables for socio-economic, institutional and political determinants of social protection spending in the EU. That approach delivers a broader perspective for the importance of the core determinants of this spending and its comovements with the set of analysed variables. Moreover, the problem of social spending and its determinants is an important element of a public debate, especially in the context of ageing Europe and recent economic shocks and fluctuations in the EU. As a result, the study gives the contribution in comparing the importance of the impact of long-term demographic processes and short-term business cycle fluctuations on social-type spending. Taking into account the latest processes in the EU (two big recessions and the advancement of the population ageing) the relevance of the paper is emphasized by the juxtaposed set of determinants of social spending and evaluation of their relevance.
Taking into account the data availability, the time frame of the study covers annual data for the period 2000–2017, and the country sample includes 26 (out of 28, i.e., without Bulgaria and Croatia) European Union economies. The results of the study are valuable, as the paper compares the importance of selected factors that determine social spending in the EU over the first and second decades of the 21st century.
The rest of the paper is structured as follows. The next section presents a short literature review, narrowed to selected examples of studies that emphasise the effects of economic structure or economic conditions on the social-type spending. The next section provides details about the data and outlines the empirical approach used in the study. Subsequently, the results and estimates of the parameters for robustness checks are presented, and a discussion and the limitations of the study. The paper concludes with a short summary.
A brief literature review
The literature review supports the aim of the study and indicates that social spending is affected by economic activity and the structure of the population (e.g., Castles, Citation2001; Huber & Stephens, Citation2001; Kittel & Obinger, Citation2003).
Due to the demographic change, there is growing interest in explaining social spending through population ageing. In many works that phenomenon is captured by the age dependency ratio. For example, Bryant (Citation2003) and Disney (Citation2007) tested the impact of the age dependency ratio on welfare spending, pointing out that there was a net positive relationship between these two variables. Potrafke (Citation2009) and Tepe and Vanhuysse (Citation2009) emphasise the positive relationship between ageing (measured by the age dependency ratio) and welfare spending in OECD countries. In this context, the study by Busemeyer (Citation2009) who analysed a panel of 21 OECD countries between 1980 and 2004 by using specifications for public social spending as the dependent variable, with variables transformed to first differences, found a positive but not significant relationship between the change in the dependent variable and a change in the age dependency ratio. On the other hand, Razin et al. (Citation2002) found a negative relationship between the dependent variable, which was social transfers per capita, and the dependency ratio. These works suggest that the impact of the relationship between the dependency ratio and social-type spending may be ambiguous.
From the point of view of the population structure, the role of the elderly in explaining social spending was emphasised by, among others, Sanz and Velázquez (Citation2007), Cutright (Citation1965), Ahn and Lee (Citation2012) and Hong (Citation2014). These studies vary in terms of countries analysed and time frames. Sanz and Velázquez (Citation2007) pointed out that population ageing was the main driving force of the growth of government spending, followed by relative prices and population. Their conclusions were based on a panel of 26 OECD countries (i.e. OECD Member States except for Poland, Czechia, Hungary, and Slovakia) and data covering the period 1970–1997. Meanwhile, the results of Castles (Citation2009) study showed that population ageing generally increased old-age-related spending and decreased working-age-related spending.
In the literature, the relevance of the macroeconomic conditions seems to be more unambiguous in comparison with the role of demographic factors. The literature, to a large extent of studies, mainly delivered findings based on the effects of GDP, unemployment rate, trade openness or fiscal variables. For example, Busemeyer (Citation2009) in his study provided a set of estimations aimed at examining the relationship between social spending and globalisation. The study confirmed the negative relationship between trade openness and social-type spending for 21 OECD countries between 1980 and 2004. The estimated negative relation between social spending and trade openness was also obtained for example by Kaufman and Segura-Ubiergo (Citation2001) for Latin America. However, as emphasized by Heimberger (Citation2021), the use of the meta-analysis and meta-regression approaches did not provide strong findings of the unidirectional effects of economic globalization on government spending. In the study, the differences in obtained results were mainly explained by including the ‘efficiency’ hypothesis and the ‘compensation’ hypothesis of the effects of economic globalisation.
Kittel and Obinger (Citation2003) and Schuknecht and Zemanek (Citation2018) used GDP growth, unemployment, and variables related to population ageing as important determinants of social spending. In particular, Schuknecht and Zemanek (Citation2018) suggested reducing the explanatory variable (i.e., GDP growth rate) by the trend component to measure the relationship between social spending and GDP growth. Also, Busemeyer (Citation2009) in his study found a negative and statistically significant relationship between the change in social spending and the change in national income per capita, and positive and significant effects of change in the unemployment rate on change in the dependent variable on the example of a panel of OECD countries. Miyamoto and Yoshino (Citation2020) used local projections to state that the response of output to the government spending shock was positively affected in non-ageing economies, whereas the same analysis prepared for ageing economies showed that the response of output was not statistically significant.
The existing literature also deals with the analysis of determinants of social-type spending in the European Union or groups of selected European Union countries. In this context the results of Beblavý’s (Citation2011) study are interesting. Beblavý (Citation2011) analysed determinants of social protection spending in two groups of EU countries, ‘old’ and ‘new’. The study was based on a set of determinants, including income per capita, the old-age dependency ratio, the employment rate, the unemployment rate, and a variable capturing the risk of poverty before social transfers. The study indicated that the differences in the patterns of social protection spending in the group of ‘new’ and ‘old’ EU countries were not only due to structural factors but also policy choices. The welfare states of the ten ‘new’ European Union countries were generally much smaller than those in the Western ‘old’ European Union. Alsasua et al. (Citation2007) investigated the importance of selected explanatory variables (e.g., income per capita or variables that described the population structure) for the levels of social protection spending on the example of eleven EU countries. The time sample of the study covered the period between 1985 and 1999, i.e., before the largest enlargement of the European Union and before the official entry into force of the euro currency. However, the results were ambiguous, and they did not definitely confirm the convergence of social protection spending of the analysed countries in each of the considered subsamples.
Many studies considered the determinants or patterns of social spending in post-socialist (or post-communist) countries (e.g., Ko & Min, Citation2019; Emigh et al., Citation2018; Kuitto, Citation2018, Citation2016; Dixon & Macarov, Citation2016; Lendvai, Citation2008; Avelino et al., Citation2005). The aim of these works was particularly related to recognising the model of welfare states in these countries and analysing the differences in social needs in transition countries. For example, Beblavý (Citation2011) found that, in comparison to the Western EU countries, the new EU countries focused their welfare states more on the redistribution dimension to prevent poverty.
The presented short overview of the literature does not distinguish between the relevance of certain factors but rather analyses a set of variables and its relationship with social spending in general. Moreover, it rather focuses on general social spending. That is the main reason for which the presented paper aims at emphasizing the relevance of the effects of demographic factors and economic conditions on social protection, especially in the context of the European Union countries. This is expressed in the motivation of the study aimed at completing the observed literature gaps. The motivation is strengthened by the importance of population ageing and the effects of business cycle fluctuations for social support and, particularly, spending on social protection benefits.
Research methodology
Data
Data concerning dependent variables come from Eurostat. As mentioned, social spending is represented by two variables. First variable is the social protection benefits variable, expressed as a per cent of GDP (). This spending, according to the Eurostat definition, is understood as the transfer of benefits to households, in cash or in kind, aimed at relieving these households of the financial burden of several risks and needs. It denotes that this spending covers spending on disability, sickness, healthcare, old age, survivors, family and children, unemployment, housing, or social exclusion. The second variable is social protection spending as a per cent of GDP (
), which reflects the spending derived from COFOG. The variable includes social protection spending linked to sickness and disability, old age, survivors, family and children, unemployment, housing, general social protection, R&D related to this aggregated category, and social protection or social exclusion-type spending not classified elsewhere. Both variables –
and
– concern the level of general government.
Considering the short literature review, presented in the previous section, the following set of core variables and the set of the rest of the control variables have been chosen.
The impact of the population structure is highlighted by a set of variables that includes the age dependency ratio (), old-age dependency ratio (
), young-age dependency ratio (
), the proportion of the population aged 65 years and over in the total population (
), and the proportion of the population aged 0-14 in the total population (
). The age dependency ratio used in this study is a variable which denotes the ratio of the non-active population (aged 0-14, and 65 and more) to active population (i.e., aged 15-64).
The baseline macroeconomic condition is controlled by the real GDP per capita growth rate () and unemployment rate (
). The real GDP per capita growth rate is calculated using the GDP data for each country, expressed in millions of euros, where the base year is 2010. Next, the calculated real GDP data were divided by the average population of each country, and then the growth rates were calculated.
In order to capture the relationship between the dependent variables and the economic structure of the population, the analysed specifications are extended by the control variables. This set of variables is based on the literature review and refers to the macroeconomic conditions, demography, and fiscal position of each country, as well as the institutional conditions. Other variables included for controlling the impact of demography on spending concerns the average population (expressed as a natural logarithm of the average population, ), the average population growth rate (
), the fertility rate (
), and the crude birth rate (
). The data source for all demographic data is Eurostat.
The impact of economic conditions on social spending is also analysed by the trade openness as a percentage of GDP (), and by the natural logarithm of the real GDP per capita (
) that controls Wagner’s Law (1893), according to which, a country’s development has an impact on government spending. For example, Mohapatra et al. (Citation2022), based on the data covering the period from 1981 to 2018, investigated that income per capita, and population ageing, had a statistically significant and positive effect on per capita health care expenditure in India.
The fiscal variables are represented by the debt-to-GDP ratio () and a set of measures for budget balances. The data source for those variables is the AMECO database.
The institutional aspect is controlled by a dummy variable for elections (), where the value of 1 denotes a parliamentary election year, and 0 otherwise. The aim of this variable is to capture the impact of elections in each country on social spending. An additional dummy variable reflects the importance of left-wing parties (
), with a value of 1 for two situations – the dominance or the hegemony of social democracy and other left-wing parties, and 0 otherwise. The construction of that variable is based on Armingeon et al. (Citation2020) data. The variable
is aimed at covering the voter turnout in elections, and it is also derived from the same dataset.
The list of all variables and their descriptive statistics and data sources are presented in in the Appendix.
Method
Panel data constitutes the econometric approach used in this study. The original sample consists of 28 objects (countries, N) and 18 annual observations (T). In order to receive a balanced panel, only 26 out of the 28 EU countries (according to the structure of the EU in 2017) were considered, i.e., without Bulgaria and Croatia (due to the lack of all data). The time sample was restricted to the years 2000-2017, due to data availability for social protection benefits.
The general equation used in this study is as follows:
(1)
(1)
where
is dependent variable (i.e. analysed category of social protection spending),
is a vector of core control variables for population structure and main economic conditions,
is a vector of other control variables,
denotes country-specific effect,
denotes time-specific effects, and
is the error term. All variables and their data sources used in the model are presented in in the Appendix.
The baseline regression is built on the basis of a set of core variables which includes, among others, overall age dependency ratio, fertility rate, unemployment rate, real GDP per capita growth rate and the logarithm of the average population. It is due to the fact that these variables are common determinants of social-type spending emphasized in the literature (see: Neck & Schneider, Citation1988; Lybeck, Citation1988; Facchini, Citation2014, among others). It is expected a positive relationship between social-type spending and age dependency ratio, as well as social-type spending and unemployment rate or fertility rate, due to the effects of the number of unemployed and the number of people in non-working age on social spending. The signs for the relationships between real GDP per capita growth rate and dependent variables are expected to be negative due to the relevance of the economic conditions on social protection – the better times the lower social protection. The expected sign for the relationship between social spending and the average population is ambiguous, due to the ambiguous results of the previous studies, as was emphasised in the literature review. The baseline regression includes the logarithm of real GDP per capita which, consistently with Wagner’s Law (Wagner, Citation1893), emphasises the positive relationship between income and public spending. However, the literature review does not confirm an unambiguous result. In some studies the association is positive (e.g. Facchini & Melki, Citation2013; Jalles, Citation2019; Mohapatra et al., Citation2022) while in some – negative (e.g. Durevall & Henrekson, Citation2011). In order to evaluate the role of elections in shaping the size of social spending, the baseline equation also includes the dummy variable capturing the election years. The inclusion of that variable partially follows the theory of electoral rules (e.g. Shelton, Citation2007) and the expected sign for the relationship between spending on social protection and the dummy variable for the election years is positive.
Taking into account the sample, its length, the number of heterogeneous countries, and the potential problem with serial correlation in the specification, the decision was made to use Beck and Katz (Citation1995) panel-corrected standard errors procedure (PCSE) as a baseline estimation technique. The panel-corrected standard errors (Beck & Katz, Citation1995) allows incorporating the violations of assumptions due to the existence of panel heteroskedasticity (because each country may have its own error variance), contemporaneous correlation of the errors, as well as serially correlated errors (because of the errors for a given country may be correlated with previous errors for that country). Considering the possibility of that violations in the sample of analysed 26 EU countries, the used PCSE incorporates the serial correlation with the correlation parameter unique for each panel and the heteroscedasticity across the panels. As mentioned, that method allows overriding the assumption of homoskedasticity, the lack of autocorrelation of the random component and the lack of correlation of the random component between units. The robustness of the main estimator is checked by Parks (Citation1967) feasible generalised least squares estimator – FGLS (see also Davidson & McKinnon, Citation1993; Greene, Citation2012). The empirical part of the study also includes alternative analyses of the robustness checks for the baseline specifications and estimation techniques. The additional robustness check is based on the use of the fixed effects model approach that incorporates the Driscoll and Kraay (Citation1998) standard errors and is robust to serial correlation, groupwise heteroskedasticity, and cross-sectional dependence (SCC). Finally, the fixed effect model with cluster option is also used (FE) in order to control the problem of autocorrelation and groupwise heteroskedasticity. However, the proposed use of panel corrected standard errors approach, as a baseline method, emphasizes that standard errors estimates are robust to disturbances heteroscedastic, contemporaneously cross-sectionally correlated, and autocorrelated of a specific type of autoregressive (AREquation(1)(1)
(1) ) structure. The accuracy of the method was examined by Beck and Katz (Citation1995) in their leading paper. Moreover, in each mentioned specification, the time effects are incorporated.
Results of the study and robustness checks
Firstly, the unit root was tested. The Im et al. (Citation2003) test was applied to the variables presented in in the Appendix. Considering the time series for individual countries, the test with a trend was chosen. The Im-Pesaran-Shin (IPS) (2003) test relaxes the assumption of a common autoregressive parameter and instead allows each panel to have its own. The null hypothesis of the test is that all panels have a unit root, while the alternative hypothesis is that the proportion of tested panels that are stationary is nonzero.
The test and its statistics indicated that one should not reject the null in the case of most variables presented in levels (see p-values shown in in Appendix). As a result, the data in the first differences were tested. Generally, the results for first differences indicated that the null for most variables should be rejected, regardless of the variables which capture the age structure of the population, for which the test failed to reject the null. As a result, these two variables were excluded from further analysis, since the specifications were built with variables transformed to first differences. The exclusion of these variables is unfavourable because they were initially chosen as variables reflecting the structure of the population.
Next, the specifications were built. The estimates for the baseline specification using the PCSE and the results for robustness checks are presented in and . The correlation matrix for variables included in the baseline specification is presented in in Appendix. Moreover, in Appendix presents selected descriptive statistics for the first differences of variables used in baseline specification.
Table 1. Results of the regressions, baseline PCSE technique and robustness checks, specifications with the age dependency ratio.
Table 2. Results of the regressions, baseline PCSE technique and robustness checks, specifications with the old-age dependency ratio and the young-age dependency ratio.
Each of the presented in and specifications includes time-specific effects, but they are not reported. The baseline set of variables (transformed to first differences) is comprised of the unemployment rate, real GDP per capita growth, the logarithm of real GDP per capita, the logarithm of average population, the fertility rate, a dummy for election years, and the age dependency ratio () or the young- and old-age dependency ratio ().
The proposed use of the fixed effects approach in robustness checks was confirmed by the data. As shown in in Appendix, the Breusch and Pagan Lagrangian multiplier test for random effects indicates that the random effects method is more adequate than the model without any individual effects. But, the results of the Hausman test indicate that fixed effects are more appropriate than random effects. But due to the need to control problems with heteroskedasticity and the autocorrelation, the estimates were based on the use of the fixed effects model with estimates of standard error robust to disturbances heteroscedastic and autocorrelated.
These approaches emphasise the positive relationship between the age dependency ratio and both dependent variables; nevertheless, the relationship is generally not statistically significant. The social protection benefits variable does constitute a significant relationship, although, in the case of social protection spending, it is not statistically significant, regardless of the method. The use of the old-age dependency ratio and the young-age dependency ratio instead of the dependency ratio (compare and ) generally implies similar results – the relationship between changes in the dependent variables and changes in these two variables is statistically insignificant. However, the effects of these two variables on social protection spending are positive. Generally, the results presented in and demonstrate a statistically insignificant relation between both categories of social protection spending and indicators of the economic structure of the population. It holds true across all regression techniques, but it should be emphasised that the variables in the specifications are transformed to first differences.
The macroeconomic conditions are mainly captured by the unemployment rate and the real GDP per capita growth. Regardless of the estimation method, the statistical significance for the relationships between both variables that capture economic activity and the dependent variables is obtained. The coefficients for the relationship between social spending and unemployment rate are higher in the case of spending on social protection, regardless of the method used and despite the use of specifications with the age dependency ratio or specifications with both the old-age dependency ratio and the young-age dependency ratio.
The estimated coefficients for the real GDP per capita growth rate represent a stronger relationship with social protection benefits than social protection, regardless of whether the economic structure of the population is controlled by the age dependency ratio or the old- and young-age dependency ratios. However, shows that the fixed effects method allows for the relationship between the real GDP per capita growth rate and social protection spending, which proved not to be significant. Results presented in and suggest that, if statistically significant, the estimated effect of real GDP per capita growth rate on analysed spending ranges between −0.05 and −0.04 indicating that the increase in the change of real GDP per capita growth rate, ceteris paribus, reduces the change of the ratio of social type spending to GDP by around −0.05 on average.
The estimates obtained by the use of the applied FE approach and the fixed effects model approach that incorporates the Driscoll and Kraay (Citation1998) standard errors are nearly the same, the differences mainly refer to the standard errors.
The relationships between the other control variables and the spending presented in the baseline specification in and are generally consistent with the initial assumptions. Income significantly determines spending. Meanwhile, the fertility rate positively influences spending, but taking into account the baseline specifications, it is generally not significant. However, the impact of the average population is ambiguous and depends on the method used. The institutional aspect in the specifications presented in and is controlled by the dummy variable for elections. As shown, the relationship is positive but, taking into account the transformation of dependent variables and a set of other control variables, the relationship is not significant for specifications with social protection spending as the dependent variable.
The additional specifications presented in the Appendix aim to check the robustness of the impact of dependency ratios, and macroeconomic conditions captured by the real GDP per capita growth rate and unemployment rate. The presented specifications include trade openness to control the internalisation and the crude birth rate instead of the fertility rate to control births. The specifications also include a set of selected fiscal variables to emphasise the importance of the conditions of public finances on social spending. The specifications include time effects, as in the baseline specifications, and, in order to compare the results within estimation techniques, the PCSE method and fixed effects approach are used.
As previously presented for the baseline specifications, a positive relationship between social dependent variables and age dependency ratio is estimated. If it is statistically significant, the relationship concerns the social protection benefits rather than general COFOG social protection spending. The results presented in the Appendix emphasize that the estimated statistically significant effect of age dependency ratio on dependent variables is about 0.1-0.2 denoting that the change in the ratio of non-working population to working fraction of the population increases the change in the ratio of spending of social-type function with respect to GDP by about 0.1-0.2 on average. As in the baseline estimation, the unemployment rate and real GDP per capita growth rate are significantly related to social spending. Thus, the relationship between this spending and the state of the economy is confirmed.
Taking into account the set of additional control variables, the results are as follows. The change in population growth rate is generally not statistically significantly related to changes in the dependent variables; thus, this variable has been excluded from the rest of the analysis. The relationship between change in trade openness and the change in dependent variables is negative and generally statistically significant. Moreover, the impact is robust to estimation methods and a set of other control variables. The estimated coefficient is nearly −0.01, but it is slightly higher in the case of the specifications with social protection spending as the dependent variable. Generally, the magnitude of these estimated coefficients is low but statistically significant. The relationship between crude birth rate and social spending is positive, and the estimated coefficient ranges between 0.2 and 0.3, depending on the set of variables used in the specifications. However, the impact is not significant when the economic structure of the population is analysed using the old-age dependency ratio and young-age dependency ratio rather than the general age dependency ratio.
The inclusion of fiscal variables indicates the negative effects of variables that capture the budget balance (taking into account the data over the analysed period, the EU generally experienced deficits). The relationship between these variables and social spending is statistically significant, and the effects of the primary balance are higher than the effects of the cyclically-adjusted primary balance. Considering the results for debt, the change in debt affects the change in spending positively, but not significantly. Moreover, the resulting relationship is robust in the context of analysed specifications and used methods.
The additional estimates for the variables that control the institutional aspects, presented in show a not statistically significant impact of the controls used. For example, the dummy variable for election years generally emphasises that social protection spending in election years is higher, although the applied regression techniques do not confirm that the relationship is always significant. The same conclusion can be formulated for the dummy variable for left-wing governments – the more left-wing the government, the higher the spending. However, taking into consideration the transformation of the variables to first differences, the relationship is not significant. Finally, the voter turnout variable exhibits a negative and insignificant relationship with social protection spending regardless the used specification.
The variables of interest to us and the other controls, in general, behave as expected. A change in the variable (the proxy of national income per capita) and the change in social spending are in a negative relationship, so an increase in income causes a decrease in social spending. On the one hand, that effect might be considered to represent the anti-cyclical pattern of spending, but on the other hand, it reflects that higher income results in a reduction in spending on social programs.
Discussion
The objective of this study is to empirically evaluate the importance of economic and demographic determinants of social protection spending in the European Union. The basic idea is to address the justification for the dependency ratios and economic growth rate and unemployment rate. After analysing a set of regressions and robustness checks, the obtained results do not indicate the statistically significant impact of the population’s economic structure on social spending, even though the EU is experiencing ageing. However, the relationship is generally positive, regardless of the estimation technique or the specification with the age dependency ratio or the separate indicators for old- and young- dependency ratios to control the ageing. When examining the impact of the condition of the economies (using proxy variables for economic activity, i.e., unemployment rate and the real GDP per capita growth rate), the results are statistically significant, and, as expected, the unemployment rate and social spending exhibit a positive and significant relationship, while the real GDP per capita growth rate has a negative effect on social spending. The worse the macroeconomic condition, the higher the social protection, which is consistent with the importance of social programs.
Discussing, in the context of literature review, the impact of other control variables, the results for the relationship between trade openness and social-type spending are similar to relations obtained e.g. by Busemeyer (Citation2009) for OECD countries. The obtained results are also in line with the findings presented by Heimberger (Citation2021). As he pointed out, the use of the meta-regression and the meta-analysis approaches allowed for concluding about the small-to-moderate negative effects of globalization on social spending. As investigated by Heimberger (Citation2021), in the case of social spending the ‘efficiency’ hypothesis prevails over the ‘compensation’ hypothesis, emphasizing that economic globalization causes a negative small-to-moderate effect on social spending. Taking into account the fiscal variables, negative effects were found by, e.g., Savage (Citation2019) for the relationship between change in social expenditure and deficit level for a panel of 23 OECD countries over the years 1981-2012. While the obtained results for debt are robust, but opposite to the findings of, e.g., Kittel and Obinger (Citation2003), who found a negative association. In the case of variables controlling institutional determinants, the positive relationship between dependent variables and the left-wing governments is supported by Huber et al. (Citation1993), Kittel and Obinger (Citation2003), Busemeyer (Citation2007), and Potrafke (2009), among others. Thus, left-wing governments may be more willing to pay for social programs than right-wing governments. The results are also in line with Sirén's (Citation2021) study based on non-OECD democracies. Sirén (Citation2021) pointed out that the effects of the shifts towards left party government on total public social spending were positive and robust. The observed effects were also obtained when controlling for structural and institutional factors.
The voter turnout variable exhibits a negative and insignificant relationship with social protection spending, which is partially in line with the discussion presented in Haelg et al. (Citation2020), who emphasised the ambiguous relationship.
One explanation that may affect the relationship between social spending and the variables that capture the economic structure of the population is the transformation of the data to first differences (due to the results of the stationarity test). Another explanation can be formulated regarding the heterogeneity of the European Union countries, which differ not only from the point of view of population age-structure but also social programs and policy responses. For example, Portugal, Greece, Italy, and Spain are often treated as a homogeneous group that exhibits a particular ‘Southern Problem’ when implementing social policy (Hartlapp & Leiber, Citation2010). Moreover, Spasova and Ward (Citation2019) emphasise that the scale of spending on social protection varies considerably across the EU.
One of the limitation of the study is related to the time sample. The results may be influenced by the relatively short time sample of the data. More recent data, especially those available for the COVID-19 pandemic period, might have affected the results. The time frame of the study includes the crisis period, which seriously affected GDP growth, spending, fiscal balances, and debt in the European Union. In the analysed specifications, the variables that capture the age-structure of the population are omitted due to the results of the stationarity test for first differences. As the EU countries are heterogeneous, analysing the situation in individual countries may be valuable and is proposed for further research. The extensions may also focus on the institutional aspects and its impact on social protection tendencies, especially by the evaluation of the importance of the left- or right-wing governments to social policy implementation or the evaluation of the relationships with other political variables. The proposed extension may also be aimed at analysing the relationship between ageing and less aggregated social protection data. These areas of further extensions are strongly recommended in the light of the results of this study.
Another possible direction of research may focus on the use of alternative estimation techniques emphasizing the heterogeneous nature of the panel. The interesting approach will be also to examine the short-run and long-run relationships between dependent variables and the set of control variables. It also requires the use of alternative estimation techniques.
The aim of the study is important in the context of the ageing Europe and for policy implications. Taking into account the results, social protection benefits were significantly related with economic conditions rather than demography, so it generally implies that spending works as social buffer preventing changes in income. The obtained relationship expresses that protection systems of the EU countries adapted the economic fluctuations, which may work by the automatic stabilizers, e.g. in the form of unemployment benefits. The nonsignificant relation of dependency ratios and spending may be a result of a heterogeneity of European countries with respect to domestic social policies. The ambiguous results are emphasized in the literature, and may consist of a starting point for further research and extensions. Despite this, the positive impact of dependency ratios indicate the need to handle ageing and its impact on spending and public finance. The problem is important across Europe. Ageing Europe, smaller workforce, higher dependency ratio affect the pressure on social spending and public budgets, demanding discussion about the substantial reforms of social protection systems of the EU countries and its importance for sustainability of public finances.
Conclusions
The population of the European Union is getting older, which affects social protection spending. These countries have also experienced more or less symmetric shocks, which influenced the paths of the economic trends and business cycle fluctuations, which also influenced social supports. As a result, the aim of the paper was to examine the relationship between social protection spending and variables that capture the effects of population ageing and the effects of the economic behaviour and fluctuations of European economies.
Taking into account the results of the study, regardless of the dependent variable used (e.g., social protection spending or social protection benefits), there is a statistically significant relationship between the economic determinants and spending. The age structure of the population (analysed using the age dependency ratio or the old- and young-age dependency ratios) is positively associated with such spending, but the relationship is generally not significant. The results were obtained through the use of panel data for 26 European Union countries and, due to data availability, the time frame covering the years 2000-2017. The baseline specification and the robustness checks were provided for variables transformed to first differences. Based on these results, the condition of the economy significantly affected social spending, even when all variables were transformed to first differences. The results may be affected by the sample, heterogeneity of the countries, transformation of the variables, employed methods. The literature review presents ambiguous results for the relationship between social protection spending and the age dependency ratio. Due to these ambiguous results, further empirical exploration of the relationship is suggested. Nevertheless, taking into account the specifications, the techniques employed, and the time frame, the results show that over the last twenty years, the change in social protection spending was more significantly affected by changes in economic conditions than changes in age dependency ratio. Regardless of the mentioned limitations of the study, the obtained results suggest that social protection benefits analysed were more significantly related to the economic conditions rather than demography, so it generally implies that the spending may work as a social buffer preventing changes in income. It is also confirmed by data analysis indicating the increase of expenditures on social protection in the EU in recent years. Thus, the results may indicate the potential importance of that spending in mitigating the negative effects of short-term economic fluctuations. Especially, it is confirmed by the positive effects of unemployment that may denote the importance of automatic stabilizers. It may suggest that the EU countries adjusted the protection systems to the economic fluctuations,
Considering the above, the results contribute to the literature by delivering findings related to the effects of dependency ratio and effects of economic conditions on social-type spending. The main findings may support the debates on the use of that spending to mitigate economic fluctuations and the impact of that spending on the sustainability of public finances, including the wider context of ageing of the EU population. These aspects are important for policy makers and consist an element of the development strategies of many countries.
It is worth noting that in this study only the direct effects were analysed, without providing detailed consideration of their spillover effects. These aspects may be treated as a limitation of the study. Thus, there appears to be an additional area for further research and extensions. The extensions may also include the alternative estimation techniques based on the recognition between long-run and short-run relationships and the use of alternative estimation techniques adjusted for heterogeneous panels.
In light of this study, it seems that the results obtained may contribute to the debate on the observed escalation of social spending in the EU countries in recent years. It also raises questions about the effects of institutional aspects (e.g. the impact of elections, among others) on the evolution of these expenditures. Considering the importance of social-type spending in the total structure of spending of the general government in the EU countries, the issues concerning the determinants of social support seem to be very up to date and require further and in-depth analyses.
Acknowledgments
The author is grateful to anonymous Reviewers for their comments and remarks that improved the quality of the paper.
Disclosure statement
No potential conflict of interest was reported by the author.
Additional information
Funding
References
- Ahn, S. H., & Lee, S. S. Y. (2012). Explaining Korean welfare state development with new empirical data and methods. Asian Social Work and Policy Review, 6(2), 67–85. https://doi.org/10.1111/j.1753-1411.2012.00063.x
- Alsasua, J., Bilbao‐Ubillos, J., & Olaskoaga, J. (2007). The EU integration process and the convergence of social protection benefits at national level. International Journal of Social Welfare, 16(4), 297–306. https://doi.org/10.1111/j.1468-2397.2007.00483.x
- Armingeon, K., Wenger, V., Wiedemeier, F., Isler, C., Knöpfel, L., Weisstanner, D., & Engler, S. (2020). Comparative political data set 1960–2018. Institute of Political Science, University of Zurich.
- Avelino, G., Brown, D. S., & Hunter, W. (2005). The effects of capital mobility, trade openness, and democracy on social spending in Latin America, 1980–1999. American Journal of Political Science, 49(3), 625–641. https://doi.org/10.2307/3647736
- Beblavý, M. (2011). Comparative analysis of determinants and effects of social protection spending in the new EU member states. In P. Saunders. & R. Sainsbury (Eds.), Social security, poverty and social exclusion in rich and poorer countries (pp. 113–132). Intersentia Publishing.
- Beck, N. L., & Katz, J. N. (1995). What to do (and not to do) with time-series cross-section data. American Political Science Review, 89(3), 634–647. https://doi.org/10.2307/2082979
- Bryant, J. (2003). Modelling the effect of population ageing on government social expenditures. Treasury Working Paper Series 03/15, New Zealand Treasury.
- Busemeyer, M. R. (2009). From myth to reality: Globalisation and public spending in OECD countries revisited. European Journal of Political Research, 48(4), 455–482. https://doi.org/10.1111/j.1475-6765.2009.00838.x
- Busemeyer, M. R. (2007). Determinants of public education spending in 21 OECD democracies, 1980–2001. Journal of European Public Policy, 14(4), 582–610. https://doi.org/10.1080/13501760701314417
- Castles, F. G. (2001). On the political economy of recent public sector development. Journal of European Social Policy, 11(3), 195–211. https://doi.org/10.1177/095892870101100301
- Castles, F. G. (2009). What welfare states do: A disaggregated expenditure approach. Journal of Social Policy, 38(1), 45–62. https://doi.org/10.1017/S0047279408002547
- Cutright, P. (1965). Political structure, economic development, and national social security programs. American Journal of Sociology, 70(5), 537–550. https://doi.org/10.1086/223930
- Davidson, R., & McKinnon, J. G. (1993). Estimation and inference in econometrics. Oxford University Press.
- Disney, R. (2007). Population ageing and the size of the welfare state: Is there a puzzle to explain? European Journal of Political Economy, 23(2), 542–553. https://doi.org/10.1016/j.ejpoleco.2006.02.005
- Dixon, J., & Macarov, D. (Eds). (2016). Social welfare in socialist countries. Routledge.
- Driscoll, J., & Kraay, A. (1998). Consistent covariance matrix estimation with spatial dependent data. Review of Economics and Statistics, 80(4), 549–560. https://doi.org/10.1162/003465398557825
- Durevall, D., & Henrekson, M. (2011). The futile quest for a grand explanation of long-run government expenditure. Journal of Public Economics, 95(7–8), 708–722. https://doi.org/10.1016/j.jpubeco.2011.02.004
- EC. (2009). Economic crisis in Europe: causes, consequences and responses. European Economy, report no. 7/2009.
- EC. (2017). The 2018 ageing report. Underlying assumptions & projection methodologies. European Commission, Institutional Paper 065, November 2017.
- Emigh, R. J., Feliciano, C., O’Malley, C., & Cook-Martín, D. (2018). The effect of state transfers on poverty in post-socialist Eastern Europe. Social Indicators Research, 138(2), 545–574. https://doi.org/10.1007/s11205-017-1660-y
- Facchini, F. (2014). The determinants of public spending: A survey in a methodological perspective. MPRA Paper no. 53006.
- Facchini, F., & Melki, M. (2013). Efficient government size: France in the 20th century. European Journal of Political Economy, 31, 1–14. https://doi.org/10.1016/j.ejpoleco.2013.03.002
- Greene, W. H. (2012). Econometric analysis. 7th ed. Prentice Hall.
- Haelg, F., Potrafke, N., & Sturm, J. E. (2020). Determinants of social expenditure in OECD countries. KOF Working Papers, 475. https://doi.org/10.3929/ethz-b-000407604
- Hartlapp, M., & Leiber, S. (2010). The implementation of EU social policy: The ‘Southern Problem’ revisited. Journal of European Public Policy, 17(4), 468–486. https://doi.org/10.1080/13501761003673443
- He, W., Goodkind, D., & Kowal, P. R. (2016). An aging world: 2015. International Population Reports. Report no. P95/16-1. U.S. Government Printing Office, Washington DC.
- Heimberger, P. (2021). Does economic globalization affect government spending? A meta-analysis. Public Choice, 187(3-4), 349–374. https://doi.org/10.1007/s11127-020-00784-8
- Hong, I. (2014). Trends and determinants of social expenditure in Korea, Japan and Taiwan. Social Policy & Administration, 48(6), 647–665. https://doi.org/10.1111/spol.12089
- Huber, E., Rueschemeyer, D., & Stephens, J. D. (1993). The impact of economic development on democracy. Journal of Economic Perspectives, 7(3), 71–86.
- Huber, E., & Stephens, J. D. (2001). Development and crisis of the welfare state: Parties and policies in global markets. University of Chicago Press.
- Im, K. S., Pesaran, M. H., & Shin, Y. (2003). Testing for unit roots in heterogeneous panels. Journal of Econometrics, 115(1), 53–74. https://doi.org/10.1016/S0304-4076(03)00092-7
- Jalles, J. (2019). Wagner’s law and governments’ functions: Granularity matters. Journal of Economic Studies, 46(2), 446–466. https://doi.org/10.1108/JES-02-2018-0049
- Kaufman, R. R., & Segura-Ubiergo, A. (2001). Globalization, domestic politics, and social spending in Latin America: A time-series cross-section analysis. World Politics, 53(4), 553–597. https://doi.org/10.1353/wp.2001.0016
- Kittel, B., & Obinger, H. (2003). Political parties, institutions, and the dynamics of social expenditure in times of austerity. Journal of European Public Policy, 10(1), 20–45. https://doi.org/10.1080/1350176032000046912
- Ko, H., & Min, K. (2019). Determinants of social expenditures in post-socialist countries. Economics & Sociology, 12(2), 253–264. https://doi.org/10.14254/2071-789X.2019/12-2/15
- Kuitto, K. (2016). Post-communist welfare states in European context: Patterns of welfare policies in Central and Eastern Europe. Edward Elgar Publishing.
- Kuitto, K. (2018). Measuring welfare entitlement generosity in transitional welfare states: The case of post-communist countries in central and Eastern Europe. Social Indicators Research, 136(1), 203–224. https://doi.org/10.1007/s11205-016-1520-1
- Lendvai, N. (2008). EU integration and the transformation of post‐communist welfare: Traversing a ‘quantum leap’? Social Policy & Administration, 42(5), 504–523. https://doi.org/10.1111/j.1467-9515.2008.00616.x
- Lybeck, J. A. (1988). Comparing government growth rates: The non-institutional vs. the institutional approach. In J.A. Lybeck, M. Henrekson (Eds.), Explaining the growth of government (pp. 29–47). Elsevier Science Publishers B.V.
- Miyamoto, H., & Yoshino, N. (2020). A note on population aging and effectiveness of fiscal policy. Macroeconomic Dynamics, 1–11. https://doi.org/10.1017/S1365100520000607
- Mohapatra, G., Arora, R., & Giri, A. K. (2022). Establishing the relationship between population aging and health care expenditure in India. Journal of Economic and Administrative Sciences. https://doi.org/10.1108/JEAS-08-2021-0144
- Neck, R., & Schneider, F. (1988). The growth of the public sector in Australia: An exploratory analysis. In J.A. Lybeck, M. Henrekson (Eds.), Explaining the growth of government (pp. 231–263). Elsevier Science Publishers B.V.
- Parks, R. W. (1967). Efficient estimation of a system of regression equations when disturbances are both serially and contemporaneously correlated. Journal of the American Statistical Association, 62(318), 500–509. https://doi.org/10.1080/01621459.1967.10482923
- Potrafke, N. (2009). Did globalization restrict partisan politics? An empirical evaluation of social expenditures in a panel of OECD countries. Public Choice, 140(1–2), 105–124. https://doi.org/10.1007/s11127-009-9414-2
- Razin, A., Sadka, E., & Swagel, P. (2002). The ageing population and the size of the welfare state. Journal of Political Economy, 110(4), 900–918. https://doi.org/10.1086/340780
- Sanz, I., & Velázquez, F. J. (2007). The role of ageing in the growth of government and social welfare spending in the OECD. European Journal of Political Economy, 23(4), 917–931. https://doi.org/10.1016/j.ejpoleco.2007.01.003
- Savage, L. (2019). The politics of social spending after the great recession: The return of partisan policy making. Governance, 32(1), 123–141. https://doi.org/10.1111/gove.12354
- Schuknecht, L., & Zemanek, H. (2018). Social dominance. CESifo Working Paper 6894.
- Shelton, C. A. (2007). The Size and Composition of Government Expenditure. Journal of Public Economics, 91(11–12), 2230–2260. https://doi.org/10.1016/j.jpubeco.2007.01.003
- Sirén, S. (2021). Is there anything Left? The politics of social spending in new democracies. Governance, 34(1), 67–86. https://doi.org/10.1111/gove.12466
- Spasova, S., & Ward, T. (2019). Social protection expenditure and its financing in Europe. A study of national policies. 2019. ESPN.
- Tepe, M., & Vanhuysse, P. (2009). Are aging OECD welfare states on the path to gerontocracy? Evidence from 18 democracies, 1980–2002. Journal of Public Policy, 29(1), 1–28. https://doi.org/10.1017/S0143814X0900097X
- Wagner, A. (1893). Grundlegung der politischen oekonomie. Winter’sche Verlagshand-lung.
- Zeitlin, J., & Vanhercke, B. (2018). Socializing the European Semester: EU social and economic policy co-ordination in crisis and beyond. Journal of European Public Policy, 25(2), 149–174. https://doi.org/10.1080/13501763.2017.1363269
Appendix
Table A1. Descriptive statistics and data sources.
Table A2. Im-Pesaran-Shin unit root test (with a trend, p-value in parentheses).
Table A3. Correlation matrix for variables in baseline specification.
Table A4. Descriptive statistics – first differenced variables in baseline specification.
Table A5. Diagnostic tests.
Table A6.1. Robustness checks, results for and
specifications with the age dependency ratio, N = 468.
Table A6.2. (continuation) Robustness checks, results for and
specifications with the age dependency ratio, N = 468.
Table A7.1. Robustness checks, results for and
specifications with the old-age dependency ratio and the young-age dependency ratio, N = 468.
Table A7.2. (continuation) Robustness checks, results for and
specifications with the old-age dependency ratio and the young-age dependency ratio, N = 468.
Table A8. Robustness checks, results for and
specifications with the age dependency ratio and institutional controls, N = 468.
Table A9. Robustness checks, results for and
specifications with the old-age dependency ratio and the young-age dependency ratio and institutional controls, N = 468.