
 ?Mathematical formulae have been encoded as MathML and are displayed in this HTML version using MathJax in order to improve their display. Uncheck the box to turn MathJax off. This feature requires Javascript. Click on a formula to zoom.
Abstract
Against the backdrop of urban sustainable development around the world, how to coordinate both economic growth and ecological benefits in urban space becomes an important problem. Therefore, this study simulated and predicted the spatiotemporal changes in urban economy and ecosystem service value (E.S.V.) equivalent ratio under the current policies by 2030, and analysed how adjusting planning policies influences economy and ecology. This process was based on the future land use simulation (F.L.U.S.) model of coupled neural network, and on methods assessing the spatial changes in ecosystem services and land economy. This study aims to analyse urban land economy and E.S.V., and assess how China’s land spatial planning guides and promotes high-quality urban economic development. Results show that artificial intelligence (A.I.) simulation can forecast the results of spatial planning policies of national lands, to make policy-making more forward-looking. The guidance of planning policies on urban expansion accelerates the increase in economic value of urban residential and commercial lands, thereby promoting the economic growth. However, adjusted planning policies may lead to ecological destruction. So, this study provides model verifications and path guidance to realise coordinated sustainable development between economy and ecology, serving as an important reference to formulating proper policies for urban development.
1. Introduction
In recent decades, average urban expansion worldwide was much faster than population growth. Global Gross Domestic Product (G.D.P.) increased from 25,000 billion dollars in 1995 to 75,000 billion dollars in 2015. With the increase in incomes, people’s survival space kept expanding, resulting in faster urban expansion and other severe problems (Liu & Meng, Citation2020). Disordered urban development has caused serious damages to urban–rural ecological environment, causing 24,200 billion dollars of net loss of ecological service value (Sannigrahi et al., Citation2018). Policies on urban space development witnessed significant changes – policies based on economic growth and fast urban population growth caused irreversible negative impacts on ecosystems in most cities (Bayulken & Huisingh, Citation2015). Natural resource consumption due to global urbanisation becomes the main cause of the rising carbon emission and global warming. Global warming, in turn, brings profound changes to the production and lifestyle of human beings, and brings more economic and social problems (Baranova & Meadows, Citation2017; Gino, Citation2020). As the major location of human activities, cities produce 80% of the total global carbon emissions (Martos et al., Citation2016). Hence, how to coordinate economic growth and ecological benefits in urban space becomes an important world concern in carbon emission reduction. In accordance with sustainability standards, urban planning policies should be foresighted and helpful to realise regional and urban economic growth. Urban managers and planners should evaluate the outcomes of strategies via analysis and prediction tools before making relevant decisions (Martos et al., Citation2016). China, the largest developing country in the world, has gradually upgraded the industrial structure and urbanisation process, and its economy has developed rapidly due to its massive labor force and its active participation in the world trade system. Behind the remarkable performance of China in urbanisation and economic development, land use transformation under the pressure of fast urbanisation has also caused many negative impacts on local ecosystem and environment, and intensified the contradiction between economic development and ecological protection (Chen et al., Citation2021a; Han et al., Citation2021; Seto et al., Citation2011).
In response to the various ills caused by excessive urban expansion, ‘Theory of Organic Decentralisation’ proposed by Eliel Saarinen provides a healthy and orderly development model for the development of large cities. The ‘Growth Pole Theory’ proposed by Francois Perroux in 1950 has made important contributions to the development of regional urban agglomerations However, the theory unexpectedly causes negative effects on middle and small-sized cities in regions with closed geographic spaces. To offset this gap and pursue rapid economic development, some cities rely more on unsustainable resources, resulting in soaring economic indexes yet sharply dropping ecological and social indexes. It caused resource supply shortage, intensified environmental pollution and ecosystem imbalance, directly influenced the investment environment and sustainable development (Cristina et al., Citation2020). In 2017, the Chinese government proposed a high-quality development strategy, and viewed green development as an important symbol of transition from speed-oriented to high-quality economic development. In 2020, the Chinese government formulated some environmental regulation policies to control urban carbon emissions and protect the environment, and the goal of carbon peak in 2030 and carbon neutralisation before 2060 (Liu et al., Citation2021). However, due to the great differences in economic fundamentals, industrial structure, and natural resource endowment among cities in China, the environmental regulation policies promote the high-quality development of economically developed cities or regions, but fail to do so to underdeveloped ones that rely heavily on unsustainable resources due to the closed geographic spaces (Liu et al., Citation2021). The transformation of energy use and the restoration of ecosystems in such cities are difficult, and the space for urban development is limited (Streimikiene et al., Citation2021; Yu et al., Citation2020). They cannot rely on the external effects of growth-pole cities, nor walk on the same path of developed cities. The only way is to pave a new path that focuses on the coordinated development of economy and ecology. Hence, proposing new urban development policies based on assessing the advantages and disadvantages of existing policies to realise win–win outcome of economic growth and ecological benefits, can help balance the high-quality spatial development layout in China and provide references to transforming into resource-based cities.
When great changes occur in urban environments, assessing the effect of current planning policies can help us judge whether the development mode keeps up with the new trend and highlights the policy deficiencies. However, such review can only provide empirical lessons, but cannot predict the future situations scientifically or guide cities toward a new development stage. With the development of artificial intelligence (A.I.) simulation, many urban space development simulation models can predict the future situations, evaluate the effect of planning, and provide references to policymaking. Understanding, analysing, monitoring, modeling, and making policies on changes in urban land use through intelligent spatial simulation model, and adopting policy for guidance, fall into the category of planning and design in the economic field (Josip et al., Citation2021; Liu & Wang, Citation2016).
We believe that for middle and small-sized cities, planning policies and high-quality economic development have the following problems:
After adjusting planning policies, how exactly does urban land use influence land economic development?
Under such policies, can both economic and ecologic benefits be achieved to realise coordinated development?
What evaluation and guidance does current macroscopic development policies provide for high-quality economic development by simulating the future urban ecological structure?
Against the backdrop of national land spatial planning in China, this study discusses how urbanisation drives high-quality economic development based on A.I. algorithm and intelligent spatial simulation model.
The contributions of this study are as follows:
This study evaluated the coordinated development between urban economy and ecology from the perspective of land economy. Land is an important material basis of economic growth, and tapping into the value of land resources can effectively support economic growth. Existing studies usually measure urban economic growth from G.D.P. or industrial structure, but do not reflect the influences of urban planning policies on economy and ecology. Meanwhile, such policies are crucial to economic development and ecological protection by regulating land use. Land trade volume and unit transaction price can reflect the economic value of industries relying on land resources, and local economic development.
The effect of urban planning policies as well as investment and development choices can be assessed by predicting the action mechanism and economic benefits of future urban development on ecosystem services. It can help urban planners and managers make better decisions. This study hopes to offer reference to planning policies to better serve economy and ecology, and provide methods for China’s national land spatial planning.
To sum up, this study chose Yanji City as the case, to solve the above practical problems in urban development. For that, the results of coordinated development between economy and ecology were evaluated scientifically, to anticipate the future spatiotemporal changes in urban economy and ecology, and figure out how adjusted planning policies affect economy and ecology.
2. Status quo
In view of basic model, many scholars have constructed multiple simulation modes to describe the dynamic changes in cities since the twentieth century. The cellular automaton (C.A.) model is widely applied in simulating urban expansion, because it is simpler than the traditional complicated mathematical equation and produces more direct outcomes (Wagner & Vries, Citation2019). Liu et al. (Citation2017) proposed a F.L.U.S. model and simulated the variation trend of future land use changes under multiple situations based on C.A. model. However, none of these studies fully considers the influence of adjusting development policies on economy and ecology. The F.L.U.S. model proposed by Liu et al. (Citation2017) can predict the action mechanism and economic benefits of future urban development on ecosystem services. It is simple in algorithm, easy to operate, high in practicability, thus more suitable to serve as the fundamental model of this study.
In terms of practical application, as urbanisation picks up speed, there are more and more studies on urban economic development and ecological protection. Changes in urban land value represent the capital flow conditions. Land development is an important means for local government to fund economic development rather than a passive consequence of urbanisation. It determines the economic welfare of cities, and is of great significance to studying urban economic development (Wu et al., Citation2019). Yang et al. (Citation2020) analysed the influence of rapid land expansion on residential land value in Wuhan via geographical weighted regression (G.W.R.) model. Wang et al. (Citation2021) investigated the data on housing price and land use in 30 municipalities directly under the Central Government and provincial capitals from 2007 to 2017, and found that limited increase of housing price can lift land use efficiency. Based on the panel data of 285 prefecture-level cities in China from 2000 to 2018, Zhang and Qi (Citation2021) used a fixed effect model to analyse the impact mechanism of urban economic development. Results showed that in cities with a weak industrial base and poor high-speed rail conditions, sound transportation infrastructure could significantly improve the level of urban economic development. It is therefore crucial to ensure the efficient operation of transport infrastructure, but the COVID-19 has had a serious impact on it. Chen et al. (Citation2021b) used logistic regression and path analysis to analyse the operational status of 1,329 enterprises in Hangzhou under the influence of COVID-19, and found that the spread of COVID-19 curbed the operational efficiency of transportation infrastructure. This hindered the continuity of the manufacturer's business, led to a gap in the capital chain, and slowed down economic development. In general, the growth of urban land value is driven by the following four aspects: (1) higher productivity, (2) improved social, economic, and environmental quality, and more complete traffic and other infrastructures, (3) bigger investment in land during urban construction and (4) market supply of lands cannot keep up with the ever-growing population’s urban land demand (Albouy et al., Citation2018; Han et al., Citation2017; Jones & Reed, Citation2018). On the other hand, E.S.V. is an important bridge that connects the ecological environment and human activities. Human activity is a prerequisite of economic growth, but it also influences ecosystem through land use changes, resulting in E.S.V. loss in adjustment, supply, and culture (Chen & Li, Citation2020; Maria et al., Citation2016). Therefore, simulating the influence of urban land use changes in E.S.V. is of great significance to promoting regional sustainable development and improving the living environmental quality in cities. Currently, scholars have investigated the influence of urban expansion on E.S.V. in different scales. In the global scale, Nelson et al. (Citation2010) found that urban expansion is the major cause of reduced available environments for the survival of species and reduced carbon reserves. In the national scale, Xing et al. (Citation2021) have quantified the effects of neighboring urbanisation on local E.S.V. in terms of the spatial interactions of urbanisation process. In the regional scale, Delphin et al. (Citation2016) simulated the influence of urban expansion on E.S.V. related to downstream rural areas and forests of the Suwanee River, and discovered that carbon reserves and timber volume both decreased. It reduced renewable energy sources such as biomass from land use (Kolovos et al., Citation2011). Existing studies mainly focus on the correlation between land use changes and ecosystem, but rarely on the relationship between economy and ecology. So, the results are less valuable as a practical reference for governments to formulate land use plans.
Current studies mainly focus on the influencing mechanism of land economic development on urbanisation. Few explore the influencing mechanism of urbanisation on land economy, or how to make macroscopic policies more forward-looking in terms of economic and ecological benefits. We still lack experience in how land economy and regions drive economic growth by regulating urbanisation via macroscopic policies, and how to promote the comprehensive competitiveness of cities based on protecting the ecological environment. Given this, this study measured urban economic growths before and after adjusting planning policies based on land value changes, with focus on residential land, commercial land, and industrial land. In doing so, this study explored the influence of urban land use development on land value and capital flows based on how urbanisation promotes land economy. Then, a comparative study on urban E.S.V. equivalent ratio before and after adjusting planning policies was conducted, to assess the outcomes of urban high-quality development. Last, the action mechanism and economic benefits of future urban development on ecosystem services were predicted via the F.L.U.S. model.
3. Research methodologies
3.1. Spatial variation assessment of land economy
Based on distinguishing land use types, the study area was divided by administrative divisions from the perspective of land transaction price. Three indexes were used to measure the influence of the adjusting planning policies on economic development during urban expansion.
Transaction price changes of a land use type in Zone
(1)
(1)
where
is the transaction price in Zone
after adjusting planning policies.
is the transaction price in Zone
before adjusting planning policies.
reflects the capital flows of the land use type, can reflect the spatial pattern changes of the economic growth priority, and help us understand the key development areas of economic policies.
Changes in the proportion of trading volume of a land use type in Zone
in the total trading volume.
(2)
(2)
where
is the total trading volume of urban land after adjusting planning policies.
is the total trading volume of urban land before adjusting planning policies.
represents the changes in development intensity of this land use type after adjusting planning policies, and helps us understand the capital distributions of different land use types during urban development.
Changes in land transaction price per square meter of a land use type in Zone d.
(3)
(3)
where
is the transfer area of this land use type in Zone d after adjusting planning policies.
is the transfer area of this land use type in Zone d before adjusting planning policies.
is the economic value of this land use type and can reflect the economic benefits produced by it during urban development.
The above three indexes were visualised on ArcGIS, and the influence of the adjusted planning policies on urban land economic was assessed, to analyse the spatial correlation between urban expansion mode and urban economic development.
3.2. Assessment methods of ecosystem services
A quantification method was adopted to evaluate ecosystem services, to compare the changes in ecosystem services in Yanji City before and after adjusting planning policies, and make absolute quantisation more stable and less sensitive to market influences. In detail, ecosystem services were first divided into nine types according to the study area and the results of Chinese and overseas studies. Next, data was normalised to eliminate the influence of different units and calculation methods. The provided services were clear because cultivated land is interfered the most by human activities. Hence, ecosystem services of the cultivated land were chosen as the relative reference standards. The weights of different ecosystem services were determined with references to the ‘Unit Area Ecological Service Equivalent Ratio Table of Ecosystem in China’ formulated by Gaodi Xie. Last, the E.S.V.s of different land use types were calculated. The relative E.S.V. was multiplied with the corresponding weights to obtain the unit area equivalent ratios of nine ecosystem services corresponding to each land use type ().
Table 1. E.S.V. equivalent ratios of different land use types.
3.3. F.L.U.S. model
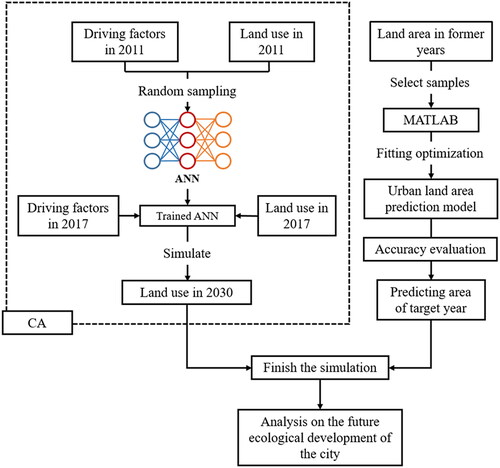
This study used the F.L.U.S. model with C.A. as the simulation platform. The simulation process is shown in .
Figure 1. Simulation framework of urban expansion based on the F.L.U.S. model.
Source: The authors.
The C.A. model is composed of four parts – cell, state, neighborhood, and transfer function. In C.A., the space is separated into regular cells, and each specific cellular state is determined by a group of predefined transfer rules in accordance with the previous cell state and state of surrounding cells (Li et al., Citation2017; Zhao & Peng, Citation2010). The basic operation rule of C.A. is:
(4)
(4)
where
represent the state of cell
at moment t + 1 and
is the spatial development state of neighborhood of this cell at moment t. Con is the total constraint in the transfer process. f is the transfer function.
A transfer rule is the core of C.A. model and directly influences the accuracy and efficiency of the simulation. Because the artificial neural network (A.N.N.) is advantageous in learning and fitting the complicated relations between input and output data through considerable trainings (Maaref & Elahmar, Citation2019), able to capture nonlinear and complicated features during modelling, to get relatively accurate results (Grekousis, Citation2019). The complicated and diversified natural geological conditions in the study area have potential influences on urban development (Seto et al., Citation2011). Hence, an A.N.N. composed of an input layer, a hidden layer, and an output layer was chosen as the transfer rule of C.A. ().
Figure 2. Basic structure of A.N.N.
Source: The authors.
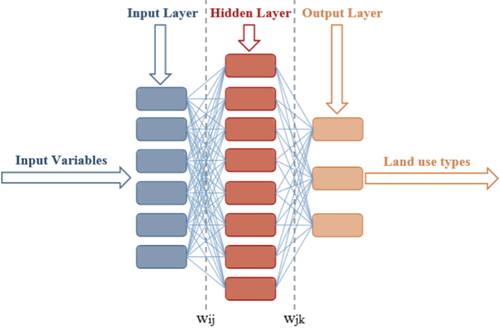
The transfer probability of the output layer after normalising the input variables is expressed as:
(5)
(5)
where
is the probability of cell
on land use type k at moment t.
is the signal received by neuron
in the hidden layer.
is a parameter and the weight between the hidden layer and output layer.
3.4. Study area and data processing
3.4.1. Study area
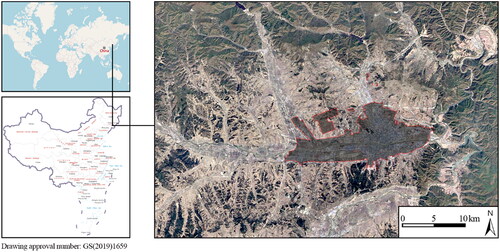
Yanji () is a typical city with important ecological functions and rapid urbanisation. It belongs to a subhumid climate region of middle temperate zone, located in Jilin Province, Northeast China (129°01′–129°48′ E, 42°50′–43°23′ N), in the hinterland of Northeast Asia economic circle. Its economic and ecological background is as follows:
Figure 3. Locations of the study area.
Source: The authors.
The social and economic development of Yanji is relatively slow in China, and the industrial structure lagging behind. In 2019, the registered population of Yanji was 553,000, and its G.D.P. 4.7 billion dollars, with a per capita G.D.P. of 8514.7 dollars, which is below the national average level (10,426.7 dollars). Imports and exports amounted to 123 million dollars, a decrease of 7.1% from last year. The tobacco product industry is the main factor supporting the city's economic development, and its G.D.P. added value accounts for 84.1% of the city's industrial G.D.P. added value above designated size.
The central urban area of Yanji is located in a basin valley. The adjacent Yanbian Forest Zone is an important forest ecosystem in China with abundant wild animals and plants. The forest area is dominated by broad-leaved Korean pine forests, evergreen all year round with great potential for carbon sink development. Endangered wild animals such as sables, northeast leopards, and oriental white storks can be seen all year round. It is an area that needs to be protected in the process of urban development.
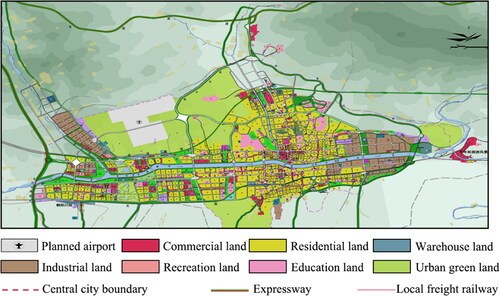
The development strategy of ‘Optimising in east, expanding in west, controlling in south, and extending in north’ was determined by the Yanji Municipal Government in the overall central city plan for 2009–2030, and later adjusted in 2016 (). The west regions of Yanji are the key areas for future development, where land capital flow reflects the economic development of the city. Hence, studying how to coordinate the expansion of similar cities under objective restraints is crucial to achieve economic and ecological profits, and it can provide ideas on how to formulate planning policies and realise high-quality urban development.
Figure 4. Overall plan of the central urban area of Yanji City from 2016 to 2030.
Source: Yanji People's Government (http://www.yanji.gov.cn/sq_2473/fzgh/).
3.4.2. Data source and processing
The data sources are listed in . Geometric accurate precision of remote sensing images was conducted on the basis of the map of Yanji City. Urban form was extracted, and the projection coordinate system was unified as G.C.S. W.G.S. 1984. The land use areas in different years were acquired through overlapping analysis and spatial analysis on ArcGIS. Land use in 2011 and 2017 and the distance from each point to each driving factor facility were extracted. Last, the data needed by C.A. was resampled into the spatial resolution of 30 m × 30 m, which was proven to be more accurate (Pijanowski et al., Citation2014), to obtain the urban forms in 2011 and 2017, to initiate simulation by F.L.U.S. model.
Table 2. Data sources.
Land use types in 2016 were missing, so the 2015 map published by Chinese Academy of Sciences, and the 2010 and 2020 maps published by Ministry of Natural Resources were used, with remote sensing satellite images as basic data to assess ecological services.
4. Results and discussions
4.1. Calibration and assessment of F.L.U.S. model
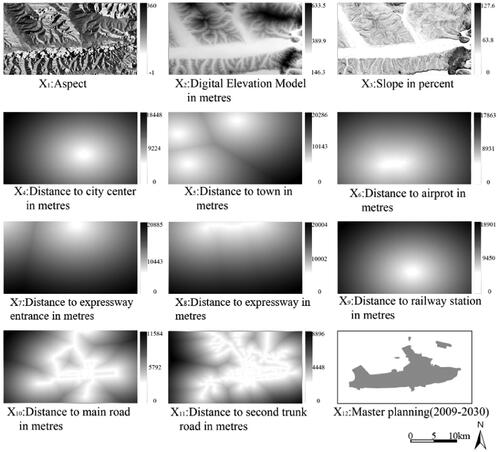
Twelve driving factors, including terrain, elevation, slope, urban infrastructure construction, and urban overall plan, were chosen to simulate urban morphological expansion from 2011 to 2017 (). Considering the requirements on planning design scale and accuracy of study area, a 3 × 3 Moore-type neighborhood was chosen to simulate the urban land use changes. In the F.L.U.S. model, the area of urban land use was predicted via trend extrapolation. The fitting equation was obtained via the least square on M.A.T.L.A.B., with of 0.992. After 300 iterative simulation trainings, the A.N.N.-C.A. model simulated the urban form in 2017, with
as 0.175,
coefficient as 0.774, and overall accuracy as 0.914. The simulation is high in accuracy and suitable for prediction.
Figure 5. Spatial driving factors of urban expansion in 2011.
Source: The authors.
4.2. Spatial variation pattern of land economy
From 2011 to 2020, the total land transfer area in Yanji City was 3.753 million m with total trading volume of 0.56 billion dollars. The total land transfer area of residential, commercial, and industrial land was 3.28 million m
accounting for 87.5% of the total transfer area. The total trading volume of the three land use types was 0.48 billion dollars, accounting for 86.1% of the total trading volume. Considerable land transfer areas before and after adjusting planning policies were found. In a word, the transaction conditions of residential, commercial, and industrial land were chosen, and the three indicators in subsection 3.1 were applied to measure the spatial change pattern of land economy, due to their representativeness, for this study.
The administrative division of Yanji City is shown in . The spatial variation of the three indexes of land economic development in Yanji is depicted in . No land transaction of H. N. Block is found in the study area, so the numerical values of all indexes remain unchanged.
Figure 6. Administrative division of Yanji City.
Source: The authors.
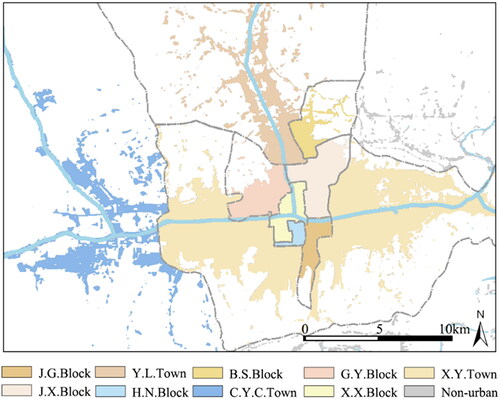
Figure 7. Spatial changes in land economy before and after policy adjustment.
Source: The authors.
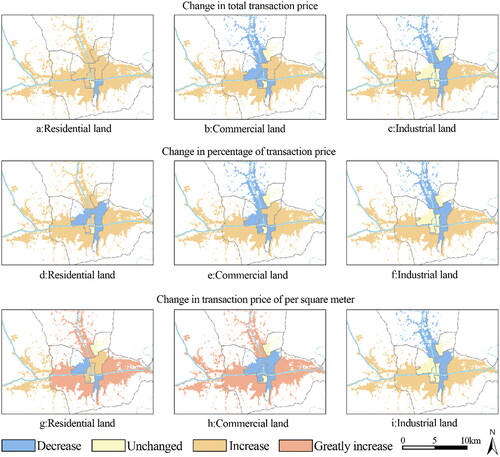
As shown in , the
value of residential land increased by 0.18 billion dollars after adjusting planning policies, 2.5 times of that before adjusting. However, the
value of residential land on the J. G. Block declined, and that of commercial land decreased by 11.6 million dollars. Specifically, the
value of commercial lands in C. Y. C. Town, X. Y. Town and J. X. Block increased, whereas that of commercial lands in Y. L. Town, G. Y. Block, J. G. Block, and X. X. Block declined. In addition, the
value of commercial lands in B. S. Block remained the same. On the other hand, the
value of industrial lands in C. Y. C. Town and X. Y. Town increased, whereas that of industrial lands in Y. L. Town, J. G. Block, and J. X. Block decreased, and that of industrial lands in B. S. Block, G. Y. Block, and X. X. Block remained unchanged. Net capital inflows of lands were found in C. Y. C. Town and X. Y. Town, and net capital outflows of lands were found in J. G. Block after the policy adjustment.
As shown in , the
value of residential lands in C. Y. C. Town, X. Y. Town, Y. L. Town, B. S. Block and X. X. Block increased, whereas that of residential lands in G. Y. Block, J. X. Block and J. G. Block dropped after the policy adjustment. For commercial lands, the
value in C. Y. C. Town, X. Y. Town and J. X. Block increased, whereas that decreased in Y. L. Town, G. Y. Block, X. X. Block and J. G. Block. The
value of commercial lands in B. S. Block remained the same. For industrial lands, the
value in C. Y. C. Town and X. Y. Town increased, whereas it declined or remained unchanged in the remaining regions. The
value in C. Y. C. Town and X. Y. Town after the adjustment was higher than that before.
As shown in , the
value of residential lands increased by 1.32 times after adjusting planning policies. Specifically, the
value of residential lands in C. Y. C. Town, X. Y. Town, Y. L. Town, X. X. Block and J. X. Block increased. The
value of residential lands in X. Y. Town and Y. L. Town increased significantly, more than doubled of that before the adjustment. The
value of residential lands in G. Y. Block and J. G. Block decreased, whereas it remained fixed in B. S. Block. Besides, the
value of commercial lands after the adjustment increased by 1.2 times compared with before, while that of commercial lands in C. Y. C. Town, X. Y. Town and Y. L. Town increased by 4.95, 1.95 and 1.45 times, respectively. The
value of commercial lands in G. Y. Block, J. X. Block, X. X. Block and J. G. Block dropped and remained unchanged in B. S. Block. For industrial lands, the
value after the adjustment changed to 0.97 times of before. Industrial lands expanded toward the outskirt. The
value of industrial lands in C. Y. C. Town and X. Y. Town increased, whereas it dropped in Y. L. Town, J. X. Block and J. G. Block. The
value of industrial lands in B. S. Block, G. Y. Block and X. X. Block remained the same. In a word, the
value of C. Y. C. Town and X. Y. Town increased after the policy adjustment, indicating that land economic values increased.
After the policy adjustment, the economic development of Yanji City accelerated, and land transaction expanded toward the west, in line with the national government’s urban development strategy of ‘optimising in the east and expanding in the west’. Along the streets and roads, the economic development of residential lands experienced ups and downs, while that of commercial lands and industrial lands decreased. In the peripheral Y. L. Town, the economic growth of residential lands increased; the economic value of commercial lands increased, but the trading volume decreased, and the economic development of industrial lands declined. In C. Y. C. Town and X. Y. Town, all the three indexes of
and
increased. Land transactions in X. Y. Town were mostly in the west regions or the central area near J. G. Block. Most land transactions in C. Y. C. were mostly in Zhongping Village and Guangshi Village near the intersection of two rivers.
4.3. Spatiotemporal variation pattern of E.S.V. equivalent ratio
4.3.1. E.S.V. equivalent ratio before and after the adjustment of planning policies
The E.S.V. equivalent in subsection 3.2 was used to assign values to the study area, and the results and changes are shown in . The E.S.V. equivalent ratio of Yanji City decreased from 2011 to 2020. The average ratio per km dropped by 6.5% from 1.208 to 1.129, experiencing ups and then downs. From 2010 to 2015, the E.S.V. equivalent ratio of Yanji City increased by 14.1%, and that of forest land increased by 62.23 and accounted for 40% of the total equivalent ratio. The net growth of the E.S.V. equivalent ratio of rivers was 1.30, while that of cultivated land decreased by 23.29 from 59.7% to 47.6%. From 2016 to 2020, the E.S.V. equivalent ratio of Yanji City lost 87.85, and those of all land use types, except rivers, decreased, especially that of forest land (68.09). Although the ratio of cultivated land decreased by only 2.31, its proportion increased from 47.6% to 57.3%.
Table 3. Numerical value changes in E.S.V. equivalent ratio before and after adjusting planning policies.
The variations of E.S.V. equivalent ratio before and after the policy adjustment were divided into five grades on ArcGIS: growth zone, slight growth zone, stable zone, slight reduction zone and reduction zone.
The variations of E.S.V. equivalent ratio from 2010 to 2015 are shown in . Spatially, the reduction zone, mainly composed of cultivated lands, was dominant. The growth zone was forest embedded like wedges and distributed in the northeast area of Y. L. Town, northeast area of C. Y. C. Town and south areas of X. Y. Town. The slight growth zone was mostly rivers. The variations of E.S.V. equivalent ratio from 2015 to 2020 are shown in . Except for rivers that belonged to the slight growth zone, the E.S.V. equivalent ratio of remaining zones declined, and the slight reduction zone took the biggest proportion. The reduction zone was forest embedded like wedges and distributed in the northeast areas of Y. L. Town, northeast areas of C. Y. C. Town and south areas of X. Y. Town. Comparing the two figures, we can see that the E.S.V. equivalent ratio of forest land in Jilin City increased first and then decreased, which that of rivers increased slightly from 2010 to 2020. The area without E.S.V. expanded due to the expansion of urban built-up areas, thereby decreasing the total E.S.V. equivalent ratio. The E.S.V. equivalent ratio of cultivated lands kept decreasing.
Figure 8. Spatial variations of E.S.V. equivalent ratio before and after adjusting planning policies. (a) Variations of E.S.V. equivalent ratio before the policy adjustment; (b) Variations of E.S.V. equivalent ratio after the policy adjustment.
Source: The authors.
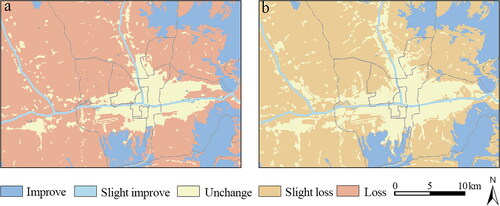
The economic development in Yanji City accelerated from 2010 to 2020, but E.S.V. experienced ups and then downs. Because adjusting planning policies accelerated urban land development and economic development, but eroded forest land, causing the increasing E.S.V. equivalent ratio to decline. After the adjustment, the urban development strategy of ‘controlling in south and extending in north’ was poorly implemented. The excessive land development in the south area of the city sacrificed the cultivated lands and forest lands.
4.3.2. Urban ecological pattern prediction in 2030
The driving factors in the F.L.U.S. model were updated to simulate the land use types in Yanji City in 2030 (). The urban area in the study area was 139.35 km The land use expansion in Yanji City may continue to erode cultivated lands and forest lands in the south areas of the city, based on comparing land use types in 2020 (). New urban lands will emerge in the north of the intersection between the C. Y. C. Town and X. Y. Town. After adjusting the overall planning in 2016, a new airport will be built in this region.
Figure 9. Spatial distribution of E.S.V. equivalent ratio. (a) Spatial distribution of E.S.V. equivalent ratio in Yanji City in 2020; (b) Spatial distribution prediction of E.S.V. equivalent ratio in Yanji City in 2030.
Source: The authors.
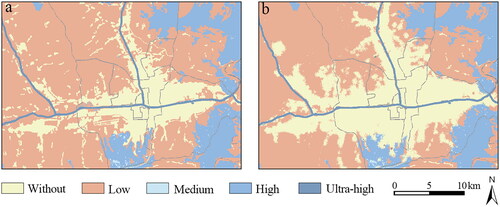
The equivalent ratios of six land use types in 2030 were assigned to predict the influence of planning policies on future E.S.V. equivalent ratio. The results and variations are shown in . The total E.S.V. equivalent ratio in 2030 decreases by 15.2% compared with that in 2020. The net reduction is 62.08. The average equivalent ratio per km decreases by 15.2%, from 1.129 to 0.957, indicating that ecological services are deteriorated. Specifically, the E.S.V. equivalent ratios of cultivated land and forest land decrease by 48.99 and 12.86, respectively. The ratio of grassland declines slightly by 0.23, and that of rivers remains the same. The ratio in the study area is divided into five levels – zero, low, moderate, high and ultrahigh, to evaluate the spatial pattern changes. As shown in , the study area is mainly composed of zero, low, and high E.S.V. equivalent ratios. The regions with high ratio concentrate in the south and east areas of the city, which are embedded like wedges in the northeast areas of C. Y. C. Town, northeast areas of Y. L. Town, and southeast and south areas of X. Y. Town. In 2030, the regions with increasing E.S.V. equivalent ratio are mainly distributed along both sides of rivers in C. Y. C. Town and Y. L. Town, around the new airport, in the peripheral region of the original urban area of X.Y. Town and in the middle of B. S. Block. The scattered small-sized construction land plaques will evolve into natural lands, and a large urban plaque will expand to connect with other plaques, thereby making urban forms more compact. The forest land and cultivated land in south will shrink due to urban expansion, further decreasing the E.S.V. equivalent ratio.
Table 4. E.S.V. equivalent ratio prediction of Yanji City in 2030.
In general, urban expansion guided by adjusting planning policies will damage the future ecosystem in Yanji City. Although cultivated land expansion can promote the growth of E.S.V. equivalent ratio, the E.S.V. equivalent ratio of cultivated land is lower than the average, and lower than that of other natural lands, indicating low comprehensive ecological service benefits. Therefore, ecosystem damages are mainly manifested as city’s erosion on forest land.
5. Conclusions and suggestions
5.1. Conclusions
The spatiotemporal layout changes in economy and ecology against the backdrop of spatial national land planning, were measured through a case study on Yanji City via F.L.U.S. model. The economic and ecological benefits were assessed. The spatial layout of land use types in 2030 was simulated and predicted. This study investigated the planning coordinated response mechanism of economic and ecological services in urban expansion. Here are major conclusions:
AI simulation can foresee the results of macroscopic economic policies and spatial planning policies of national lands, making the policies more perspective. The F.L.U.S. model can assess the policy results and help urban planners and managers make better policy decisions, by predicting the action mechanism of future urban development policies on ecosystem services. It serves as a reference to formulating planning schemes that suit urban economic and ecological development laws better.
For Yanji City, urban space expands toward the west, accelerating the urban economic development, thanks to the adjustment of planning policies. The economic value of residential and commercial lands in the west increases, and commercial economic growth is extremely strong. The transaction price of unit commercial land increases, but that of industrial land decreases slightly.
The original planning policies bring down the rising E.S.V. equivalent ratio of Yanji City. The ecosystem is damaged, and the future E.S.V. equivalent ratio continues to decrease. It is mainly manifested in the poor ecological benefits in the south areas of the city, and erosion of cultivated land and forest land. Consequently, the declined E.S.V. keeps damaging the ecosystem.
5.2. Policy suggestions
In view of the uncoordinated economic and ecological development in urban expansion, we propose the following suggestions:
Planning policies exert a lasting impact on economic and ecological benefits. The interaction and coordinated responses between economic and ecological benefits should be valued. The simulation results for the study area in section 4 show that, analysis and simulation based on technologies like A.I. should be applied to achieve a dynamic balance, so as to realise high-quality urban development.
From the perspective of economic benefits, comprehensive analysis in accordance with local situations and industrial development is recommended. In particular, when studying new points of economic growth of cities, we need to consider multiple factors to determine the new sites of land use, divide functional zones, formulate sound industrial policies, and ensure maximum land benefits.
From the perspective of ecological benefits, the E.S.V. equivalent ratio deserves full attention, especially the post-planning prediction and quantitative analysis. Subsection 4.3 highlights the importance of ecological conservation strategies in urban planning. China already has relevant requirements and regulations like ecological protection red lines, but it is necessary to further refine it, strengthen it, and lift it up to a long-term mandatory provision over ecological services, as well as enhance dynamic management. The Chinese government should conduct a scientific analysis on industrial selection and functional layout, form environmental-friendly production means and lifestyle, improve environmental quality, and in turn promote economic growth.
5.3. Shortcomings and prospects
Coordinated development between economy and ecology is influenced by industrial structure, population flow, and technological innovations. However, relevant systems are not discussed in this study. The missing data about land use types in 2016 also limited the accuracy of the measured results of urban economic and ecological benefits against the backdrop of spatial national land planning. In addition, the E.S.V. equivalent ratio is an index that describes the variation amplitude of E.S.V., but it cannot quantify the economic loss caused by ecosystem damages accurately. Therefore, in view of the above shortcomings, a multi-factor evaluation system will be established in the future, and more accurate economic and ecological measurement methods and more scientific E.S.V. quantitative indicators will be applied to achieve coordinated economic and ecological development in the context of urban expansion.
Authors’ contributions
Huanchun Huang: Conceptualisation, Data Curation, Investigation, Methodology, Project administration, Resources, Writing – Review & Editing. Keng Chen: Conceptualisation, Data Curation, Investigation, Methodology, Visualisation, Writing – Original Draft. Hao Zhang: Methodology, Writing – Review & Editing. Lijian Ren: Conceptualisation, Methodology, Writing-Review & Editing, Supervision.
Geolocation information
Yanji City, Yanbian Korean Autonomous Prefecture, Jilin Province, China.
Disclosure statement
No potential conflict of interest was reported by the authors.
Additional information
Funding
References
- Albouy, D., Ehrlich, G., & Shin, M. (2018). Metropolitan land values. The Review of Economics and Statistics, 100(3), 454–466. https://doi.org/10.1162/rest_a_00710
- Baranova, P., & Meadows, M. (2017). Engaging with environmental stakeholders: Routes to building environmental capabilities in the context of the low carbon economy. Business Ethics: A European Review, 26(2), 112–129. https://doi.org/10.1111/beer.12141
- Bayulken, B., & Huisingh, D. (2015). A literature review of historical trends and emerging theoretical approaches for developing sustainable cities (part 1). Journal of Cleaner Production, 109, 11–24. https://doi.org/10.1016/j.jclepro.2014.12.100
- Chen, B., & Li, H. E. (2020). Impact of climate change and human activities on economic values produced by ecosystem service functions of rivers in water shortage area of Northwest China. Environmental Science and Pollution Research International, 27(21), 26570–26578.
- Chen, S., Zhang, Y., Borzée, A., Liang, T., Zhang, M., Shi, H., Chen, B., Xu, W., Song, Y., & Mao, L. (2021a). Landscape attributes best explain the population trend of wintering greater white-fronted goose (Anser albifrons) in the Yangtze River Floodplain. Land, 10(8), 865. https://doi.org/10.3390/land10080865
- Chen, S. C., Su, W. H., Chen, J., & Li, K. W. (2021b). The effects of COVID-19 on manufacturer operations: Evidence from China. Transformations in Business & Economics, 20(2), 41–61.
- Cristina, T. M., Javier, A. G., Miguel, A. G. F., Inés, F. M., Jaime, G. T., & Aralar, I. T. (2020). Achieving a nearly zero energy district through integration of renewable energy: A case study in Valladolid (Spain). DYNA, 95(6), 635–639.
- Delphin, S., Escobedo, F. J., Abd-Elrahman, A., & Cropper, W. P. (2016). Urbanization as a land use change driver of forest ecosystem services. Land Use Policy, 54, 188–199. https://doi.org/10.1016/j.landusepol.2016.02.006
- Gino, B. B. (2020). Climate change adaptation, coffee, and corporate social responsibility: Challenges and opportunities. International Journal of Corporate Social Responsibility, 5, 3.
- Grekousis, G. (2019). Artificial neural networks and deep learning in urban geography: A systematic review and meta-analysis. Computers Environment and Urban Systems, 74, 244–256. https://doi.org/10.1016/j.compenvurbsys.2018.10.008
- Han, J., Jin, X. B., Zhang, Z. H., Wei, S., Xu, X., & Zhou, Y. (2017). Development characteristics and factors analysis of residential land price in China. Scientia Geographica Sinica, 37(4), 573–584.
- Han, Z., Jiao, S., Zhang, X., Xie, F., Ran, J., Jin, R., & Xu, S. (2021). Seeking sustainable development policies at the municipal level based on the triad of city, economy and environment: Evidence from Hunan province. Journal of Environmental Management, 290, 112554.
- Jones, M., & Reed, R. G. (2018). Open space amenities and residential land use: An Australian perspective. Land Use Policy, 75, 1–10. https://doi.org/10.1016/j.landusepol.2018.02.056
- Josip, L., Ante, R., & Danko, M. (2021). Key tasks and competences of spatial data manager in local self-government. Tehnički Glasnik, 15(2), 213–219.
- Kolovos, K. G., Kyriakopoulos, G., & Chalikias, M. S. (2011). Co-evaluation of basic wood fuel types used as alternative heating sources to existing energy network. Journal of Environmental Protection and Ecology, 12(2), 733–742.
- Li, X., Chen, Y., Liu, X., Xu, X. C., & Chen, G. L. (2017). Experiences and issues of using cellular automata for assisting urban and regional planning in China. International Journal of Geographical Information Science, 31(8), 1606–1629. https://doi.org/10.1080/13658816.2017.1301457
- Liu, L., & Meng, L. N. (2020). Patterns of urban sprawl from a global perspective. Journal of Urban Planning and Development, 146(2), 04020004. https://doi.org/10.1061/(ASCE)UP.1943-5444.0000558
- Liu, X., Liang, X., Li, X., Xu, X., Ou, J., Chen, Y., Li, S., Wang, S., & Pei, F. (2017). A future land use simulation model (FLUS) for simulating multiple land use scenarios by coupling human and natural effects. Landscape and Urban Planning, 168, 94–116. https://doi.org/10.1016/j.landurbplan.2017.09.019
- Liu, X. J., & Wang, M. S. (2016). How polycentric is urban China and why? A case study of 318 cities. Landscape and Urban Planning, 151, 10–20. https://doi.org/10.1016/j.landurbplan.2016.03.007
- Liu, Y., Liu, M., Wang, G. G., Zhao, L. L., & An, P. (2021). Effect of environmental regulation on high-quality economic development in China – An empirical analysis based on dynamic spatial Durbin model. Environmental Science and Pollution Research, 28(39), 54661–54678.
- Maaref, A., & Elahmar, S. A. (2019). Optimal PPM-shift based on artificial neural network for 2PPM-TH-UWB systems. Journal of Engineering Science and Technology Review, 12(6), 54–59. https://doi.org/10.25103/jestr.126.07
- Maria, A. R., Mariam, M. R., Beatriz, I., & Maranon, T. (2016). Evaluation of forest ecosystem services in Mediterranean areas. A regional case study in South Spain. Ecosystem Services, 20, 82–90.
- Martos, A., Pacheco-Torres, R., Ordonez, J., & Jadraque-Gago, E. (2016). Towards successful environmental performance of sustainable cities: Intervening sectors. A review. Renewable and Sustainable Energy Reviews, 57, 479–495. https://doi.org/10.1016/j.rser.2015.12.095
- Nelson, E., Sander, H., Hawthorne, P., Conte, M., Ennaanay, D., Wolny, S., Manson, S., & Polasky, S. (2010). Projecting global land use change and its effect on ecosystem service provision and biodiversity with simple models. PLoS One, 5(12), e14327.
- Pijanowski, B. C., Tayyebi, A., Doucette, J., Pekin, B. K., Braun, D., & Plourde, J. (2014). A big data urban growth simulation at a national scale: Configuring the GIS and neural network based land transformation model to run in a high performance computing (HPC) environment. Environmental Modelling & Software, 51, 250–268. https://doi.org/10.1016/j.envsoft.2013.09.015
- Sannigrahi, S., Bhatt, S., Rahmat, S., Paul, S. K., & Sen, S. (2018). Estimating global ecosystem service values and its response to land surface dynamics during 1995-2015. Journal of Environmental Management, 223, 115–131. https://doi.org/10.1016/j.jenvman.2018.05.091
- Seto, K. C., Fragkias, M., Gueneralp, B., & Reilly, M. K. (2011). A meta-analysis of global urban land expansion. PLoS One, 8, e23777.
- Streimikiene, D., Kyriakopoulos, G. L., Lekavicius, V., & Siksnelyte-Butkiene, I. (2021). Energy poverty and low carbon just energy transition: Comparative study in Lithuania and Greece. Social Indicators Research, 158(1), 319–371.
- Wagner, M., & Vries, W. T. (2019). Comparative review of methods supporting decision-making in urban development and land management. Land, 8(8), 123. https://doi.org/10.3390/land8080123
- Wang, S. J., Cebula, R. J., Liu, X. W., & Foley, M. (2021). Housing prices and urban land use efficiency. Applied Economics Letters, 28(13), 1121–1124. https://doi.org/10.1080/13504851.2020.1803476
- Wu, J. Y., Guo, Q., & Hewings, G. J. D. (2019). Land regulating economy as a policy instrument in urban China. Cities, 94, 225–234. https://doi.org/10.1016/j.cities.2019.06.009
- Xing, L., Zhu, Y. M., & Wang, J. P. (2021). Spatial spillover effects of urbanization on ecosystem services value in Chinese cities. Ecological Indicators, 121, 107028. https://doi.org/10.1016/j.ecolind.2020.107028
- Yang, S. F., Hu, S. G., Wang, S. L., & Zou, L. L. (2020). Effects of rapid urban land expansion on the spatial direction of residential land prices: Evidence from Wuhan, China. Habitat International, 101, 102186. https://doi.org/10.1016/j.habitatint.2020.102186
- Yu, X. H., Ma, S., Cheng, K., & Kyriakopoulos, G. L. (2020). An evaluation system for sustainable urban space development based in green urbanism principles – A case study based on the Qin-Ba mountain area in China. Sustainability, 12(14), 5703. https://doi.org/10.3390/su12145703
- Zhang, B. S., & Qi, R. K. (2021). Transportation infrastructure, innovation capability, and urban economic development. Transformations in Business & Economics, 20(3C), 526–545.
- Zhao, L., & Peng, Z. R. (2010). Integrated bilevel model to explore interaction between land use allocation and transportation. Transportation Research Record: Journal of the Transportation Research Board, 2176(1), 14–25. https://doi.org/10.3141/2176-02
