
 ?Mathematical formulae have been encoded as MathML and are displayed in this HTML version using MathJax in order to improve their display. Uncheck the box to turn MathJax off. This feature requires Javascript. Click on a formula to zoom.
Abstract
From the perspective of economic growth efficiency, this paper adopts the traditional DEA-Malmquist index method and the SBM-ML index method considering undesired output to measure the growth efficiency of China’s real economy with or without environmental constraints. The results show that: (1) From 2005 to 2017, the total factor productivity of China's real economy increased by 2.7%, but under environmental constraints, the total factor productivity of China’s real economy decreased by 0.6%, mainly due to the “drag” of the growth efficiency of the real economy by technological changes. Second, without considering the unintended output, 76.67% of the provinces and cities have improved the growth efficiency of the real economy, and 93.33% have made technological progress. Third, under environmental constraints, the total factor productivity and technological progress showed an upward trend only in the central region, while all other regions showed a downward trend to varying degrees. The descending range is east > northeast > west.
1. Introduction
The real economy is the foundation and main body of a country's economic development. Since the reform and opening up, China's real economy has developed rapidly, driving the development of the fictitious and overall economy. Although the current fictitious economy, represented by finance and real estate, is developing rapidly, there are also huge ‘economic bubbles’ behind it. After the 2008 financial crisis specifically, all countries were aware of the dangers of financial/non-real economies over-expanding. They also realized that the development of the real economy was the foundation of national economic development. If divorced from the real economy, the overall economic development will not last. At present, China's economy has shifted from a stage of high-speed growth to a stage of high-quality development. It is in a critical period of transforming its development mode, optimizing its economic structure and transforming its growth drivers. Structural production issues and distribution issues are intertwined and new growth drivers are needed (Zhang et al., Citation2022). The report to the 19th National Congress of the Communist Party of China pointed out that the focus of economic development must be placed on the real economy in building a modernized economy.
At present, the research on economic growth efficiency at home and abroad is more concentrated on the research on the growth efficiency of provinces, cities, or industries (Albert, Citation1998; Färe et al., Citation1994; Li & Zheng, Citation2019; Sun & Ding, Citation2015). There is limited research on the growth efficiency of the real economy. The calculation of the general economic growth efficiency only considers the constraints of input of labour, capital, energy and other factors, ignoring the total factor productivity of undesired outputs such as environmental pollution. However, the real economy activities are subject to the dual constraints of pollution discharge and resource input simultaneously. Lack of efficiency evaluation for environmental constraints will orient local economic development to GDP only, ignoring environmental pollution problems, which is not conducive to sustainable economic development (Zhu et al., Citation2011). Therefore, this study attempts to measure the growth efficiency of the real economy by considering environmental constraints and exploring the driving force of its growth, so as to provide a reference point to guide the high-quality development of the real economy.
Marginal utility of this research: First, this study combines the current era of ‘high-quality economic development’ and ‘revitalization of the real economy’, and divides the economy into the real and fictitious economy from the industrial level, which enriches the efficiency of economic growth to an extent. The research object can also create a preliminary understanding of the current development and growth efficiency of my country's real economy. Second, this study considers the research on growth efficiency of the real economy under environmental constraints, using the traditional DEA-Malmquist index method, by considering the non-essential Slacks-based Measure and Malmquist Luenberger (SBM-ML) index method of expected output measures; it decomposes the growth efficiency of the real economy under the constraints of resources and the environment. Finally, we conduct a comparative analysis of the obtained results to provide a reference for the preliminary understanding of changes in economic growth efficiency and reasons for these changes. Third, this study measures the growth efficiency of the real economy in 30 provinces and cities across the country. These are divided it into four regions: the eastern, central, western and north-eastern regions, for further analysis. The direction and focus of improvement provide references to further promote the high-quality development of China's economy.
2. Literature review
2.1. Economic development and environmental pollution
As China's economy enters the new normal, scholars are committed to exploring the path of harmonious coexistence, common development of economic growth and the ecological environment. Between environmental pollution and economic growth, there is not only an ‘inverted U-shaped’ curve that increases first and then decreases (Grossman & Krueger, Citation1991), but also other forms: ‘N-shaped’ and ‘inverted N-shaped’ curves (Xu, Citation2018; Yang et al., Citation2015). The correlation between environmental pollution and economic growth, scale and quality depends on industrial structures and local policies (Du et al., Citation2020). In the short term, environmental pollution intensifies with economic growth (Yan & Cao, Citation2020).
As one of the negative externalities of economic development, environmental pollution has long concerned academia. The selection of environmental factors can be divided in three ways: single, multi and comprehensive indexes. The selection methods of indicators are different for each research object. The main sources of environmental pollution are waste gas, wastewater and solid waste; these are the focus of unexpected output research. Since the exhaust gas contains a variety of pollutants, researchers have different methods for the selection of exhaust gas measurement indicators. Some scholars use carbon dioxide, sulfur dioxide, nitrogen oxides, smoke (powder) dust and other indicators to characterize the unexpected output (Huang et al., Citation2018; Wang & Cheng, Citation2019; Xiang & Lin, Citation2018). Considering the complexity of carbon dioxide emission calculation and the scientificity and availability of data, this study selects sulfur dioxide emissions to measure the exhaust emission level.
2.2. Definition of the real and fictitious economy
The real and non-real economy jointly constitute the overall economy of China and are two corresponding concepts. They operate independently and are unified. The current academic circle has not completely unified the definition and scope of the real and non-real economy.
The real economy is characterized by market, commerce, legal tender, taxation, government regulation and national accounting accounts (Zelizer, Citation2008). The real economy can be defined from the perspectives of material production (Liu, Citation2011), pricing (Liu, Citation2003) and monetary growth (Liu, Citation2015). Most scholars regard the production sector that excludes the financial and real estate industries as the real economy (Huang, 2017; Wang et al., Citation2022; Wang & Dong, Citation2018). From the perspective of pricing, the non-real economy includes real estate, finance and other industries, high-tech products, intangible assets and so forth (Cheng, Citation2003). It uses currency, value symbols and assets as media (Liu, Citation2015) and has four characteristics: high liquidity, high risk, instability and high speculation.
Since the Industrial Evolution 4.0, people's lifestyles have become increasingly information-based. Information and industrialization have gradually integrated. Services and information have become new trends in the development of the real economy. The manufacturing industry is still the core of the real economy (Huang, 2017A). the non-real economy is the product of the development of the real economy, to a certain extent. Its purpose is to serve the real economy. In the process of the development and expansion of the non-real economy, the real economy has been revitalized and developed. However, with the excessive development of the non-real economy, talents, capital, technology and other factors are largely occupied by the financial market. The prevalence of short-term speculation and the false prosperity of the financial market will lead to the lack of driving forces in the growth of the real economy. Once the bubble economy is destroyed, the real economy will be shocked severely (Caballero & Krishnamurthy, Citation2006; Li & Yin, Citation2017; Martin & Ventura, Citation2012).
Through a literature review, we can define the real and non-real economy from two perspectives: one is through discrimination between the two economies and the other is through industrial classification. From the industrial level, most scholars exclude the financial industry from the real economy; the main difference is whether to attribute the real estate industry to the real economy. In the real estate industry, development, investment, construction and the purchase of consumer housing can be regarded as the real economy, while speculation to earn spread income in the secondary real estate market does not belong to the real economy. Considering the current trend of China's real estate industry, this study refers to the practice of most scholars and regards the financial sector and real estate industry as the non-real economy, while the rest of the industrial sectors are regarded as real economies.
2.3. Economic growth efficiency
At present, the efficiency of economic growth is often measured by total factor productivity, predominantly including the parametric method represented by the Solow residual method and stochastic frontier approach (SFA), as well as the nonparametric method represented by data envelopment analysis (DEA).
Most scholars have conducted empirical analyses on China's economic growth efficiency from the perspective of productivity (Wang et al., Citation2006; Yan & Wang, Citation2004; Yi et al., Citation2003; Zhu et al., Citation2009). However, in the process of economic development, they only take GDP as the guide and ignore the impact of environmental factors on economic growth efficiency. The calculation results obtained may mislead the meaning of total factor productivity (Shadbegian & Gray, Citation2005) or overestimate the actual production efficiency (Li & Xu, Citation2009). Considering the constraints of the environment and resources, researchers began to analyse green total factor productivity (Chen, Citation2010; Hoang & Coelli, Citation2011), which is mostly used to explain the regional economic gap (Hu & Yang, Citation2011; Wu, Citation2009). Most scholars use the SBM directional distance function for measurement (Chen, Citation2010; Yang & Long, Citation2012; Yu & Wei, Citation2012; Zhang & Tang, Citation2022); in the selection of indices, some use Luenberger Productivity Index (Yuan & Xie, Citation2015), Globe Malmquist Luenberger (GML) Index (Yu & Wei, Citation2012) and Malmquist Luenberger (ML) Index (Lu et al., Citation2017; Yang & Shao, Citation2009; Yang & Wang, Citation2022).
With the deepening of empirical research, scholars calculate the economic growth efficiency from national, regional and prefecture levels. Some international scholars use Malmquist index to evaluate the economic productivity of OECD countries (Färe et al., Citation1994), use stochastic frontier analysis (SFA) to calculate the economic growth efficiency of various regions of Spain (Albert, Citation1998) and introduce endogenous mapping vector into the GTFP of dozens of countries in the DEA model (Mavi, 2019), the technical efficiency (TE) index of G7 countries is calculated using a Two-stage DEA model (Bampatsou & Halkos, Citation2019). In China, some scholars use the stochastic frontier production function model to study China's overall economic growth efficiency (Zhu et al., Citation2009) and regional economic growth efficiency (Li & Zheng, Citation2019; Sun & Ding, Citation2015; Zhang et al., Citation2021); alternatively, they use the DEA Malmquist index model to study the total factor productivity of provinces, cities and regions in China (Yan & Wang, Citation2004; Zhang & Ma,Citation2022). Some scholars also use the two-stage network DEA model (Yang et al., Citation2020) to construct the economic growth efficiency index (Huang & Guo, Citation2020) to calculate and decompose the economic efficiency. Zhang established production function models to measure the efficiency of regional resource allocation (Zhang et al., Citation2022).
Through the above, the existing literature has conducted much research on measuring China's economic growth efficiency, but there is no research evaluating economic growth efficiency from the perspective of economic structure. In the research and evaluation of economic growth efficiency, most studies only focus on the expected output, such as GDP, without considering the possible pollutants, non-performing loans and other unexpected outputs in the process of economic growth. In this study, the traditional DEA Malmquist and SBM-ML index methods considering undesired output are used to construct the measurement model of real economic efficiency. The total factor productivity represents the economic growth efficiency, decomposes the total factor productivity into technical change and technical efficiency, compares and analyses the real economic total factor productivity from the national, provincial and regional levels, explores the main reasons affecting the change of economic growth efficiency and analyses the temporal and spatial dynamic evolution characteristics of economic growth efficiency.
3. Research methods and data processing
3.1. Data envelopment analysis
DEA is an efficiency evaluation method proposed by Charnes et al. (Citation1978). Its prototype comes from the enveloped idea of Farrell (Citation1957). This method mainly uses the idea of linear programming to solve the problem of multi-input and multi-output; there is no need to set the function form. DEA method is applicable to the measurement of production efficiency in the presence of multiple decision-making units. According to the input-output data of all decision-making units, the production possibility set and frontier are constructed. The gap between each object and production frontier is then calculated. Finally, the production efficiency is calculated. On this basis, Färe et al. (Citation1994) used the research of Malmquist (Citation1953) and Shephard distance function to create a Malmquist productivity index method that could measure and decompose the dynamic change of production efficiency.
The Malmquist productivity index model assumes that the decision-making unit production technology converts input factor X into output Y at each time. St is the production possibility set at time t:
(1)
(1)
The output distance function at time t is defined as the reciprocal of the maximum proportion that can expand to output y under the condition of fixed input x (Farrell, Citation1957):
(2)
(2)
When
if and only if
is a point on the technological frontier. At this time, the production is technically efficient (i.e. the output is maximized in the given input). The distance function at two different times is involved in the model, among them,
indicates the technical level at time t,
can reach its maximum possible for the ratio of output to actual output:
(3)
(3)
In EquationEquation (3)(3)
(3) ,
However, if there are technical changes,
so
is feasible.
At the technical level of production technology at time t and time t + 1, can reach the maximum possible for the ratio of output to actual output as:
(4)
(4)
The geometric average is used to calculate the change of production efficiency, as:
(5)
(5)
(6)
(6)
(7)
(7)
(8)
(8)
is the efficiency of economic growth in the region, if
it represents the improvement of regional economic growth efficiency; if
it represents the efficiency of regional economic growth remaining unchanged; if
it represents the decline in the efficiency of regional economic growth.
is the technical efficiency change index, which measures the approach degree of the region from time t to time t + 1 to the production frontier. If
then the technical efficiency is improved; if
the technical efficiency is declined.
is the technology change index, which measures the outward expansion of the production possibility boundary from time t to t + 1 in the region. If
the region has made technological advances; if
the region is technologically backward.
In the production process, some by-products such as waste gas, wastewater and solid waste are often produced. Generally, the calculation of economic growth efficiency only considers the constraints of factor inputs such as labour, capital and energy. It and ignores the total factor productivity in the presence of unexpected output. At the same time, most of the traditional DEA models are radial models, without considering the relaxation of input or output. Therefore, Tone (Citation2001) proposed the Slacks-based Measure (SBM) model, which incorporated relaxation variables into the objective function to solve the relaxation problem of input-output and the efficiency measurement problem of unexpected output. Chung et al. (Citation1997) created a directional distance function to replace the traditional Shephard distance function and constructed a Malmquist-Luenberger (ML) productivity index that can measure the total factor productivity with unexpected output. Combined with the SBM model and ML index method, this study measures the growth efficiency of the real economy while considering unexpected output.
The ML index aims to increase expected output and reduce unexpected output. In form, it is as:
(9)
(9)
In EquationEquation (9)(9)
(9) , g represents the direction vector to which the output is scaled.
meaning that the expected output increases while the unexpected output decreases;
is output set; y is expected output, x is unexpected output. Thus, the following can be obtained:
(10)
(10)
As with the Malmquist index, ML can also be decomposed to obtain technical changes and technical efficiency. The specific decomposition is as follows:
(11)
(11)
(12)
(12)
(13)
(13)
(14)
(14)
The ML index and its decomposition have the same meaning as the Malmquist index; if it shows that the efficiency of regional economic growth has been improved; if
then the efficiency of regional economic growth is reduced.
3.2. Data and variable description
3.2.1. Data description
The research objects of this study are 30 provinces (cities and autonomous regions) from 2005 to 2017. The data are from China Statistical Yearbook, China fixed assets statistical yearbook, China Environmental Statistical Yearbook, local statistical yearbook, EPS database and the official website of the people's Bank of China and its branches. To maintain the consistency of statistical calibre, the data of Tibet is missing, so it has not been included within the scope of the investigation. For the processing of missing data of individual provinces and years, this study adopts appropriate methods, such as the exponential smoothing method and averages. To explore the differences of regional economic development, 30 provinces are divided by region: eastern, central, western and northeast.Footnote1
3.2.2. Input and output indicators of real economic growth efficiency
Referring to the research of most scholars (Dong et al., Citation2019; Wu et al., Citation2020; Yang & Wang, Citation2022; Yuan & Xie, Citation2015), the factor input is divided into capital, labour and energy factor input. The corresponding indicators for analysis are then selected. Among them, the input of capital factors considers two aspects: fixed capital and circulating capital investments. In terms of fixed capital investment, the fixed capital stock of the real economy is used as a measure and the ‘perpetual inventory method’ proposed by Zhang et al. (Citation2004) is used for calculation. The fixed asset investment in the real economy is calculated using the regional fixed asset investment minus the fixed asset investment in the financial and real estate industries, deflated according to the regional fixed asset investment price index in the China Statistical Yearbook and converted to 2005 as the base period. The average annual growth rate of fixed asset investment is calculated using the cumulative method; the capital depreciation rate is 10.96% with reference to the research results of Shan (Citation2008). The stock of fixed capital reflects part of the capital investment of the real economy. For the current capital, the scale of social financing is used. The input of labour factors is selected from social employees minus employees in the financial and real estate industries. The input of energy factors is measured by the total energy consumption of the region.
As one of the negative externalities of economic development, environmental pollution has long concerned academic circles. For the selection of environmental factors, there are mainly three methods: single, multi- and comprehensive indicators. The indicator selection methods differ for each research object. In the selection of undesired output indicators, most authors choose waste gas, wastewater and solid waste as representatives (Cheng, Citation2016; Li, Citation2009; Liu & Zhang, Citation2022; Zhang & Gong, Citation2017) . This study also refers to the practice of most scholars, using exhaust gas, wastewater and solid waste as undesired outputs. The expected output is the real economic growth as the real economic output. Taking 2005 as the base period, according to the regional GDP index (the regional financial and real estate industries’ GDP index), the corresponding deflator is processed to obtain the real GDP and financial and real estate industries’ GDP at the constant price during 2005. The portion of the GDP after excluding the financial and real estate industries’ GDP is regarded as the GDP of the real economy. The descriptive statistics of the research variables of real economic growth efficiency are shown in .
Table 1. Descriptive statistics of variables in the study of real economy growth efficiency.
4. Empirical analysis
This study selects the data of 30 provinces and cities in China from 2005 to 2017 to calculate the growth efficiency of China's real economy. It uses the DEA Malmquist index method of DEAP 2.1 software, SBM model of maxdea6 pro software and ML index method to measure and decompose the total factor productivity of the real economy of provinces and cities under environmental constraints. The total factor productivity is divided into two parts: technical change and technical efficiency. Thereafter, the economic growth efficiency is analysed from the inter-provincial and regional levels, respectively. The differences of economic development are explored in various regions. The specific empirical analysis results are as follows:
4.1. Empirical analysis on the growth efficiency of China's real economy
At the national level, it can be seen from that the average value of total factor productivity of the real economy in 30 provinces and cities in China showed a fluctuating trend from 2005 to 2017, which was reflected in the increase of total factor productivity of the real economy in most years of the sample period. As it was affected by the 2008 financial crisis, the total factor productivity of the real economy decreased the most from 2008 to 2009. From 2011 to 2012, China's economy entered the new normal, which started the transformation and upgrading from high-speed growth to high-quality development; the total factor productivity of the real economy also decreased. This shows that the growth efficiency of the real economy is vulnerable to the macroeconomic environment and economic development stage to an extent. When the macro situation fluctuates or the economic development stage enters a period of adjustment, it will create fluctuations in the growth efficiency of the real economy. From 2005 to 2017, the average dynamic change of total factor productivity of 30 provinces and cities in China was 1.027, indicating that the total factor productivity of the real economy increased by 2.7% in 2017 compared with 2005. The change of total factor productivity in the real economy mainly comes from technological changes, which reflects the effectiveness of vigorously promoting technological innovation and reform in China. Technological changes showed a period of technological progress from 2005 to 2017, an increase of 3.3%. The average technical efficiency decreased by 0.7%, of which the average pure technical efficiency decreased by 0.2% and the average scale efficiency decreased by 0.4%; this shows that China's current real economic growth fails to make effective use of the total amount of factors under the current technical level. The improvement of the growth efficiency of the real economy not only depends on the promotion of technological changes, but also fully excavates the utilization efficiency of the current technology, so as to realize the high-quality growth of the real economy.
Table 2. Total factor productivity of real economy in 30 provinces and cities from 2005 to 2017.
During the investigation period, the real economy total factor productivity of 7 provinces and cities in Hebei, Heilongjiang, Jiangxi, Henan, Shaanxi, Gansu and Xinjiang decreased; the real economy total factor productivity of the other 23 provinces and cities was greater than 1; and the efficient provinces and cities accounted for 76.67% of the whole. shows that the real economy growth efficiency of most provinces and cities has improved. Among all provinces and cities, Beijing's average real economy total factor productivity increased the most, by 6.7%. The total factor productivity of Heilongjiang's real economy decreased most. Combined with the decomposition results of total factor productivity, 93.33% of provinces and cities show technological changes, among which Hainan had the most favourable technological change in the real economy and Heilongjiang had the largest technological regression. In terms of technical efficiency, Jilin had the largest increase in technical efficiency and Xinjiang had the largest decline in technical efficiency. Only 30% of provinces and cities have improved their technical efficiency, which shows that the technical efficiency of the real economy in most provinces and cities in China has decreased; this will weaken the promotion of technological changes in the real economy and inhibit the improvement of total factor productivity of the real economy. Through further decomposition of technical efficiency, only 36.67% of provinces and cities have pure technical efficiency greater than 1 and 13.33% of provinces and cities have scale efficiency greater than 1. This shows that the scale efficiency of the real economy in most provinces and cities in China is low, which also indicates that the real economy of China needs to focus on management and organizational innovation of enterprises related to the real economy, while increasing scientific research investment and improving independent innovation. Meanwhile, timely integration should be conducted to better play to its scale efficiency.
Table 3. Average total factor productivity of China’s real economy of provinces and cities from 2005 to 2017.
The total factor productivity is compared to the regional level, as shown in . From 2005 to 2017, the total factor productivity of the real economy in all regions of China increased; the growth range was east > west > northeast > central. The eastern region has the largest growth rate of total factor productivity of the real economy, with an average annual growth rate of 3.5%. In terms of technological change, the western region has the largest range of technological change, followed by the eastern region. Northeast China has the smallest range of technological change. The increase in total factor productivity of the real economy (except for the Northeast region) comes mainly from technological changes. Through further analysis, it can be found that the scale efficiency of eastern, central and western regions is relatively low, which indicates that there is still a gap between the production scale of the real economy in this region and the maximum scale. Therefore, the reasonable allocation of factors should further be conducted to achieve the optimization of scale. In addition, the pure technical efficiency of the central and western regions is also low, indicating that the two regions must still improve the system and management level.
Table 4. Average total factor productivity of real economy by region from 2005 to 2017.
4.2. Empirical analysis of China's real economic growth efficiency considering unexpected output
According to , the average value of total factor productivity of the real economy in 30 provinces and cities in China, considering environmental pollution, showed a fluctuating trend from 2005 to 2017; the total factor productivity was higher than 1 in only three years. From 2005 to 2017, the average value of total factor productivity of the real economy in 30 provinces and cities in China was 0.994; the total factor productivity of the real economy fell by 0.6%. Considering the unexpected output, the decrease of total factor productivity of the real economy mainly comes from technological change, but technological efficiency also restricts the improvement of the quality of real economic growth. The technical change is characterized by technical retrogression, with a decrease of 0.9%. Technical efficiency increased by an average of 0.2%. It shows that when considering the ‘bad’ output of waste gas and wastewater, there is still room for improvement in the total factor productivity of China's real economy. The main reason is that the degree of technological change of the real economy under environmental constraints is not sufficiently high. The technical efficiency of the real economy, considering environmental constraints, is higher than that under ignoring environmental factors; this is manifested as an improvement in technical efficiency.
Table 5. Change of total factor productivity in real economy under unexpected output from 2005 to 2017.
From the performance of 30 provinces and cities in the whole investigation period, only 11 provinces and cities have a real economy total factor productivity that is greater than 1 under the condition of considering unexpected output. The efficient provinces and cities account for 36.67% of the whole, which is 40% lower than that without considering the unexpected output, indicating that environmental factors are not considered in the growth efficiency of the real economy in most provinces and cities. Combined with the decomposition results of total factor productivity, only 33.33% of provinces and cities contain technological changes under the condition of considering unexpected output. In terms of technical efficiency, considering that the technical efficiency of the real economy has improved under the unexpected output, the provinces and cities with improved technical efficiency account for 66.67% of the whole. The basic statistical characteristics of the average value for total factor productivity results in the 30 provinces and cities are shown in . The results show that the real economic growth efficiency of most provinces and cities in China ignore environmental factors. The real economic growth efficiency and technological changes decrease after adding unexpected output, indicating that China's current real economic growth efficiency is still a certain distance from the objectives of ‘sustainable’ and ‘green’ development. The fundamental reason is that the technological improvement and innovation of green and environmental protection in the real economy are insufficient. At present, most technological improvements and changes focus on economic benefits such as output, ignoring the social benefits of environmental protection and resource utilization.
Table 6. Basic statistical characteristics of the mean value of total factor productivity of real economy in 30 provinces and cities.
The 30 provinces and cities are divided into the east, middle, west and the northeast for analysis. They then explore the regional differences in the growth efficiency of the real economy. The calculation results in the change of total factor productivity are shown in . From 2005 to 2017, the total factor productivity of the real economy in the central region of my country (which considers undesired output) increased by 0.4%; the growth efficiency of the real economy in the rest of the region declined. Among them, the eastern region showed the largest decline, with a decrease of 1.6%, followed by the northeast region. In terms of technological changes (except for the technological progress in the central region), the regions have experienced technological regression to varying degrees, of which the eastern region has the largest decline in technological changes. In terms of technical efficiency (except for the technical efficiency of the real economy in the Northeast region), there was a general decrease of 0.5% and the improvement in technical efficiency in other regions was not much different. It shows that under the consideration of environmental constraints, the growth efficiency of the real economy in the eastern, western and north-eastern regions have declined to varying degrees; the decline in the technology of the real economy in these regions is the main reason for the decline in the total factor productivity of the real economy.
Table 7. Average total factor productivity of real economy by region under unexpected output from 2005 to 2017.
4.3. Comparative analysis of the real economic growth efficiency under environmental constraints
In this study, the traditional DEA Malmquist model that considers only the expected output, as well as the SBM-ML (Malmquist Luenberger) model considering the undesired output are used to calculate the real economy total factor productivity. The results of real economy total factor productivity and its decomposition are then compared and analysed.
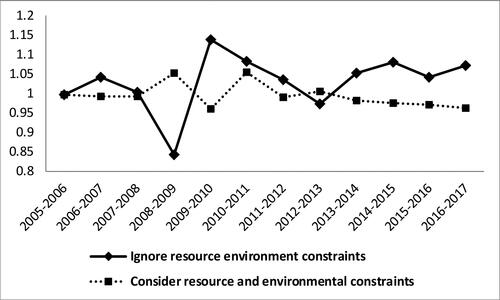
In terms of total factor productivity, according to , the average annual growth range and standard deviation of total factor productivity of the real economy based on the traditional DEA Malmquist model are greater than those of the SBM-ML model, indicating that the growth efficiency of the real economy under the constraints of resources and the environment has decreased, while the fluctuation of total factor productivity of the real economy has decreased and stability has increased.
Figure 1. Trends of total factor productivity of real economy in 30 provinces and cities from 2005 to 2017.
Source: Authors.
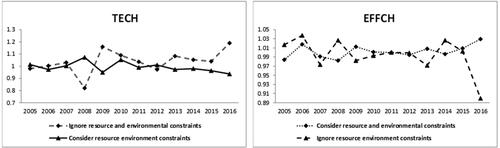
Total factor productivity is divided into the technical progress and efficiency change indexes; its change trend is shown in . In terms of technological changes, the average annual technological growth rate of the real economy (considering only the expected output from 2005 to 2017) was 3.3%, which was reflected in technological progress. Considering the environmental factors, the average annual growth rate of technological changes in the real economy was −0.9%, with a slight technological regression. Considering the unexpected output, the overall change range of technological change in the real economy is small. At present, the technological improvement and innovation of China's real economy have improved by improving economic benefits, but the technological innovation and changes in solving pollution and environmental protection problems must further be strengthened. In terms of changes, the overall technical efficiency of the real economy considering unexpected output is improved, which is better than technical efficiency of the real economy without unexpected output. At the same time, the standard deviation of technical efficiency for the real economy considering the unexpected output is less than the calculation results of the traditional DEA Malmquist model. The overall change range of the technical efficiency for the real economy considering the unexpected output is small and stable overall.
Figure 2. Trends of real economy technological progress index and efficiency change Index in 30 provinces and cities from 2005 to 2017.
Source: Authors.
The total factor productivity of the real economy for each region under the constraints of resources and the environment are decomposed and compared; the results are shown in . The total factor productivity of the real economy is greater than 1 when considering only the expected output in each region. When considering the unexpected output, only the central region shows an increase in total factor productivity and the rest show a decline in varying degrees; among them, the eastern region shows the largest decline. When only the expected output is considered, the growth rate of total factor productivity of the real economy in the eastern region is the highest in the region. This shows that the improvement of real economic growth efficiency in the eastern region is at the expense of the environment to an extent, which does not meet the requirements of sustainable and green development. Considering the unexpected output, the standard deviation of total factor productivity, technological change and efficiency of the real economy in each region is significantly reduced. This shows that when considering environmental constraints, the gap of real economic growth efficiency among regions is not large.
Table 8. Comparison of total factor productivity of real economy by region.
In terms of technological change, the expected output of the real economy of each region shows technological changes, but only the central region shows a slight increase in technology after the unexpected output is included in the calculation; the eastern region shows the largest decline in technological change. This reflects that the decline of real economic growth efficiency in the eastern region because unexpected output is largely due to the low degree of technological changes and improvements. Except for the northeast region, the technical efficiency considering unexpected output is greater than that considering only expected output, indicating that technical efficiency of most regions has significantly improved after incorporating risk constraints. Regardless of whether the unexpected output is considered, the technological changes in the real economy constitute a key factor affecting its total factor productivity in various regions.
5. Conclusions and suggestions
5.1. Conclusions
This study combs the relevant research on economic growth efficiency, defines the relevant concepts of the real and non-real economy, studies the real economic growth efficiency of 30 provinces and cities in China by using the traditional DEA-Malmquist and SBM-ML index methods considering unexpected output and draws the following conclusions:
First, from 2005 to 2017, the total factor productivity of my country's real economy increased by 2.7%; however, under environmental constraints, the total factor productivity of the real economy decreased by 0.6%. This shows that my country's current real economic growth efficiency is still far from the goals of ‘sustainable’: and ‘green’ development. The fundamental reason for this is that the level of green and environmentally friendly technological improvements and innovation in the real economy is insufficient. Most of the current technological improvements and changes focus on economic efficiency, ignoring the social benefits of environmental protection and resource utilization.
Second, 76.67% of provinces and cities have improved the growth efficiency of the real economy and 93.33% show technological progress, but few show improved technical efficiency, mainly because most provinces and cities have a low scale for efficiency of the real economy. Under environmental constraints, only 11 provinces and cities have a total factor productivity of the real economy that is greater than 1; efficient provinces and cities account for 36.67% of the whole, decreasing by 40% compared with non-expected output.
Third, at the regional level, the growth efficiency of the real economy measured by traditional methods has been improved to varying degrees. The growth range is eastern > western > northeast > central region. Technological progress in the middle, central and western regions is the key to the growth rate, while the improvement of technological efficiency in northeast regions is the cause. In terms of technological change, the western region has the largest technological change, followed by the eastern region. Northeast China has the smallest technological change range. However, under the environmental constraints, only the central region showed improvement in total factor productivity and technological progress, while the rest of the regions showed different degrees of decline; decline range is eastern > northeast > western.
5.2. Suggestions
According to the research, the green total factor productivity of China's real economy is significantly lower than the traditional total factor productivity. To achieve high-quality development of the real economy, it is necessary to consciously implement the concept of green development and then forge ahead.
This study puts forward the following suggestions for improving the efficiency of economic growth in various regions in the future: all regions should pay attention to technological improvement and progress, especially in the control of pollution, technological upgrading and green environmental protection improvements. The growth efficiency of the real economy in the eastern region has declined the most under environmental constraints. It is necessary to firmly establish the concept of green and sustainable development. While attracting investments, the entry of high-energy-consumption and high-emission enterprises should be fully controlled and pollution control should be increased. Emission control efforts should protect sustainable development and improve the energy recycling rate; the real economy in the central and western regions shows room for improvement in pure technical and scale efficiency, so it is necessary to increase investment in innovation and develop technology. During transformation, it is necessary to optimize the production scale of the real economy, strengthen regional infrastructure construction and administrative system reform and improve technical efficiency. When undesired output is not considered, the technical efficiency of the Northeast region is better than that of other regions. This shows that the Northeast region has achieved certain results in deepening the regional system reform in recent years and the regional technical efficiency has been significantly improved. Combined with the analysis of the growth efficiency of the real economy, the technological progress of the real economy in the Northeast region is also relatively low. Therefore, the Northeast region should further strengthen the technological transformation of the real economy. They should also strengthen traditional advantageous industries while cultivating emerging industries, increase innovation input and technological transformation of the real economy and promote the transformation and upgrading of the real economy.
Disclosure
No potential conflict of interest was reported by the authors.
Additional information
Funding
Notes
1 Based on regional differences in China, its 30 provinces are divided into four regions: eastern, central, western and northeast. The eastern region has a total of 10 provinces and municipalities: Beijing, Tianjin, Hebei, Shanghai, Jiangsu, Zhejiang, Fujian, Shandong, Guangdong and Hainan; the central region has 6 provinces and municipalities: Shanxi, Anhui, Jiangxi, Henan, Hubei and Hunan; the western region has 11 provinces and municipalities: Inner Mongolia, Guangxi, Chongqing, Sichuan, Guizhou, Yunnan, Shaanxi, Gansu, Qinghai, Ningxia and Xinjiang; and the northeast region has 3 provinces and municipalities: Liaoning, Jilin and Heilongjiang.
References
- Albert, M. G. (1998). Regional technical efficiency: A stochastic frontier approach. Applied Economics Letters, 5(11), 723–726. https://doi.org/10.1080/135048598354212
- Bampatsou, C., & Halkos, G. (2019). Economic growth, efficiency and environmental elasticity for the G7 countries. Energy Policy, 130, 355–360. https://doi.org/10.1016/j.enpol.2019.04.017
- Caballero, R. J., & Krishnamurthy, A. (2006). Bubbles and capital flow volatility: Causes and risk management. Journal of Monetary Economics, 53(1), 35–53. https://doi.org/10.1016/j.jmoneco.2005.10.005
- Charnes, A. C., Cooper, W. W., & Rhodes, E. L. (1978). Measuring the efficiency of decision making units[J]. European Journal of Operational Research, 3(4), 338–339.
- Chen, S. Y. (2010). China's green industrial revolution: An interpretation from the perspective of environmental total factor productivity (1980–2008). Economic Research Journal, 45(11), 21–34 + 58.
- Cheng, C. F. (2016). Green total factor productivity and its influencing factors in Chinese industry: An empirical study based on ML productivity index and dynamic panel model. Statistical Research, 33(03), 53–62.
- Cheng, S. W. (2003). Virtual economy and real economy. China Economic News, (14), 20–21.
- Chung, Y. H., Färe, R., & Grosskopf, S. (1997). Productivity and undesirable outputs: a directional distance function approach. Journal of Environmental Management, 51(3), 229–240. https://doi.org/10.1006/jema.1997.0146
- Dong, H. Z., Liu, S., Liu, R. M., & Tang, L. (2019). Heterogeneous effects of innovation quality on green total factor productivity—The dynamic threshold effect of environmental regulation. Science & Technology Progress and Policy, 37(06), 43–50.
- Du, B., Zheng, Q., Bai, X., Shi, L., & Shen, X. (2020). Research on evolution pattern and spatial correlation between economic development and environmental pollution centers of gravity. Sustainability, 12(19), 8020. https://doi.org/10.3390/su12198020
- Färe, R., Grosskopf, S., Norris, M., & Zhang, Z. (1994). Productivity growth, technical progress, and efficiency change in industrialized countries. The American Economic Review, 84, 66–83.
- Farrell, M. (1957). J. The measurement of productivity efficiency[J]. Journal of the Royal Statistical Society Series A (General), 120(3), 377–391.
- Grossman, G. M., & Krueger, A. B. (1991). Environmental impacts of a North American free trade agreement. NBER Working Paper, 3914.
- Hoang, V. N., & Coelli, T. (2011). Measurement of agricultural total factor productivity growth incorporating environmental factors: A nutrients balance approach. Journal of Environmental Economics and Management, 62(3), 462–474. https://doi.org/10.1016/j.jeem.2011.05.009
- Hu, X. Z., & Yang, L. (2011). Analysis of growth differences and convergence of regional green TFP in China. Journal of Finance and Economics, 37(04), 123–134.
- Huang, Q. H. (2017). A new stage of comprehensively implementing the manufacturing power strategy. Economic Daily, (014)
- Huang, Q. H. (2017). On the development of China's real economy at the new stage. China Industrial Economics, (09), 5–24.
- Huang, F. H., & Guo, W. J. (2020). Agglomeration of producer services and economic growth efficiency of urban agglomeration in Yangtze River Delta from the perspective of spatial spillover. Statistical Research, 37(07), 66–79.
- Huang, Q. H., Hu, J. F., & Chen, X. D. (2018). Environmental regulation and green total factor productivity: Dilemma or win-win? China population. Resources and Environment, 28(11), 140–149.
- Li, J. (2009). Regional environmental efficiency differences and influencing factors in China. South China Journal of Economics, (12), 24–35.
- Liu, J. M. (2003). Fictitious economy: Theoretical structure and themes. Nankai Journal, (02), 34–40.
- Liu, X. X. (2011). The systematization of individual risk and financial crisis—An explanation from fictitious economics. China Review of Political Economy, 2(04), 64–80.
- Liu, Z. B. (2015). Rethinking the interaction between real economy and fictitious economy. Study and Exploration, (09), 82–89.
- Liu, W., & Zhang, J. (2022). Fiscal decentralization, industrial structure adjustment and green total factor productivity: Based on the threshold effect of environmental pollution. Journal of Hebei University (Philosophy and Social Sciences), 47(03), 68–80.
- Li, J., & Xu, J. T. (2009). Analysis of inter-provincial green total factor productivity application of a non-parametric method. Journal of Beijing Forestry University, 8(04), 139–146.
- Li, S. G., & Yin, H. (2017). Government-enterprise talent allocation and economic growth: An empirical study based on China's city data. Economic Research Journal, 52(04), 78–91.
- Li, Y. Z., & Zheng, L. A. (2019). Study on economic growth efficiency and influencing factors in western provinces: An empirical analysis based on SFA model. Ecological Economy, (03), 57–62.
- Lu, L. W., Song, D. Y., & Huang, C. (2017). Measurement of green total factor productivity of cities in the Yangtze river economic belt: A case study of 108 cities in the Yangtze river economic belt. Urban Problems, (01), 61–67.
- Malmquist, S. (1953). Index numbers and indifference surfaces[J]. Trabajos de Estadistica, 4(2), 209–242. https://doi.org/10.1007/BF03006863
- Martin, A., & Ventura, J. (2012). Economic growth with bubbles. American Economic Review, 102(6), 3033–3058. https://doi.org/10.1257/aer.102.6.3033
- Shadbegian, R. J., & Gray, W. B. (2005). Pollution abatement expenditures and plant-level productivity: A production function approach. Ecological Economics, 54(2–3), 196–208. https://doi.org/10.1016/j.ecolecon.2004.12.029
- Shan, H. J. (2008). Reestimation of China's capital stock K. 1952-2006. Quantitative & Technical Economics, 25(10), 17–31.
- Sun, G. J., & Ding, Z. F. (2015). An empirical study on the influencing factors of China's economic growth efficiency. Statistics & Decision, 7(04), 125–128.
- Tone, K. (2001). A slacks-based measure of efficiency in data envelopment analysis. European Journal of Operational Research, 130(3), 498–509. https://doi.org/10.1016/S0377-2217(99)00407-5
- Wang, B., & Cheng, T. (2019). Space-time evolution of environmental total factor productivity of cities in the central region of China: Based on Malmquist-Luenberger productivity index method. Resources and Environment in the Yangtze Basin, 28(01), 48–59.
- Wang, Q., & Dong, Y. L. (2018). Research on the regional difference and distributional dynamic evolution of real economy development. Journal of Quantitative & Technical Economics, 35(05), 77–94.
- Wang, Q., Dong, Y., & Song, F. Q. (2022). Research on the regional difference and distributional dynamic evolution of real economy development. Statistics and Decision, 38(10), 97–101.
- Wang, Z. G., Gong, L. T., & Chen, Y. Y. (2006). China's regional differences in technical efficiency and the decomposition of total. Social Sciences in China, (02), 55–66 + 206.
- Wu, J. (2009). TFP growth and convergence across China's industrial economy considering environmental protection. Journal of Quantitative & Technical Economics, 26(11), 17–27.
- Wu, L., Jia, X. Y., Wu, C., & Peng, J. C. (2020). Impact of heterogeneous environmental regulation on green total factors productivity. China Population Resources and Environment, 30(10), 82–92.
- Xiang, X. D., & Lin, J. (2018). The evaluation of total factor productivity in China's industry under environmental restriction: Based on global network DEA- Malmquist index model. Science and Technology Management Research, 38(06), 60–68.
- Xu, T. (2018). Investigating environmental Kuznets curve in China–aggregation bias and policy implications. Energy Policy, 114, 315–322. https://doi.org/10.1016/j.enpol.2017.12.027
- Yan, S., & Cao, Y. M. (2020). Research on impact of environmental pollution on Chinese economic growth—From the view of expenditure on. Environmental Pollution Control. Environmental Science and Management, 45(03), 15–20 + 83.
- Yang, H., He, J., & Chen, S. (2015). The fragility of the environmental Kuznets curve: Revisiting the hypothesis with Chinese data via an “extreme bound analysis.” Ecological Economics, 109, 41–58. https://doi.org/10.1016/j.ecolecon.2014.10.023
- Yang, L., Liu, D. H., & Wei, Q. F. (2020). Research on the spatial-temporal differentiation of technological innovation and economic growth efficiency of urban agglomeration—Taking Chengdu urban agglomeration as an example. Reform of Economic System, (01), 43–52.
- Yang, W. J., & Long, R. Y. (2012). the green total factor productivity growth of regional industries in China: An empirical analysis with directional distance function. Shanghai Journal of Economics, 24(07), 3–13 + 21.
- Yang, J., & Shao, H. H. (2009). China's industrial growth under environmental constraints: An empirical analysis based on Malmquist-Luenberger Index. Quantitative & Technical Economics, 26(09), 64–78.
- Yang, W. J., & Wang, Q. (2022). Will reducing overcapacity help green total factor Productivity? A quasi-natural experiment based on China's industrial capacity reduction. Economic Issue, (07), 1–12.
- Yan, P. F., & Wang, B. (2004). Technical efficiency, technical progress & productivity growth: An empirical analysis based on DEA. Economic Research Journal, (12), 55–65.
- Yi, G., Fan, G., & Li, Y. (2003). A theoretical analysis on economic growth in China and total factor productivity. Economic Research Journal, (08), 13–20 + 90.
- Yu, Y. S., & Wei, P. (2012). Measurement of urban green total factor productivity in China. Ecological Economy, 37(03), 43–52.
- Yuan, Y. J., & Xie, R. H. (2015). FDI, environmental regulation and green total factor productivity growth of china’s industry: An empirical study based on Luenberger Index. Journal of International Trade, (08), 84–93.
- Zelizer, V. (2008). The real economy. Qualitative Sociology, 31(2), 189–193. https://doi.org/10.1007/s11133-008-9094-0
- Zhang, S., Chen, C., Huang, D. H., & Hu, L. (2022). Measurement of factor price distortion: A new production function method with time-varying elasticity. Technological Forecasting and Social Change, 175, 121363. https://doi.org/10.1016/j.techfore.2021.121363
- Zhang, H., & Gong, S. W. (2017). Calculation and analysis of industrial green total factor productivity based on DEA-Malmquist: A case study of Hubei Province. Journal of Jiangxi Normal University (Natural Science Edition), 41(05), 531–537.
- Zhang, D. C., Jiao, F. Y., & Zheng, X. Y. (2021). Temporal and spatial evolution analysis of economic growth power of major cities in Northeast China. Statistics and Decision, 37(23), 121–125.
- Zhang, L. J., & Ma, L. P. (2022). Digital economy, industrial structure upgrading and total factor productivity. Statistics and Decision, 38(03), 5–10.
- Zhang, X. F., & Tang, H. Y. (2022). Foreign direct investment quantity, quality and urban green total factor productivity: From the perspective of innovation capability. Journal of Henan Institute of Science and Technology, 42(07), 1–8.
- Zhang, J., Wu, G. Y., & Zhang, J. P. (2004). Estimation of provincial physical capital stock in China: 1952–2000. Economic Research, (10), 35–44.
- Zhang, S., Zhu, C., Li, X., Yu, X., & Fang, Q. (2022). Sectoral heterogeneity, industrial structure transformation, and changes in total labor income share. Technological Forecasting and Social Change, 176, 121509. https://doi.org/10.1016/j.techfore.2022.121509
- Zhu, C. L., Yue, H. Z., & Li, T. (2009). An empirical study on economic growth efficiency and affecting factors in China: 1985~2007. Journal of Quantitative & Technical Economics, 26(09), 52–63.
- Zhu, C. L., Yue, H. Z., & Shi, P. (2011). Studies on China's economic growth efficiency under the environmental constraints. The Journal of Quantitative & Technical Economics, (05), 3–20 + 93.