
 ?Mathematical formulae have been encoded as MathML and are displayed in this HTML version using MathJax in order to improve their display. Uncheck the box to turn MathJax off. This feature requires Javascript. Click on a formula to zoom.
Abstract
The subject of the research is the issue of understanding the values of well-being by three generations of age. The surveys were attended by 5,000 respondents. After evaluation using the Analytical Network Process (A.N.P.) method, when the significance of individual sub-criterion was compared, research questions about potential differences in well-being values were answered. Significant differences in view of well-being during the three generations have been identified. For the ‘youth’ group the evaluation of the finance criterion is significantly prevalent, a strong preference for community well-being is defined for the ‘grandparents’ group. For the ‘parents’ group the evaluation of the criteria is balanced. The existence of the U-shape was detected. The results provide further information to compare the understanding of well-being values, which differ not only within the national region, but also internationally. Practical implication lies in stimulating the debate about the need to know well-being, e.g., by employers and state institutions, not only at the local level, because this knowledge and subsequent relevant interventions bring benefits to all interest groups.
Keywords:
1. Introduction
Happiness and well-being are often defined as inner feelings or states of satisfaction. Therefore, well-being research focused on long-term happiness and life satisfaction of individuals (Marston et al., Citation2021). Happiness is a pleasant, transient experience that everyone can feel but cannot define. While life satisfaction is the way a person evaluates their life and how they feel about where they are going in the future. Happiness and life satisfaction are a solid basis for the development of subjective well-being throughout the life of an individual (Jaisri, Citation2016).
Well-being is a concept that even experts have a difficult time defining. Generally, it includes being content, being motivated to continue on the path that one is on, feeling, a sense of connection to people and institutions in one’s life, and feeling that various aspects of a person’s life are in balance (Ungvarsky, Citation2019). Well-being is about feeling good and functioning well and comprises an individual’s experience of their life; and a comparison of life circumstances with social norms and values (Sorribes et al., Citation2021). The term well-being is linked by economic and social aspects (Pacheco & Coello-Montecel, Citation2020).
There are differences in understanding happiness, satisfaction in life, or well-being for different ages, gender, and other determinants (e.g., Jaisri, Citation2016). Of these different determinants, the authors focused on age. The authors identified a research gap. This lies in the comparison of approaches to well-being values by the three generations, where research was conducted on all three generations simultaneously, moreover, at a time of pandemic. The aim is to identify the key differences in well-being ratings by each generation. Research questions have been formulated: Are there differences in the evaluation of well-being in three generations? If there are differences in the evaluation of well-being in three generations, in which criteria are the differences significant? Can U-shape be identified in the development of well-being in three generations?
The key results of selected research studies related to well-being and its measurement are presented in a theoretical introduction. The following is an overview of the methods used in the research and its procedure. Subsequently, the selected results are presented with commentary and discussion. The evaluations and suggestions for further research are the conclusion.
2. Theoretical view of well-being and its evaluation
To carry out the research and obtain relevant data, it is necessary to understand how well-being is understood by various experts and what elements these experts take into account when evaluating well-being.
The term well-being has many dimensions. This fragmentation creates an inconsistent basis for research. Having positive relationships, having control over your life, and having a sense of urgency are important attributes of well-being. Quick (Citation2018) lists five paths that lead to achieving quality well-being: being in touch with others, being active, constantly learning, notice and being able to give. Ungvarsky (Citation2019) involves in well-being a person’s energy level, calmness, involvement and connection with others, self-esteem and self-worth, feelings of competence and effectiveness, hopefulness for the future and general feelings of having a purpose and happiness. Other aspects that constitute well-being are identified by Ryff (Seifert, Citation2005): autonomy, environment, relationships, purpose in life, and self-acceptance. Vitale (Citation2019) formulated ingredients that include fulfilment, human connection, financial, mind/body, and community. As far as well-being itself is concerned, Wosczyk (Citation2020) talks about a feeling of sense, relations, finance, community, and physical condition.
Well-being is studied in two ways: Subjective well-being asks people directly how they think and feel about their own well-being and includes aspects such as life satisfaction (evaluation), positive emotions (hedonic), and whether their life is meaningful (eudemonic). Evaluative well-being refers to people’s own assessment of aspects of their life such as their income, health, relationship and leisure time. Hedonic approaches put greater emphasis on longer-term evaluations of life dimensions, less so on momentary emotions (Büchs & Koch, 2017). Hedonic well-being refers to emotions such as happiness, sadness, anxiety, anger, or pain (Wood et al., Citation2021).
Objective well-being is based on assumptions about basic human needs and rights, including aspects such as adequate food, physical health, education, safety, etc. It can be measured through self-report (asking people) or through more objective measures (e.g., mortality rates and life expectancy). Other indicators are proposed, e.g., by the O.E.C.D. or Warwick Medical School.
Based on long-term studies, Gallup identified significant key areas of well-being, namely, purpose, social, finance, health, and community. These different areas interact (PROTHEA, Citation2014). To measure well-being, they created the Global Well-Being Index (G.W.B.I.), which allows the comparison of both total well-being and individual areas at an individual, group, organisational, national, or global level. According to this index, people in individual areas either thrive (thriving; strong and steady well-being), struggle (struggling; average or unstable well-being), or suffer (suffering; low and unstable well-being).
More on Gallup's criteria:
Purpose (Career) Well-being includes meaningful and fulfilling everyday activities as motivation to achieve goals, as well as work, family, education, or hobbies.
McKnight and Kashdan (Citation2009) understand purpose as a cognitive process that defines life goals and provides personal meaning. They stress that focusing on and making progress toward life goals provides a significant source of engagement and meaning. According to Baumeister et al. (Citation2007), four main needs of meaning contribute to the overall sense of life: the need for purpose, values, a sense of efficiency and effectiveness, and the need for self-respect. When these needs are met, one perceives his life as meaningful. The output of Thoits (Citation2012) research is the communication that, theoretically, the more important a role-identity is to a person, the more it should provide a sense of purpose and meaning in life. Believing your life to be purposeful and meaningful should produce greater mental and physical well-being.
Social Well-being understands the quality of relationships as a condition for overall well-being, understands interaction with others as a tool to reduce stress and increase people's well-being.
Social relations are created in situations of cooperation, cohesion, but also conflict, and struggle (Baumeister et al., Citation2007). Gallup found a link between healthy social relationships and reduced injury healing time. They report that those who spend at least six hours socialising a day experience a reduction in stress and worry, and consequently an increase in well-being. This time socialising does not mean that employees are not working and it is not limited to the workday. Gallup clarifies that six hours of social time could include time at work, home, on the phone, talking to friends, sending emails, and other forms of communication. Warell (2012) points out that ‘digital communication can never replace face-to-face contact in building relationships – personal and professional’.
Financial Well-being presents managing your own economic situation, financial stability, and sufficient money as a condition to enable people to do what they want every day.
Joo and Garman (Citation1998) or Ab Wahab and Tatoglu (Citation2020) stated that financial well-being is the basic concept of financial health that can be measured through the level of tangible and nontangible aspects of financial security, the perception of financial stability, and the actual amount of financial resources. Highly significant factors in explaining subjective financial well-being are the inability to pay short-term expenses, including health care and daily living expenses, and the inability to maintain the existing living standard (Kiymaz & Öztürkkal, Citation2019). Financial literacy, socialisation, attitude, confidence, and financial behaviour have a positive effect on financial well-being, resulting research in the environment of university students (Setiyani & Solichatun, Citation2019). The issue of debt also arises in the context of finance (see, e.g., Tay et al., Citation2017).
Physical Well being – It is about overall mental and physical health, the amount of energy, allowing daily tasks to be completed, reducing fatigue, and increasing satisfaction through regular physical activity.
There are two ways of relationship between well-being and health: health influences well-being and well-being itself influences health (Department of Health, 2020). Sfeatcu et al. (Citation2014) support this view. They argue that well-being is in relation to health and vice versa; it is a determinant of health, but also a result of it. Many people lead a busy stressed-out life that puts health and wellness on the back (Mikkelsen et al., Citation2020). New lifestyles put pressure on overall health (for example, sleep deprivation, occupational stress, depression caused by loneliness, and social isolation despite a global connection with technology). These new pressures test human adaptability and question people’s overall satisfaction in life (Decoene, Citation2020).
Community Well-being means belonging and participation in life in an environment in which people move, donate, volunteer, educate others, treat them as a means of fulfilling positive emotions, and satisfying a sense of belonging.
The notion of community is widely understood as about something more than the sum of the parts but reflects the ways in which people feel and are well together (Atkinson et al., Citation2020). These researches point out that most frameworks for the term community well-being are based on the thesis that the primary interest is on how community aspects of life impact individual subjective well-being. This approach neglects social inequalities, multiple settings, and temporal choices and legacy, all of which constitute political dimensions to the well-being of the community. Levin and Arthurson (Citation2020) distinguish current community well-being, which contributes to community resilience, whereas community resilience is related to expectations about future community well-being. Community spirit and cohesion are another identified element.
Well-being is associated with numerous items related to family, work, health or social. Simply put, well-being includes aspects such as health, feelings of competence and purpose, connection to others, optimism, and financial status. Having a poor sense of well-being can limit a person’s ability to thrive and be productive (Ungvarsky, Citation2019).
Economists and behavioural scientists have studied well-being throughout a person's life. In dozens of countries, they examined elements of well-being, and found that well-being is high in youth, sinks to the bottom in middle age, and rises again in old age (e.g., Argyle, Citation2003). The reasons for this U-shape are still unclear (Weiss et al., Citation2012), yet Cheng et al. (Citation2017) claims that there is a great deal of evidence for the existence of a U-shape for the development of human happiness values in the middle ages. In addition, Galambos et al. (Citation2020) concluded that well-being is highest in young people aged 20–30 years, then decreases to the nadir in middle age, then rises with advancing age. This development is often cited as evidence of the midlife crisis. Jaisri (Citation2016) evaluated approaches to satisfaction levels among respondents aged 20 to 60 years. The results did not reveal any significant differences in their level of understanding of happiness. However, the oldest had the highest satisfaction with life, while the youngest felt the lowest satisfaction with life. Reker et al. (Citation1987) examined people at five stages from young adulthood to old-old age. Significant age differences were found on life dimensions: Life purpose increased with age; goal seeking and future meaning decreased with age; existential vacuum showed a curvilinear relationship with age. Blanchflower (Citation2020) draws comparisons between well-being and age across 132 countries and diagnosed the existence of U-shape in each of the countries. Otterbach et al. (Citation2018) analysed the differences of subjective well-being domains in three cohorts born 10 years apart. General life satisfaction, satisfaction with leisure time, social contact with friends, and family declined between the ages of 15 and 44. The most significant decrease occurs at a young age (early 20s). The two older cohorts evaluated family life and social contact more favourably than the youngest. Cultural specificities strongly influence the results of research. For example, in the research of Lambert et al. (Citation2020), age does not follow the usual U-shaped life satisfaction relationship in United Arab Emirates' (U.A.E.) citizens.
On the basis of the resources studied, it was decided to follow Gallup's criteria in the research. The elements in these criteria were formulated on the basis of the study of resources and the focus group method. The Analytical Network Process (A.N.P.) method will be used to determine the preferred types of well-being. Its network character will allow to capture the links between the sub-criteria more comprehensively, which will bring a more accurate view of the evaluated issue.
3. Methodology and methods of research
In the questionnaire, respondents compared the significance of each item within the criteria as career (purpose), social, financial, physical, and community well-being. For this purpose, the Saaty method was used. Saaty method of significance determination is the basis for decision-making methods A.N.P. applied here.
3.1. Saaty method
In this method of determing significance, the pairs are compared, and evaluation criteria are stored in the Saaty matrix S (Saaty & Vargas, Citation2012). The comparison between criteria specifies the extent of the preference, which is expressed as a certain number of points on the selected scale. The comparison determines whether one main criterion or sub-criterion is preferred to another, but also to what extent. Saaty recommends the use of the nine-point scale, where numerical rating of nine means extreme importance, and a rating of one means equal importance.
Before calculating the importance of the control criteria or sub-criteria, it is necessary to verify that the specified matrix of paired comparisons is mathematically consistent. The degree of consistency can be assessed in different ways, one of them being the consistency index (CI) defined as follows:
(1)
(1)
where λmax is the largest eigenvalue of the matrix S and n is the number of criteria.
The appropriate consistency index is called the random consistency index (RI). Comparison between consistency index (CI) and random consistency index (RI), using formula:
(2)
(2)
is called the consistency ratio (CR).
The matrix S is sufficiently consistent if the consistency ratio CR ≤ 0.1. The default procedure is based on calculating the eigenvector matrix v according to the following formula:
(3)
(3)
where λmax is the largest eigenvalue of the matrix S.
One of the more commonly used methods is the determination of weights using a weighted geometric average of the S rows of the decision matrix.
In the questionnaire, the respondents evaluated the significance of each item using prepared tables in Excel, where they immediately saw the results of their evaluations and the consistency of the results.
The following method was used to determine the order of well-being types (suffering, struggling, thriving).
The Analytic Network Process (A.N.P.) is a nonlinear model (). A simple network can be extended to complex multilevel networks. A network is comprised of main criteria, sub-criteria, and links between them. The whole system does to need not be equal to the sum of its parts. Due to synergy, it may be larger or smaller in the sense of contributing to a goal. A.N.P. solves the problem of dependence among alternatives or main criteria (Saaty & Vargas, Citation2012). Loop in a component indicates the inner dependence of the sub-criteria in that component with respect to a common properly.
Figure 1. The nonlinear structure of the ANP process.
Source: according to Saaty and Vargas (Citation2012).
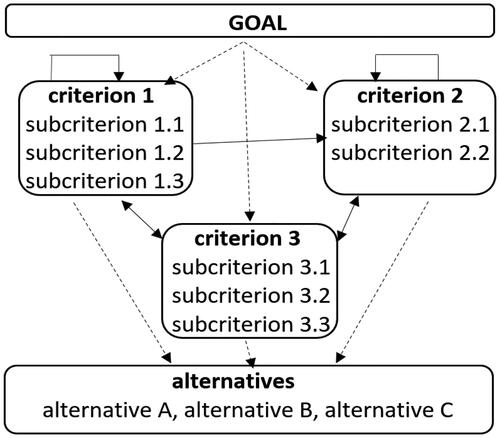
The first step in A.N.P. is structuring and model construction through brainstorming or other appropriate methods (Saaty & Vargas, Citation2012).
The second step is the pairwise comparison matrix and the priority vector. Pairs of decision sub-criteria in each main criterion are compared with respect to their importance towards their control criteria. The criteria themselves are also compared pairwise with respect to their contribution to the goal. The interdependencies among sub-criteria of different criteria must also be examined pairwise. A supermatrix of influence (unweighted supermatrix) is computed for each main criterion. In this matrix, local priorities for each sub-criterion within its main criterion can be identified. Local priority determines the importance of the sub-criterion within its main criterion.
The next step is to obtain global priorities in a system. Each of the supermatrices is weighted by the priority of its main criterion, and the results are the global priorities identified in the weighted supermatrix. Global priority delivers more valuable results than local priority because it determines the importance of the sub-criteria within the overall system.
A standard form for a supermatrix is as shown in the expression:
(4)
(4)
where W is a default supermatrix, W11 up to Wnn are the matrices that represent the impact of the criteria on each of the alternatives.
Raising a matrix to exponential power gives the long-term relative influences of the sub-criteria on each other. This new matrix is called the limit supermatrix. The final priorities of all sub-criteria in the matrix can be obtained by normalising each criterion of this supermatrix. After these steps, the selection of the best alternative can be made. The alternative with the highest overall priority should be selected.
3.2. Respondents
There are three basic sets of respondents. The first group of respondents were university students in full-time studies (‘youth’, Group I, the total number of students is 9,000). Therefore, the respondents were between the ages of 19 and 25, financially dependent on their parents, coming from different social backgrounds from all regions of the Czech Republic. The second group of respondents were their parents. That is, from about 45 to 55 years of age, active work, of different social backgrounds, doing different jobs in all regions of the Czech Republic (‘parents’, Group II). The third group were their grandparents. That is, retired, work nonactive, of different social backgrounds from all regions of the Czech Republic (‘grandparents’, Group III).
A random selection of respondents was made. The total number of addressees was 3,000 students and their parents and grandparents.
Primary quantitative research was conducted in the spring of 2020 using computer-assisted web interviewing (C.A.W.I.). See Appendix 1 for the questionnaire.
3.3. Questionnaire
In creating of the questionnaire, the authors relied on the literature review and the conclusions of the focus group method. The method was implemented during a conference in February 2020, when 20 conference participants were invited to participate in this group. The experts in the marketing department were consulted about the validity of the content. Item-level content validity index (I-C.V.I.) was used for clarity. To determine reliability using the split-half method, the authors followed the Kline, i.e., the reliability of the method should be at least 0.7 (Kline, Citation1993). Both indices met the prescribed criteria, and therefore the questionnaire was eligible to obtain valuable data. After completing the questionnaire, the pre-test with five full-time students and pilot survey with ten respondents from each group, a survey could be triggered.
After random selection, 3,000 students were approached at the same time as asking for the participation of their parents and grandparents. In the first round, they evaluated the significance of individual items using prepared excel tables. Finally, they filled out a prepared table where they marked the relationship between sub-criterions within the same main criterion and between sub-criterions in other main criteria. This provides the basis for creating a network model. In the second round, the respondents assessed the significance of the additional relationships established. After the exclusion of inconsistent or otherwise inappropriate data, the following number of responses was obtained from each group: Group I: 1852; II: 1459; and III: 1195 responses.
For further processing, it was necessary to select an indicator to determine typical data values. For this research, the most appropriate mode was found.
SuperDecision software was used to obtain the final result. This software was developed by the team of the creator of the A.N.P. method, T. Saaty.
4. Results of the research
Because of the large number of calculations, only one example of an assessment of the significance of sub-criteria is given (, ). As an illustration, an assessment of the significance of the individual criteria is given in relation to the stated objective, that is, the type of well-being for Group respondents I. This example is based on the values entered by respondents from Group I (youth) already reworked using Mod (x).
Figure 2. Evaluation of the significance of the criteria, Group I (youth).
Source: own research.
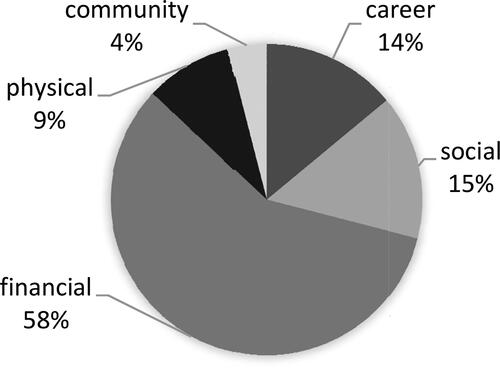
Table 1. Evaluation of the significance of the criteria (Group 1 – youth).
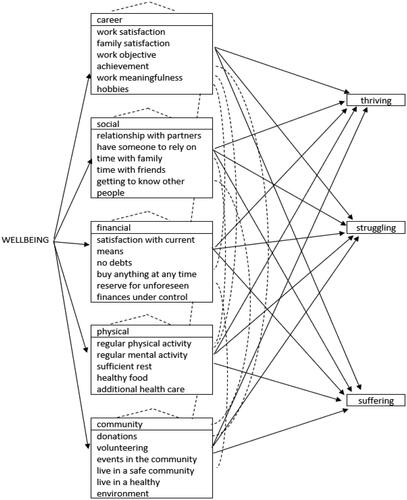
As mentioned earlier, towards the end of the first questionnaire, the respondent identified in the prepared table the interactions between sub-criteria within the same criterion or other criteria. The result of Group I's themes is shown in Appendix 2. The identified relationships are highlighted.
It is clear from the figure that, for example, the ‘work satisfaction’ (line) is affected by sub-criteria from the same main criterion Career (purpose) well-being: family satisfaction, achievement of work objectives, meaningful work and hobbies, then the sub-criteria from the main criterion Social well-being: relationships with partner, time with family and friends, etc. (see columns).
By processing defined relationships, a nonlinear network model was created ().
Figure 3. Well-being – network model ANP (Group I).
Source: own research.
To assess the significance of relationships between sub-criteria, again, due to a large number of calculations, only one is listed here, namely, from the respondent group 'Parents' for the element 'family satisfaction' (Appendix 3).
Furthermore, the results were transformed into mod. Appendix 4 list the selected global matrix results of all the respondents in all three monitored alternatives, including normalised matrices.
4.1. Alternatives to well-being
4.1.1. Suffering, low well-being
For those who were included in the low-level well-being group, the most important main criterion is community quality, namely, for Groups of respondents I and II. For the oldest respondents (III), the most important role is in the issue of finance.
Within the main criterion of C – career (purpose) well-being, Groups I and II prefer interests and hobbies. For youth, entertainment even includes 46% of the local criterion. Of course, its importance in global valuation decreased (8%), but it still retains its primacy. Although the importance of interest is lower for parents (33% and 4%), it is still high compared to most other sub-criteria in other main criteria. The position of Respondents III, for whom family satisfaction is the most important element, is different. Within the social well-being (S) youth are looking for a person, they could always rely on, and their parents prefer the possibility of getting to know other people. Grandparents stay with family values (relationships with partners, spouse). As a part of their finance management, youth want to have something 'for a rainy day’, their parents, as well as grandparents are worried about debt. Healthy food is most important to youth and their grandparents. Parents prefer additional health care. Furthermore, youth and their grandparents have the same approach to community well-being. Here, both groups prefer to live in a safe community, while parents choose a healthy environment within their home.
4.1.2. Struggling, unstable well-being
The main criterion of finance is of the greatest importance for Group I, unlike Groups II and III, who value health and care more (physical well-being).
Hobbies remain the most important for I within the main criterion of C – career (purpose), both locally and globally, as well as for their grandparents. For parents, significantness has shifted from hobbies to a happy family. In the S – social main criterion, there has been a shift in Groups I and II, which now place the greatest importance on relations with a partner. The grandparents have moved on from this relationship to time spent with family. For finance, youth are satisfied with the current state of the finances at their disposal, as are their grandparents. For parents, the fear of debt persists. Within the main criterion of physical well-being, healthy food remains the most important for young people, while their grandparents are also leaning towards this. Parents have moved from additional health care to regular physical activity, which is only marginally more important than mental activity. Living in a safe environment is a priority for all groups of respondents.
4.1.3. Thriving well-being
The relevance of the criteria for Groups I and II (finance and health) did not change compared to the struggling well-being status, for Group III it moved to community well-being.
Family values mediated by the family satisfaction element of the C – career main criterion dominate Groups I and II, while for Group III, it has surprisingly shifted to the hobby element. The existence of a reliable person is most important for Group I; for Group II, it is almost on par with the relationship with the partner, which is rated only slightly more significant. Grandparents rate the most significant element of time spent with friends. The possibility to buy anything and at any time through debt or hard work, is most important for youth. Parents are no longer worried about debt, but want to keep their finances under control. Whereas grandparents would prefer to reserve for unforeseen. In the field of health, the preferences of Groups I and II have not changed. Healthy food remains a priority for young people, while parents continue to prefer physical and mental activities, which are also highly rated by grandparents. A healthy environment for living is most important for Group I, Group II prioritised safety. For Grandparents, the most important element is to participate in the life of the community.
In Appendix 4, the relationships described are highlighted. The above comment is partially shown in .
Figure 4. The representation of criteria in the alternatives (undimi measureless unit).
Source: own research.
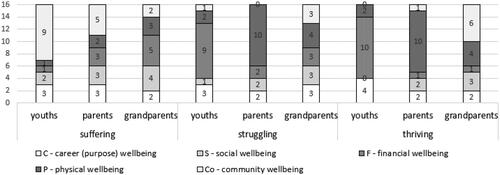
From the first point of view, there is a large imbalance in the representation of criteria in youth for all three types of well-being. For the grandparent, the greatest relative balance in the representation of the criteria can be identified.
5. Research questions and discussion
The third step in evaluating variants is, after the creation of an unweighted and weighted matrix to create a limited matrix and from this matrix normalised values that determine the preferences of alternatives.
5.1. Research question Q1
5.1.1. Are there differences in the evaluation of well-being in three generations?
Answer to Q1: Yes, there are significant differences in the concept of well-being values by age category.
The graphical expression of the alternative preference is in .
Figure 5. Alternative preference (%).
Source: own research.
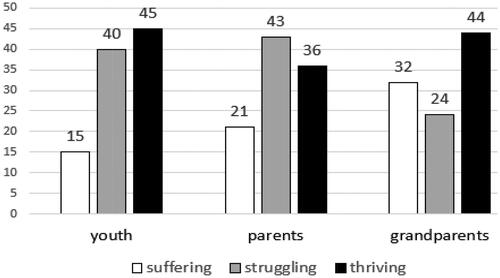
Preferences show that an older group of respondents, parents (II), no longer have such optimistic (or idealistic?) perceptions as youths (I). The alternative of stable and strong well-being is significantly lower than that of students. In the elderly, a higher value of the alternative of low and unstable well-being was found. On the other hand, grandparents (III) have a significantly higher degree of stable well-being than parents, although the type of suffering is the highest of all groups.
A different view of alternative preferences (well-being type) – according to respondents is in Appendix 5.
The increasing feeling of suffering is noticeable with increasing age. The oldest age group compared to other groups already has a fairly stable attitude towards well-being values; as they show the lowest struggling well-being value.
5.2. Research question Q2
5.2.1. If there are differences in the evaluation of well-being in three generations, in which criteria are the differences significant?
The representation of individual criteria in normalised values is significantly different () as well as the sub-criteria in individual criteria (). Sources are listed in Appendix 3.
Figure 6. Representation of individual criteria in normalised values (%).
Source: own research.
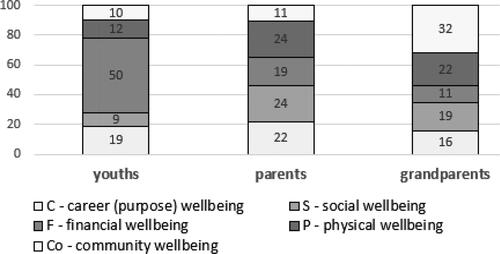
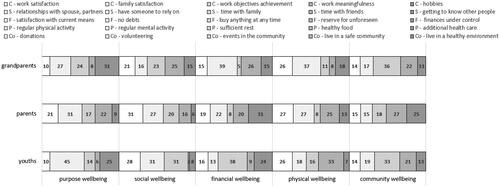
Figure 7. Significance of sub-criteria of individual main criteria in groups of respondents (normalised values) (%).
Source: own research.
Answer to Q2: Significant differences were found for the finance main criterion: 50% for I vs 19% for II vs 11% for III. On the contrary, the upward trend can be identified for the community main criterion: from 10% for I vs 11% for II vs 32% for III. The values of the main criterion for the Parent group are the most balanced.
From the figure you can see how the acquired life experience affects the movement of values of individual sub-criteria of well-being.
5.2.2. Purpose criterion
Having a harmonious and happy family is the most important thing for Groups I and II. The oldest Group of respondents (III) appreciates the importance of family satisfaction but puts more emphasis on hobbies.
Furthermore, youth prefer hobbies at the expense of meeting work goals (a source of income, even if the main income is support from parents), which is slightly more important than satisfaction at work or meaningful work.
This is different from parents who want to be satisfied at work and want to do meaningful work and it is even more important to them than performing work tasks. Unfortunately, however, unlike the young, parents underestimate the importance of hobbies and out-of-work interests.
Performing work tasks is important for grandparents no matter how meaningful the work is or how satisfying the work is for them.
5.2.3. Social criterion
Relationships with a partner are closely related to harmony and satisfaction in the family. Therefore, it is logical that, even in the second main criterion, the family element is highly assessed for Groups I and II as well as the existence of a reliable person. Group III is out of control, and spending time with friends is of a little more importance than spending time with family.
The striking feature is the low significance of the element of spending time with friends of youth. In the context of the high importance young people place on having their interests, it might be interesting to see why these two sub-criteria are in such conflict. Does this have to do with the type of hobbies? Are the predominant hobbies of young people mostly individualised? Do they not need a collective or friends? Is the virtual environment prevailing in their social life?
The desire to meet other people is highest among the oldest group of respondents.
5.2.4. Financial criterion
Buying anything, anywhere, at any price (hard work or debt) is the most important element for young people. More research would merit a relationship between this longing for total financial independence and proclaimed satisfaction in the families of young people who are financially dependent on their parents. There seems to be a lack of a higher level of financial literacy, as pointed out by the research by Setiyani and Solichatun (Citation2019). The second place is the management of finances, which is a more responsible approach. Having a reserve is considered to be the least significant.
The parents have already reconsidered their demands for finances and their acquisition, and for them the most important thing is to have control over the finances, to be able to manage them and live without debts with some finance reserves.
Not having debts is significantly the most important thing for grandparents. In the second place, one has to own a financial reserve for unexpected expenses.
5.2.5. Physical criterion
Healthy foods and healthy eating in general, which are significantly preferred by young people, can be related to the marketing of companies that promote healthy, organic, fresh and similar foods and are becoming an almost fashionable trend. Regular physical activity is considered important. Regular mental activity is put on the same level as rest. They significantly do not trust additional physical care.
In parents, the issue of physical criteria is divided more evenly, but with an underestimate of sufficient rest. The underestimate of the importance of sufficient rest, as well as the absence of one's own hobby, can have a negative effect on the understanding of overall well-being.
Maintaining mental freshness is the most important thing for the grandparents. At the same time, they also want to be physically active. The appreciation of additional health care is increasing. The unwillingness to change eating habits and eat healthy increased significantly.
5.2.6. Community criterion
Engaging in the life of the community in the place where they live is considered by the young people as the most important element in this area. This finding is contradictory to the low importance of sub-criteria of the social main criterion, which is spending time with friends and getting to know other people.
There is also a contradiction in noting how important healthy food is, but living in a healthy environment is rated as the least significant element in this criterion.
Parents are more interested in living in a safe and healthy environment. Materiality among other sub-criteria is not significant.
The oldest respondents, like the young, want to participate in the events and life of the community. Next, they want to feel safe. They are willing to take actions to help others. The issue of living in a healthy environment is no longer so interesting for them.
5.2.7. Brief summary
Youth: They value a happy family with whom they spend their time, want to have someone they can rely on at any time, be able to buy anything and at any time, even at the cost of hard work or debt, prefer healthy food and want to participate in community life.
Parents: Family satisfaction and relationships with spouses are the most important for them, they want to have finances under control, to be able to manage them, perform regular physical and mental activities, and want to live in a safe community.
Grandparents: want to have hobbies, spend time with friends, be debt free, mentally fresh, and participate in the life of their community.
The peaks of the differences are quickly identifiable from .
Figure 8. The evaluation of well-being sub-criteria by different age groups.
Source: own research.
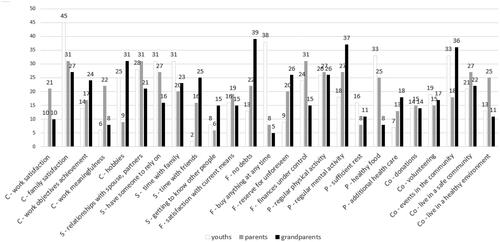
From the results, it can be concluded that parents are a generation that has already 'calmed down', gained life experience, and wants to create a stable environment for themselves and their family. Grandparents, perhaps based on the experience gained, have fulfilled their parental duties, want to take advantage of the regained freedom, and live their lives according to themselves.
What is interesting is the more even the distribution of significance across all types among groups of older respondents: is it due to life experience?
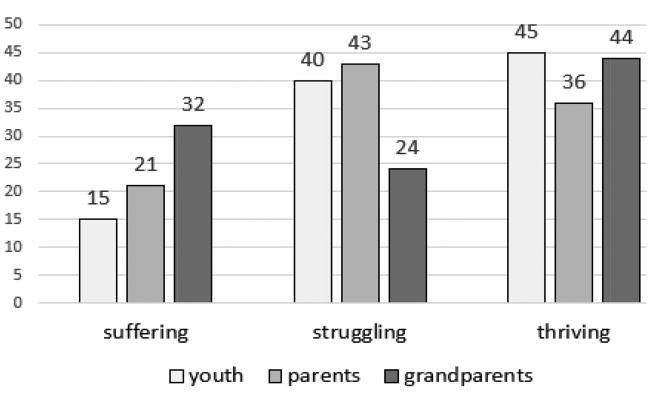
5.3. Research question Q3
5.3.1. Can U-shape be identified in the development of well-being in three generations?
Answer to Q3: Yes, the U-shaped was identified. Looking at , the shape of the potential curve is clearly visible: thriving well-being values 45 – 36 – 44.
The results of the research are partly consistent with research supporting the existence of the U-shape in well-being evaluation, supporting the downward trend of well-being in the context of increasing age into middle age. However, the level did not drop to the bottom, that is, the type of low suffering well-being does not prevail. After that, the level of understanding of the values of well-being in the third group rose again, and in grandparents again the type of thriving prevails.
5.4. Comparison with the results of other research and implications
Moreover, it can be concluded that even the representation of individual main criteria (and sub-criteria, too) in different types of variants has significant differences in different age groups; see .
Theoretical contribution: The findings provide additional evidence on the growing literature on well-being and its evaluation. It will provide more information to compare the understanding of well-being values, which differ not only within the national region, but also internationally. Additionally, the sub-criteria fulfilling the individual criteria of well-being are different and reflect the specifics of the countries concerned. Their analysis and comparison could provide a more precise definition of the criteria and their sub-criteria to provide a more balanced basis for comparing the results obtained in the international environment. The identified U-shape also implies a contribution to theoretical research.
The period in which the research was conducted is both a limitation and a contribution to theoretical research. At the same time, it is an incentive to conduct comparative research in the period of overcoming the crisis.
Practical contribution: The outputs point to large differences in the perception of well-being through generations. This should encourage greater interest in the identification of well-being, e.g., by employers, state institutions, not only at the local level, etc.
Why should an employer be familiar with the well-being of its employees? The well-being of every employee of the company is essential to achieve the objectives of the organisation. By disregarding the well-being of workers, the ability of the organisation to grow, as well as the credibility of managers in the eyes of their subordinates, decreases.
Why should the local government be familiar with the well-being of locals? If we leave out the desire to be re-elected, interventions in the locality can affect the influx or departure of residents, support for local business in the locality, etc. Ultimately, the consequences of these interventions are likely to be felt in the economy.
Why should the relevant ministry or other state institutions be familiar with the well-being of pensioners, women on maternity leave, minorities, etc? Policymakers may provide services and allocate funds to increase literacy or security in the desired area, triggering greater social and civic involvement, monitor the effects of their actions on health or economic welfare, etc.
6. Conclusion
The subject of the research so far has been a neglected issue of well-being in the Czech Republic. Meanwhile, people with higher well-being are healthier, more productive, more resistant to stress, and better at facing challenges. More easily deal with natural disasters or social crises, cope more quickly with sudden events, and more willingly help and contribute in various ways to the development of communities, organisations, and society (PROTHEA, Citation2014).
The aim was to identify the key differences in well-being ratings by three generations. Research questions have been formulated: Are there differences in the evaluation of well-being in three generations? If there are differences in the evaluation of well-being in three generations, in which criteria are the differences significant? Can U-shape be identified in the development of well-being in three generations?
Data were obtained electronically from respondents, who were students, their parents, and grandparents. The A.N.P. method was used for their processing. The local, global, limit, and normalised element values were calculated to obtain the preferred alternative.
The key findings are as follows. Three generations have significant differences in view of well-being. For the ‘Youth’ group, the evaluation of the main financial criterion is significantly prevalent, for the ‘Grandparents’ group, there is a strong preference of community well-being. For the ‘Parents’ the evaluation of the criteria is balanced. It is the only evaluation of the main criterion of community well-being that has the lowest value that is significantly out of the way. Large differences were also identified in the individual items of the main criteria. The U-shape was identified when comparing well-being values in three generations.
The research was limited by the period for which it was carried out, at the time of the Covid-19. It is likely that in another period the results would have been different. Another limitation was the fact that the results were not tracked from other aspects, e.g., gender, region, social, cultural, and economic background of the family. This sorting could yield interesting results.
Despite limitations, the results are particularly useful from a social point of view, giving insight into the perception of well-being by a relatively large sample of respondents. The authors would see the greatest benefit if the article acted as an appeal to determine the level of well-being, e.g., in organisations or regions near the local government. In these specific cases, actions to increase well-being could lead, for example, to improve workplace performance or improve the quality of life in the region.
Disclosure statement
No potential conflict of interest was reported by the authors.
Additional information
Funding
References
- Ab Wahab, M., & Tatoglu, E. (2020). Chasing productivity demands, worker well-being, and firm performance. Personnel Review, 49(9), 1823–1843. https://doi.org/10.1108/PR-01-2019-0026
- Argyle, M. (2003). Causes and correlates of happiness. In D. Kahneman, E. Diener, & N. Schwarz (Eds.), Well-being: The foundations of hedonic psychology (pp. 307–322, 353–373). Russell Sage.
- Atkinson, S., Bagnall, A. M., Corcoran, R., South, I., & Curtis, S. (2020). Being well together: Individual subjective and community wellbeing. Journal of Happiness Studies, 21(5), 1903–1921. https://doi.org/10.1007/s10902-019-00146-2
- Baumeister, R. F., Vohs, K. D., & Tice, D. M. (2007). The strength model of self-control. Current Directions in Psychological Science, 16(6), 351–355. https://doi.org/10.1111/j.1467-8721.2007.00534.x
- Blanchflower, D. G. (2020). Is happiness U-shaped everywhere? Age and subjective well-being in 132 countries [NBER Working Paper 26641]. https://doi.org/10.3386/w26641.
- Büchs, M., & Koch, M. (2017). Postgrowth and wellbeing – Challenges to sustainable welfare. Palgrave Macmillan. doi https://doi.org/10.1007/978-3-319-59903-8
- Cheng, T. C., Powdthavee, N., & Oswald, A. J. (2017). Longitudinal evidence for a midlife nadir in human well-being: Results from four data sets. Economic Journal (London, England), 127(599), 126–142. http://search.ebscohost.com/login.aspx?direct = true&db = eoh&an=1635458&scope = site.
- Decoene, U. (2020). The future of mind health and well-being. AXA Foresight report. Retrieved July 15, 2020, from https://www-axa-com.cdn.axa-contento-118412.eu/www-axa-com%2Ff17bea38-2898-4a03-abe3-7254b27d9339_axa_foresight_mindhealth_vdef.pdf
- Department of Health. (2020). The relationship between wellbeing and health. A Compendium of Factsheets: Wellbeing Across the Lifecourse. Retrieved July 12, 2020, from https://assets.publishing.service.gov.uk/government/uploads/system/uploads/attachment_data/file/295474/The_relationship_between_wellbeing_and_health.pdf
- Galambos, N. L., Krahn, H. J., Johnson, M. D., & Lachman, M. E. (2020). The U shape of happiness across the life course: Expanding the discussion. Perspectives on Psychological Science, 15(4), 898–912. https://doi.org/10.1177/1745691620902428
- Hill, P. L., Burrow, A. L., Brandenberger, J. W., Lapsley, D. K., & Quaranto, J. C. (2010). Collegiate purpose orientations and well-being in early and middle adulthood. Journal of Applied Developmental Psychology, 31(2), 173–179. doi: https://doi.org/10.1016/j.appdev.2009.12.001
- Jaisri, M. (2016). Happiness and satisfaction with life among adults. Indian Journal of Positive Psychology, 7(1), 84–87. http://search.ebscohost.com/login.aspx?direct = true&db = asn&an=115135334&scope = site
- Joo, S., & Garman, E. T. (1998). The relationship between personal financial wellness and employee productivity: A conceptual model. Personal Finances and Worker Productivity, 2(2), 162–171.
- Kiymaz, H., & Öztürkkal, B. (2019). Perceived financial needs, income sources, and subjective financial well-being in an emerging market. Journal of Financial Counseling and Planning, 30(2), 191–201. https://doi.org/10.1891/1052-3073.30.2.191
- Kline, P. (1993). The handbook of psychological testing. Routledge.
- Lambert, L., Karabchuk, T., & Joshanloo, M. (2020). Predictors of life satisfaction in the United Arab Emirates: Results based on Gallup data. Current Psychology, 38, 345–363. https://doi.org/10.1007/s12144-020-00873-3
- Levin, I., & Arthurson, K. (2020). Living closely: Residents‘ health and wellbeing in small multi-owned residential buildings. Property Management, 38(3), 345–3636. https://doi.org/10.1108/PM-03-2019-0013
- Marston, H. R., Niles-Yokum, K., & Silva, P. A. (2021). A commentary on blue zones (R): A critical review of age-friendly environments in the 21st century and beyond. International Journal of Environmental Research and Public Health, 15(2), article no. 837. https://doi.org/10.3390/ijerph18020837
- McKnight, P. E., & Kashdan, T. B. (2009). Purpose in life as a system that creates and sustains health and well-being: An integrative, testable theory. Review of General Psychology, 13(3), 242–251. https://doi.org/10.1037/a0017152
- Mikkelsen, E. N., Gray, B., & Petersen, A. (2020). Unconscious processes of organizing: Intergroup conflict in mental health care. Journal of Management Studies, 57(7), 1355–1383.
- Otterbach, S., Sousa-Poza, A., & Moller, V. A. (2018). Cohort analysis of subjective wellbeing and ageing: Heading towards a midlife crisis? Longitudinal and Life Course Studies, 9(4), 382–411. https://doi.org/10.14301/llcs.v9i4.509
- Pacheco, P. O., & Coello-Montecel, D. (2020). The Working Conditions Questionnaire: Cross-cultural validation and scale refinement in six Ibero-American countries. Employee Relations. https://doi.org/10.1108/ER-05-2020-0240
- PROTHEA. (2014). Co je wellbeing? Retrieved July 12, 2020, from http://prothea.cz/blog/co-je-wellbeing/
- Quick, A. (2018). Measuring wellbeing inequality. What are the appropriate indicators of wellbeing inequality? Retrieved July 12, 2020, https://neweconomics.org/2018/05/measuring-wellbeing-inequality
- Reker, G. T., Peacock, E. J., & Wong, T. P. (1987). Meaning and purpose in life and well-being: A life-span perspective. Journal of Gerontology, 42(1), 44–49. https://doi.org/10.1093/geronj/42.1.44.
- Saaty, T. L., & Vargas, L. G. (2012). Models, methods, concepts & applications of the analytic hierarchy process. 2nd ed. Springer.
- Seifert, T. A. (2005). The Ryff scales of psychological well-being. https://centerofinquiry.org/uncategorized/ryff-scales-of-psychological-well-being/
- Setiyani, R., & Solichatun, I. (2019). Financial well-being of college students: An empirical study on mediation effect of financial behavior [Paper presentation]. In International Conference on Economics, Education, Business and Accounting, KnE Social Sciences, 451–474. https://doi.org/10.18502/kss.v3i11.4026
- Sfeatcu, R., Cernuşcă-Miţariu, M., Ionescu, C., Roman, M., Cernuşcă-Miţariu, S., Coldea, L., Bota, G., & Burcea, C. C. (2014). The concept of wellbeing in relation to health and quality of life. European Journal of Science and Theology, 10(4), 123–128.
- Sorribes, J., Celma, D., & Martinez-Garcia, E. (2021). Sustainable human rsources management in crisis contexts: Interaction of socially responsible labour practices for the wellbeing of employees. Corporate Social Responsibility and Environmental Management, 28(2), 936–952. https://doi.org/10.1002/csr.2111
- Tay, L., Batz, C., Parrigon, S., & Kuykendall, L. (2017). Debt and subjective well-being: The other side of the income-happiness coin. Journal of Happiness Studies, 18(3), 903–937. https://doi.org/10.1007/s10902-016-9758-5
- Thoits, P. A. (2012). Role-identity salience, purpose and meaning in life, and well-being among volunteers. Social Psychology Quarterly, 75(4), 360–384. https://doi.org/10.1177/0190272512459662
- Ungvarsky, J. (2019). Well-being. Salem Press Encyclopedia of Health.
- Vitale, N. (2019). Why total wellbeing? (And why should HR and people teams integrate wellbeing into their cultures?). Workforce Solutions Review, October-December, 19–21. Retrieved June 20, 2020, from http://search.ebscohost.com/login.aspx?direct=true&db=bsu&AN=141062323&lang=cs&site=ehost-live
- Weiss, A., King, J. E., Inoue-Murayama, M., Matsuzawa, M., & Oswald, A. J. (2012). Evidence for a midlife crisis in great apes consistent with the U-shape in human well-being. Proceedings of the National Academy of Sciences of the United States of America, 109(49), 19949–19952. https://doi.org/10.1073/pnas.1212592109
- Wood, N., Hardy, R., Bann, D., Gale, C., & Stafford, M. (2021). Childhood correlates of adult positive mental well-being in three British longitudinal studies. Journal of Epidemiology and Community Health, 75(2), 177–184. https://doi.org/10.1136/jech-2019-213709.
- Wosczyk, P. (2020). Wellbeing programs from the perspective of age: What should attract our attention? “Age power” test results. Human Resource Management/Zarzadzanie Zasobami Ludzkimi, 2(133), 131–143. https://doi.org/10.5604/01.3001.0014.0758
Appendix 1.
Questions in the questionnaire
Appendix 2.
Links between sub-criteria
Table
Appendix 3.
Evaluation of the significance of the element 'family satisfaction' (Group II, parents)
Appendix 4.
Selected calculation results for monitored age groups and well-being types (values from globalised and normalised matrix)
Table
Appendix 5.
Representation of age groups in individual types of well-being
[ ]
]
Source: own research.