
 ?Mathematical formulae have been encoded as MathML and are displayed in this HTML version using MathJax in order to improve their display. Uncheck the box to turn MathJax off. This feature requires Javascript. Click on a formula to zoom.
Abstract
The idea that the wage gap (W.G.) between the public sector (P.U.S.) and private sectors (P.R.S.) has widened is a point of contention among scholars, but to date, there has been no systematic discussion of changes in the W.G. and their causes in China. This article combines data from China’s Urban Household Survey (U.H.S.) for 2004, 2008 and 2013 to examine changes in between-sector W.G.s and identify the causal factors by wage decomposition methods. Using ordinary least squares and a Heckman sample selection model, this study finds that public-sector workers consistently earn more than private-sector workers and that the W.G. is expanding, especially in upstream industries where state-owned enterprises (S.O.E.s) have monopoly status. In addition, the Oaxaca–Blinder (O.B.) decomposition method is adopted to reveal that the characteristic effect is the main cause of the W.G. Further, the regression and decomposition of the recentered influence function show that the effect of characteristics and coefficient effects differ across wage quantiles. This article indicates that the intersectoral W.G. in China is widening mainly as a result of differences in labour endowments and provides evidence to support government decision-making.
1. Introduction
There is a long-standing interest in the public sector (P.U.S.) because of its huge size, its ability to formulate and implement social management policies, and that it provides numerous jobs. The wage gap (W.G.s) between the P.U.S. and private sectors (P.R.S.) is widely discussed in the literature (e.g., Alesina et al., Citation2002), as it directly affects workers’ choices between sectors and the resulting differential among social classes. In recent years, Chinese college graduates have preferred to become civil servants or take up positions with state-owned enterprises (S.O.E.s). The W.G. between P.U.S. and P.R.S. is commonly recognised as responsible for this phenomenon.
For reasons of history (e.g., a Soviet system) and ideology (e.g., socialism), China’s transition from a planned to a market economy has seen P.U.S. and P.R.S. differ in their wage-determination mechanisms as a result of the differences in the forms of ownership. Workers often earn wage premiums in the P.R.S., and an unreasonable inter-sector W.G. causes an inefficient allocation of human capital. With China entering a critical period in its ownership reform, an important part of the change in the income distribution system is the increasing attention given to P.U.S. wages.
This P.U.S. reform involves important issues such as government efficiency, income redistribution and optimal resource allocation, and setting suitable wages is essential. The low wages in the P.U.S. may lead to the departure of high-quality employees under the influence of the market economy, thereby reducing the quality of public services and the government’s management capabilities. Conversely, the high wages in the P.U.S. mean that the government needs to spend a greater proportion of taxes received on employee wages, which is not conducive to efficient resource allocation.
The current ownership reforms in China have not been effective because the P.U.S. still controls most basic factors of production (e.g., land, electricity, energy, communications, finance, transportation). On the one hand, S.O.E.s reforms have increased their market competitiveness and monopoly power which makes the market mechanism to determine wages in the P.U.S. weaker; on the other hand, the formation of interest groups and their control over market opportunities have squeezed the market opportunities and profit margins of the P.R.S. These factors limit the ability of the PRS market to capture the corresponding returns.
This article focuses on three questions: (1) How large is the W.G., and how does it change between the P.U.S. and P.R.S. since China’s reforms of the twenty-first century? (2) Is the W.G. typical of SOEs with monopolistic status? (3) What factors are responsible for the WG? In response to these three questions, this study tests the following four hypotheses:
Hypothesis 1: There is a W.G. between the P.U.S. and P.R.S. that is expanding over time.
Hypothesis 2: The P.U.S., which is concentrated in upstream industries and contains monopolies, has greater internal W.G.s than the P.R.S.
Hypothesis 3: The W.G. between the P.U.S. and P.R.S. is mainly caused by characteristic effects.
Hypothesis 4: In different income quantiles, the characteristic effects causing the W.G. between the P.U.S. and P.R.S. are different.
The rest of this article is structured as follows. Section 2 reviews the important literature that elaborates on the W.G. between sectors. Section 3 describes the basic framework of the empirical analysis and introduces both the data source and descriptive statistics. Section 4 provides the results of regression analysis and the wage decomposition approaches. Section 5 summarises the full text, considers the usability of the results, and provides relevant policy recommendations.
2. Literature review and hypotheses
2.1. W.G. in developed countries
The main discussion of the P.U.S. wage premium was initiated by scholars in developed countries. Shapiro and Stelcner (Citation1989) identify the P.U.S. wage based on Canadian census data and decompose the W.G. into endowment and residual differences. For Germany, Dustmann and van Soest (Citation1998) find no premiums on wages for the P.U.S., for which wages are significantly lower. Krueger (Citation1988) carries out an empirical study on U.S. panel data and finds that the average salary of federal employees is 10–25% higher than that of P.R.S. employees. Mueller (Citation1998) supports Krueger (Citation1988) on the basis of Canadian data, although their findings are not universally accepted. Van der Gaag and Vijverberg (Citation1988) and Vanophem (Citation1993) use Heckman sample selection to study the W.G. between the P.U.S. and P.R.S., considering the possible endogeneity when individuals choose to work in different sectors. Cho et al. (Citation2010) compare the W.G. between the P.U.S. and P.R.S. in the U.S. and South Korea, revealing huge differences between countries. In the U.S., P.R.S. employees have higher hourly wages but work slightly more hours than those in the P.U.S., while in Korea, P.R.S. employees have lower hourly wages and work more hours than those in the P.U.S.
2.2. W.G. in developing countries
The intersectoral W.G. in developing countries has attracted increasing academic attention in recent years, especially in Asia and Africa. Using nationally representative household surveys from 68 developing countries, Gindling et al. (Citation2020) find that the P.U.B. typically contributes a wage premium. Hyder and Reilly (Citation2005) use quantile regression to analyse Pakistani data and find that the wages of P.U.S. are higher than those of P.R.S., with the difference decreasing as the percentile of wage distribution increases within the sector. Further, Hakro et al. (Citation2021) find that individuals with higher levels of education are more likely to choose the P.U.B. in Pakistan and that the W.G. is reflected in higher income levels. Clark et al. (Citation2021) use data from Malaysia to show that wages are higher for P.U.B. employees and that gender and racial wage differentials have declined.
Kahyalar et al. (Citation2018) emphasise that education and experience are key determinants of the W.G. Meanwhile, Dao et al. (Citation2022) examine the impact of COVID-19 in Vietnam and show that the pandemic has increased the intersectoral W.G. For transitional countries, the W.G. between the P.U.S. and P.R.S. may constantly change, and cross-sectional or panel data with shorter time series may differ significantly. In recent years, several scholars have recognised this problem. Imbert (Citation2013) uses Vietnamese panel data from 1993 to 2006 and finds that, in the first stage (1993–1998), the wages of P.U.S. workers with technical advantages are lower than those of P.R.S. workers, but the reverse is true in the second stage (2002–2006).
Research on the intersectoral W.G. in Africa has recently seen rapid growth. Botchway and Asiedu (Citation2020) analyse the Ghanaian labour market for the period 2009 to 2015 and find that the employee characteristics observed explain only 36% of the intersectoral W.G., which is mainly reflected in respect of lower-wage groups. El-Haddad and Gadallah (Citation2021) and Shahen et al. (Citation2020) investigate the case of Egypt using R.I.F. and O.B. decomposition and find a widening intersectoral W.G. The analysis of Aderemi and Alley (Citation2019) also shows that the W.G. between sectors is concentrated in the low-income group because of educational differences between workers in the respective sectors. Kwenda and Ntuli (Citation2018) similarly confirm the W.G. in South Africa using cross-sectional data and show that the W.G follows an inverted U-shaped distribution.
2.3. Wage gap in China
Although China has officially been engaged in reform and opening since 1978, the discussion of the WG between sectors has mainly emerged in the twenty-first century. Scholars analyse it from different perspectives and over different time periods, but the studies are not systematic and even reach contradictory conclusions.
Demurger et al. (Citation2012) analyse the change of W.G. between two sectors in 2002 and 2007 for local residents in urban China and find that the W.G. between the sectors declined over the period, which also means the trend of convergence was in favour of the P.R.S. and semi-P.U.B. However, Nawakitphaitoon et al. (Citation2016), using the U.H.S., find that in the mid-2000s and following sectoral reforms, the average earnings of workers in the P.U.S. were much higher than their counterparts, and the difference tended to widen over time.
Liu et al. (Citation2017) use a multilevel approach with microdata from 1% of the total population to show that the W.G. varies considerably across regions because of the interaction between market expansion and state intervention. Song (Citation2016) uses a difference-in-difference estimation and shows that in urban China, the P.U.B. discriminates more against rural hukou holders than the P.U.B. Whalley and Xing (Citation2016) make it clear that wages in the P.U.B. are increasing more rapidly than those of the P.R.S. If additional labour is allocated to the P.R.S., urban wage inequality may widen further. Wang and Xie (Citation2015) and Xiao et al. (Citation2022) evaluate both income and happiness and find that the P.U.B. employees report significantly higher levels of happiness than their P.R.S. peers. Gustafsson and Wan (Citation2020) caution that foreign firms also carry a revenue premium that may need to be considered separately.
Li et al. (Citation2015) build a general equilibrium model to show that the P.U.S. is concentrated in upstream industries and has monopoly status, concluding that upstream S.O.E.s will gain rent through monopoly status. Lin (Citation2021) points out that Chinese S.O.E.s are concentrated in the monopolistic industries of water, electricity, gas, telecommunications, roads, railways, ports and financial institutions. Lin et al. (Citation1998) and Xu (Citation2011) demonstrate that the central government has attempted to improve S.O.E. performance while maintaining state ownership and control over a significant swath of the economy. Xu et al. (Citation2015) examine labour compensation in the industrial sector from 2005 to 2010 and find both S.O.E.s and non-domestic firms pay higher wages than private firms. Similarly, Sun et al. (Citation2021) use provincial data from 1993 to 2013 to find that overall inequality increases while the share of S.O.E.s in the economy decreases. Liu et al. (Citation2017) examine government regulation of industries and find that regulation increases the W.G. between the monopolistic and non-monopolistic sectors of the state, while strong redistributive power increases the wage premium. Sun (Citation2018) finds that recruitment of high-quality labour by S.O.E.s is associated with the industrial composition of S.O.E.s. Further, Ma (Citation2018) observes that the W.G. declines, and the effect of individual characteristics increases from 35.23% in 1995 to 74.51% in 2007.
3. Methodology and data
China’s industrial structure and occupational classification have undergone several profound changes in the twenty-first century, resulting in inconsistent statistics calibration that leads to difficulties during data processing. In particular, cross-provincial and cross-city macro data are difficult to obtain. The micro-level data in this study are obtained from the China U.H.S. conducted by the Economic Survey Team of the National Bureau of Statistics of China through public access provided by the Tsinghua–China Data Center.
3.1. Methodology
This study estimates the effect of the specific sector on wages with reference to the settings in Krueger (Citation1993):
(1)
(1)
where
is the logarithmic form of the annual income and the core explanatory variable
represents the labour sector, including P.U.S. and P.R.S.;
represents the control variables, including personal characteristics (e.g., gender, marital status, province), human capital characteristics (e.g., education and work experience) and job characteristics (e.g., occupation and industry); and
represents the salary premium in a particular sector. The differences in wage structure between the two sectors are clarified using wage functions. Sample selection bias is avoided using the selectivity-bias corrected wage function model (Heckman, Citation1979). The married dummy serves as an identification variable.
The estimated results of the distribution function and the density function of the sector selection probability are used to calculate the correct item-named adverse Mill’s ratio (). Two decomposition methods are used to estimate determinants of wage differentials. The first is the O.B. decomposition based on variable means (Blinder, Citation1973; Oaxaca, Citation1973). The income of workers is expressed as
for PUS and as
for PRS.
Assuming that income is determined by productivity conditions, then:
(2)
(2)
where
and
represent factors related to productivity conditions (determinant) of P.U.S. and P.R.S., such as education level, working years and working hours;
and
are the wage return coefficients for P.U.S. and P.R.S. in the labour market, respectively; and notably,
cannot be directly understood as sectoral discrimination. The counterfactual group is constructed as ‘P.R.S. workers who are considered to work in the P.U.S.’ (
) in the labour market. The income of this group is expressed as
with the basic setting as their remuneration. Therefore, the WG between sectors can be decomposed as:
(3)
(3)
where the interpretable part is
that is, the W.G. generated under different productivity conditions (e.g.,
). The unexplainable part is
that is, W.G. generated under different departmental return coefficients (e.g.,
), which can be understood as sectoral discrimination.
However, the above analysis is limited to cross-sectional data and does not further examine the wage distribution. Moreover, an imbalance may occur in the income distribution among departmental employees; that is, the P.R.S. may exhibit more serious income polarisation than the P.U.S. on the basis of differences in means. Therefore, this study uses the R.I.F. regression and decomposition to explore the impact of sectors on W.G. and determine which changes in individual characteristics reduce the inequality of income distribution. Proposed by Firpo et al. (Citation2009), R.I.F. redistributes the distributional statistics to influence the function. The advantage of the R.I.F. quantile regression is the comprehensive display of the wage distribution for each quantile. The W.G. is decomposed into sectors according to characteristic and coefficient effects, and the contribution of each explanatory variable is then estimated. R.I.F. can be expressed as:
(4)
(4)
where
are various statistics like mean and variance, and
is the influence function corresponding to the specific statistic
When the distribution statistic is quantile, the R.I.F. regression is of the unconditional quantile. Furthermore, the R.I.F. of the
variable at the
quantile can be expressed as:
(5)
(5)
where
is the marginal density function of
and
is the unconditional distribution of
quantiles.
is a function that can linearly represent other explained variables. The unconditional quantile regression to analyse the influence of variables such as sectors on the wages of different quantiles of each sample, using the following equation:
(6)
(6)
where
is the quantile of wages and
represents variables such as human capital and work characteristics. The influence of different variables on W.G. between sectors is then analysed through R.I.F. decomposition and the construction of counterfactual wage distributions. Furthermore, the W.G. can be decomposed into two parts, as:
(7)
(7)
where
and
are the logarithm of the annual incomes of P.U.S. and P.R.S., respectively, and
is the counterfactual function. The characteristic variables and wage structure of P.R.S. and P.U.S. are used to construct the counterfactual wage distribution, that is, the function when the P.R.S. and P.U.S. have the same return rate in respect of the labour characteristics. Based on this, the following equation is derived:
(8)
(8)
where
and
are the characteristic variables,
and
are the characteristic return rates, and
and
are approximate error terms of the P.U.S. and P.R.S., respectively. The first term on the right side of EquationEquation (8)
(8)
(8) represents the W.G. caused by differences in sector characteristics; that is, the characteristic effect. The second term is caused by the difference in the return rate when the characteristics of the sector elements are the same, that is, the parametric effect (also considered as the portion of the W.G. caused by market discrimination). Rios-Avila (Citation2020) discusses R.I.F.s in Stata and further optimises R.I.F. regression and decomposition.
3.2. Data description
The U.H.S. is a comprehensive survey of urban and rural households that includes over 40,000 detailed data for four provinces, namely, Guangdong, Liaoning, Sichuan and Shanghai (Eastern, Northeast, Western and Southern China, respectively). This study selects three years (2004, 2008, 2013) as the sample period. The statistics include age, experience, gender, education, occupation, working industry, wage, family status and ethnicity. As mentioned, the most challenging part of data processing involves the presence of severe statistical calibration inconsistencies in the three-year data. In 2004, the U.H.S. followed the 16 categories in the Chinese Industry Classification and Codes for National Economic Activities (GB 4754-84). However, in 2008, the National Bureau of Statistics referred to the International Standard Industrial Classification of All Economic Activities, re-establishing industry standards and dividing Chinese industries into 20 categories. The samples of the last industry for both, which are ‘others’, are few and are thus excluded in this study. After the classification standards are meticulously compared, the industry data in 2008 and 2013 are summarised into 15 categories (Appendix Table A).
shows the descriptive statistics classified by sector for the three years of 2004, 2008 and 2013, suggesting that P.U.S. has higher wages than P.R.S. in the three years, and the W.G. tends to expand, which matches our Hypothesis 1. In , ln w is the logarithm of the annual income level and Edu is the number of years of education. In the U.H.S. database, the degree of education is divided into eight categories (with the corresponding number of years of education in parenthesis: postgraduate (18), university (16), junior college (14), technical secondary school (12), high school (12), junior high school (9), elementary school (6) and illiterate. The last category is extremely and is included in the elementary school category in actual research. Furthermore, P.U.S. employees have always had higher education levels than those in the P.R.S. Moreover, the proportion of male employees in the P.U.S. is slightly higher than in the P.R.S., but there is no significant difference in terms of ethnicity and marital status between employees in the two sectors. In terms of occupation, the higher proportion of P.U.S. employees is engaged in technical, production and public management, while most P.R.S. employees are engaged in service, clerical and technical positions. From an industrial perspective, P.U.S. employees are primarily employed in administrative departments and educational and cultural institutions, while those in the P.R.S. mainly work in transportation, social services and manufacturing.
Table 1. Descriptive statistics for 2004, 2008 and 2013.
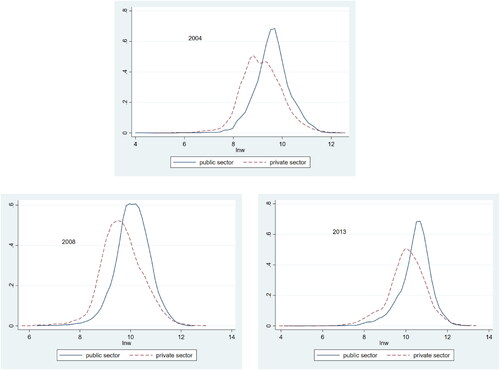
shows the Kernel density distribution of the logarithm of wages in 2004, 2008 and 2013. The wage distribution is approximately normal. Both sectors demonstrate a rising trend, but wages are consistently higher in P.U.S. In addition, variances increase from 2004 to 2013 in both sectors, which shows that the W.G. within sectors increases during the economic transition.
Figure 1. Kernel density distribution in public and private sector wages for 2004, 2008 and 2013.
Source: Calculated based on UHS 2003, UHS 2008 and UHS 2013.
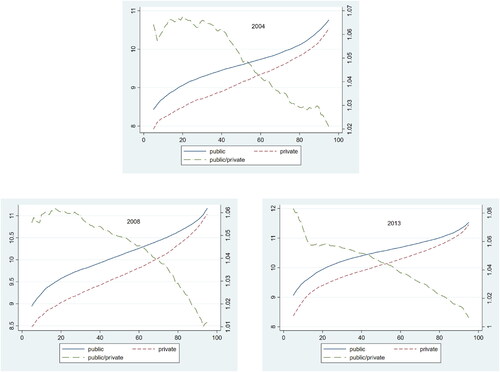
shows the W.G.s of two sectors under different quantiles. The ordinate on the left represents the logarithm of wages, and that on the right represents the proportion of wages in the two sectors. Clearly, the wages in the P.U.S. are higher than those of the P.R.S. in all quantiles. Moreover, the W.G.s of the two sectors decrease as the quantile increases. Specifically, at the low-income quantile level, the W.G. between the two sectors is relatively large and shows a tendency to expand over the three years. However, at the high-income quantile level, the W.G. is very small, and the wage ratio of the two sectors approaches 1.
Figure 2. Wage difference between public and private sectors by wage percentiles for 2004, 2008 and 2013.
Source: Calculated based on UHS 2003, UHS 2008 and UHS 2013
4. Results of the empirical research
4.1. O.L.S. regression
sets out the results of the preliminary O.L.S. regression following EquationEquation (1)(1)
(1) . From 2004 to 2013, wages in the P.R.S. were significantly lower than those in the P.U.S. Without considering other control variables, the wages of P.R.S. are approximately 40% lower than those of P.U.S. In respect of the other control variables, P.U.S. wages are still approximately 10% higher than those of the P.R.S. with an expansionary trend (−0.100 to −0.153) that also verifies the correctness of Hypothesis 1. The adjusted R2 is within the range of 0.228–0.409.
Table 2. Results of wage gaps between public and private sectors for 2004, 2008 and 2013.
Industries are classified as monopolistic or non-monopolistic based on the position of S.O.E.s (and taking account of existing studies) in order to test Hypothesis 2. Monopolistic industries include water, electricity, transport, postal services and finance, while non-monopolistic industries include all others in the Appendix. reports the W.G. in the monopolistic industries for the three years of the study. Controlling for covariates, the W.G. between the P.U.S. and P.R.S. is larger than in the sample regression for all industries and increases from 10.7% to 16%. reports the change in the W.G. for the non-monopoly industries. In contrast to the dramatic changes in the monopolistic industries, the W.G. in the monopolistic industries remains at around 10% over the period. This is a strong indication that upstream and monopolistic S.O.E.s widen the W.G. between sectors and also proves the validity of Hypothesis 2.
Table 3. Results of wage gaps between public and private sectors in Monopoly industries for 2004, 2008 and 2013.
Table 4. Results of wage gaps between public and private sectors in non-monopoly industries for 2004, 2008 and 2013.
4.2. Heckman selection model
shows the regression results based on the model using Heckman sample selection. Employee work experience and wages have a significant positive correlation in both sectors. Employee education level and wages in P.R.S. are significantly and positively correlated. However, what is interesting is that in the P.U.S., education factors are significantly and negatively correlated with wages (e.g., a coefficient of −0.205 in 2013). The main reason for this lies in the following two elements.
Table 5. Estimated results of wage function by public and private sectors for 2004, 2008 and 2013.
First, nepotism on the part of management often occurs in the P.U.S., which leads to a wage distribution that is not entirely based on personal ability. Second, a considerable number of current P.U.S. employees (especially in management) were already working at the end of the twentieth century, when China was in the early stages of reform and opening up, and people’s level of education was generally low. The impact of education level and work experience on employee wages increase over the three years, indicating that human capital plays an increasingly important role in wage distribution. Furthermore, the income of male employees is significantly higher than that of female employees, by approximately 20%. However, the W.G. between Han and ethnic minorities is not significant.
4.3. Oaxaca–Blinder decomposition
shows the decomposition results using the O.B. decomposition model. In general, although the W.G. has slightly declined over the three years, the interpretable part (i.e., characteristic effects) first decreases and then increases (from 63.7% to 67.25%, to 55.26%). Although the characteristic effect fluctuates, it is consistently above 50%, which shows that individual endowments are the main cause of the W.G. during this period, and also justifies Hypothesis 3. The unexplainable part (i.e., the coefficient effect) first decreases and then increases, suggesting that the differential treatment or discrimination in terms of wages suffered by P.R.S. employees in the labour market initially decreases and then increases over the three years.
Table 6. O.B. decomposition results.
These results denote the smaller influence of market mechanisms as a factor in the W.G., while the influence of institutional factors increases as economic reforms progress. In particular, educational factors contribute the most to the characteristic effect, suggesting that enterprises’ requirements for highly educated talents are constantly increasing. The contribution of industrial factors to characteristic effects is second only to that of educational factors, which is attributed to the monopolies in many industries in China (such as oil, natural gas, infrastructure) that earn a revenue premium. In respect of the coefficient effect, employee work experience is the most important influencing factor, while province, industry and education are the other relatively important factors. Specifically, work experience is the largest contributor in the three years, accounting for approximately 40% of the income effect, despite its considerable uncertainty.
4.4. R.I.F. regressions and decomposition
R.I.F. regressions are conducted for different income quantiles to test Hypothesis 4. The characteristic and coefficient effects are then obtained by R.I.F. decomposition. The R.I.F. quantile regression method is used to test the influence of the sector on quantile wages. reports the coefficients of the 10th, 50th and 90th quantiles, showing that most of the regression results are significant.
Table 7. R.I.F. quantile regression by public and private sectors for 2004, 2008 and 2013.
Work experience has a significant impact on income at each quantile and decreases as the quantile increases. Thus, the effect of work experience on wages is mainly concentrated on middle or low-income employees. Moreover, this effect in the 90th quantile is higher in the P.R.S. than in the P.U.S. However, the opposite is true in other quantiles, indicating that high-income employees in PRS are more affected by work experience factors. Education has always had an important effect on employee wages, which is reflected in their significant positive correlation and the similar coefficient at all quantiles. Similar to work experience, in the 90th percentile, the effect of education on P.R.S. wages is higher than in the P.U.S., which means that the impact of education level on income is more apparent for P.R.S. employees. Moreover, male employees have higher incomes in all quantiles, with no downward trend. Furthermore, compared with the results for the P.U.S., the estimation coefficient is much higher for males than females in the P.R.S., suggesting that females may be discriminated against in this sector.
The effects of industry and occupation types on wages increase directly with quantiles, which means that there is no W.G. for newcomers across sectors, but this increases with years of work. The regression coefficient of ethnicity is small, indicating no significant difference in income treatment between the Chinese and Han ethnic groups. Similarly, the regression coefficient of marital status is not significant.
The R.I.F. decomposition is further used to decompose W.G. into characteristic and parametric effects. shows the total W.G. between the two sectors, the characteristic and coefficient effects, and the influence of each variable. In general, the W.G. between the P.U.S. and P.R.S. continues to expand from 2004 to 2013. Furthermore, in the 10th and 50th quantiles, the W.G. for low- and middle-income employees of the two sectors is larger than for high-income employees. In the three years, the characteristic effect for each quantile shows an increasing and then decreasing trend; for example, the characteristic effect in the 10th quantile increases from 36.4% to 39.8% and then decreases to 37.9%. This means that the coefficient effect of the unexplained part, including sectoral discrimination, first decreases and then increases. Moreover, for low- and middle-income employees, education, occupational type and gender have the greatest influence on the characteristic effect, and the importance of industry continues to increase. For the coefficient effect, work experience and occupation type account for the largest proportion of the effect. For high-income employees, education and industry have always been the two most stable factors affecting the characteristic effect. Considering that work experience has no significant influence on the coefficient effect for high-income employees, the type of occupation becomes the most important factor. The above analyses of the R.I.F. decomposition all illustrate the validity of Hypothesis 4, that the characteristics and coefficient effects causing the W.G. are particularly diverse across various income quantiles.
Table 8. R.I.F. decomposition results.
4.5. Results discussion
The wages of the P.U.S. are consistently higher than those of the P.R.S. in these three years, and that W.G. tends to expand. This result is consistent with our Hypothesis 1 and supports the study of Nawakitphaitoon et al. (Citation2016) and Whalley and Xing (Citation2016) rather than that of Demurger et al. (Citation2012).
Following the model in Li et al. (Citation2015) and the findings of Lin (Citation2021), representative monopolistic industries (water, electricity, transportation, post and finance) are selected in this study. The empirical results show that the intersectoral W.G. for monopolistic industries remains around 10% during this period, which clearly indicates that upstream and monopolistic S.O.E.s are important factors influencing the W.G., and also verifies Hypothesis 2.
The O.B. decomposition reveals that the explainable component (i.e., characteristic effect) of W.G. declines and then rises. While the results are similar to the consistent increase in the characteristic effect observed in Ma (Citation2018), we find that the characteristic effect consistently remains above 50%, supporting Hypothesis 3. The effects of education and work experience on wages continue to increase, indicating the increasing importance of human capital. In other words, individual endowments are the main cause of intersectoral W.G. in the twenty-first century.
Further, the article shows that for high-income employees, education and industry have been the two most stable factors in the characteristic effect. For low- and middle-income employees, education, occupation and gender have the largest role in the characteristic effect. This also verifies Hypothesis 4 that the causes of the characteristic effects of W.G. differ between the P.U.S. and P.R.S. in different wage quartiles.
5. Conclusions and policy recommendations
Based on the U.H.S. survey data for 2004, 2008 and 2013, this study investigates the wage structure and gap between the P.U.S. and P.R.S. First, the OLS regression with Heckman selection reveals that the WG between the P.U.S. and P.R.S. is expanding. Moreover, the O.B. decomposition suggests that the characteristic effect has an increasing and then decreasing trend but still takes the dominant position. Furthermore, the R.I.F. quantile regression and R.I.F. decomposition show that work experience, education, gender, occupation and industry have significant effects on the W.G. In particular, work experience has a greater impact on middle- and lower-income employees, while high-income employees are more sensitive to education, occupation and industry.
The findings of this article provide evidence to support future policy development. First, behind the continued expansion of the W.G. is partial government control of the wage-setting system; market mechanisms are unable to play a full role in wage setting in the P.U.S. Further antitrust regulation of S.O.E.s is needed, especially in upstream industries. Second, since education and work experience are important factors in the characteristic effect, improvements are needed in education policy and labour law, including increasing education and vocational training for P.R.S. employees, introducing policies to attract high-level talents to the P.R.S., and setting a suitable minimum wage.
However, this study has certain limitations. First, the research is based on the cross-sectional data for three non-contiguous years, and the sample selection may be accidental. Second, other labour demand factors such as firm productivity, human resource management and unobservable variables of firms may also affect the W.G. and are not considered in this study.
Finally, there are possible avenues for further research along the lines of this study. First, future research could focus on a particular and essential characteristic of the W.G., such as education and work experience. Second, it is necessary to explore the impact of monopolistic industries on the W.G. through a more precise industry classification; this article only considers monopolistic industries as a whole. Third, other classifications of industries are also worth considering, such as service versus production industries. Fourth, the article does not consider any specific policies or shocks that could cause fluctuations in the W.G., which also has practical meaning.
Declaration of competing interest
In accordance with guidelines for publication and our ethical obligation as the authors of this article declares that there is no potential conflict of interest.
Data availability
The authors do not have permission to share data.
Additional information
Funding
References
- Aderemi, T., & Alley, I. (2019). Gender pay gap in the workplace: The case of public and private sectors in Nigeria. Journal of Social and Economic Development, 21(2), 370–391. https://doi.org/10.1007/s40847-019-00079-9
- Alesina, A., Ardagna, S., Perotti, R., & Schiantarelli, F. (2002). Fiscal policy, profits, and investment. American Economic Review, 92(3), 571–589. https://doi.org/10.1257/00028280260136255
- Blinder, A. (1973). Wage discrimination: Reduced form and structural estimates. The Journal of Human Resources, 8(4), 436–455. https://doi.org/10.2307/144855
- Botchway, E., & Asiedu, K. F. (2020). Ownership type and earnings gap decomposition: Evidence from the Ghanaian labor market. African Development Review, 32(4), 619–631. https://doi.org/10.1111/1467-8268.12465
- Cho, D., Cho, J., & Song, B. (2010). An empirical analysis of the gender earnings gap between the public and private sectors in Korea: A comparative study with the US. Journal of the Japanese and International Economies, 24(3), 441–456. https://doi.org/10.1016/j.jjie.2010.02.001
- Clark, R. L., Ogawa, N., Mansor, N., Abe, S., & Mahidin, M. U. (2021). Wage differentials in Malaysia: Public employment. Asian Economic Papers, 20(3), 16–34. https://doi.org/10.1162/asep_a_00840
- Dao, Q. T., Le, T. Y., & Pham, V. H. (2022). Changes in income distribution during the COVID-19 pandemic: Empirical evidence from Vietnam. The Journal of Asian Finance, Economics and Business, 9(1), 241–248.
- Demurger, S., Li, S., & Yang, J. (2012). Earnings differentials between the public and private sectors in China: Exploring changes for urban local residents in the 2000s. China Economic Review, 23(1), 138–153. https://doi.org/10.1016/j.chieco.2011.08.007
- Dustmann, C., & van Soest, A. (1998). Public and private sector wages of male workers in Germany. European Economic Review, 42(8), 1417–1441. https://doi.org/10.1016/S0014-2921(97)00109-8
- El-Haddad, A., & Gadallah, M. M. (2021). The informalization of the Egyptian economy (1998–2012): A driver of growing wage inequality. Applied Economics, 53(1), 115–144. https://doi.org/10.1080/00036846.2020.1796917
- Firpo, S., Fortin, N. M., & Lemieux, T. (2009). Unconditional quantile regressions. Econometrica, 77(3), 953–973.
- Gindling, T., Hasnain, Z., Newhouse, D., & Shi, R. (2020). Are public sector workers in developing countries overpaid? Evidence from a new global dataset. World Development, 126, 104737. https://doi.org/10.1016/j.worlddev.2019.104737
- Gustafsson, B., & Wan, H. (2020). Wage growth and inequality in urban China: 1988–2013. China Economic Review, 62, 101462. https://doi.org/10.1016/j.chieco.2020.101462
- Hakro, A. N., Ghulam, Y., Jaffry, S., & Shah, V. (2021). Employment choices and wage differentials: Evidence on labor force data sets from Pakistan. The Indian Journal of Labour Economics, 64(1), 199–216. https://doi.org/10.1007/s41027-021-00306-0
- Heckman, J. J. (1979). Sample selection bias as a specification error. Econometrica, 47(1), 153–161. https://doi.org/10.2307/1912352
- Hyder, A., & Reilly, B. (2005). The public and private sector pay gap in Pakistan: A quantile regression analysis. The Pakistan Development Review, 44(3), 271–306. https://doi.org/10.30541/v44i3pp.271-306
- Imbert, C. (2013). Decomposing the labor market earnings inequality: The public and private sectors in Vietnam. The World Bank Economic Review, 27(1), 55–79. https://doi.org/10.1093/wber/lhs009
- Kahyalar, N., Fethi, S., Katircioglu, S., & Ouattara, B. (2018). Formal and informal sectors: Is there any wage differential? The Service Industries Journal, 38(11-12), 789–823. https://doi.org/10.1080/02642069.2018.1482877
- Krueger, A. B. (1988). The determinants of queues for federal jobs. ILR Review, 41(4), 567–581. https://doi.org/10.1177/001979398804100406
- Krueger, A. B. (1993). How computers have changed the wage structure – Evidence from microdata, 1984-1989. The Quarterly Journal of Economics, 108(1), 33–60. https://doi.org/10.2307/2118494
- Kwenda, P., & Ntuli, M. (2018). A detailed decomposition analysis of the public-private sector wage gap in South Africa. Development Southern Africa, 35(6), 815–838. https://doi.org/10.1080/0376835X.2018.1499501
- Li, X., Liu, X., & Wang, Y. (2015). A model of China's state capitalism. SSRN 2061521.
- Lin, J. Y. (2021). State-owned enterprise reform in China: The new structural economics perspective. Structural Change and Economic Dynamics, 58, 106–111. https://doi.org/10.1016/j.strueco.2021.05.001
- Lin, J. Y. F., Cai, F., & Li, Z. (1998). Competition, policy burdens, and state-owned enterprise reform. American Economic Review, 88(2), 422–427.
- Liu, Y., Xu, W., Shen, J. F., & Wang, G. X. (2017). Market expansion, state intervention and wage differentials between economic sectors in urban China: A multilevel analysis. Urban Studies, 54(11), 2631–2651. https://doi.org/10.1177/0042098016650421
- Ma, X. (2018). Determinants of wage gap between public sector and private sector. In Dreyer Jacob, Nirmal Kumar Gnana Prakasam, & Jasper Asir (eds.), Economic transition and labor market reform in China (pp. 49–69). Springer.
- Mueller, R. E. (1998). Public-private sector wage differentials in Canada: Evidence from quantile regressions. Economics Letters, 60(2), 229–235. https://doi.org/10.1016/S0165-1765(98)00110-4
- Nawakitphaitoon, K., Chen, X., & Ge, Y. H. (2016). State and non-state earnings differentials over time in China's urban labor market: Evidence from the urban household survey (1994–2007). Journal of Labor Research, 37(3), 287–316. https://doi.org/10.1007/s12122-016-9227-2
- Oaxaca, R. (1973). Male-female wage differentials in urban labor markets. International Economic Review, 14(3), 693–709. https://doi.org/10.2307/2525981
- Rios-Avila, F. (2020). Recentered influence functions (RIFs) in Stata: RIF regression and RIF decomposition. The Stata Journal: Promoting Communications on Statistics and Stata, 20(1), 51–94. https://doi.org/10.1177/1536867X20909690
- Shahen, M. E., Kotani, K., Kakinaka, M., & Managi, S. (2020). Wage and labor mobility between public, formal private and informal private sectors in a developing country. Economic Analysis and Policy, 68, 101–113. https://doi.org/10.1016/j.eap.2020.09.006
- Shapiro, D. M., & Stelcner, M. (1989). Canadian public-private sector earnings differentials, 1970–1980. Industrial Relations: A Journal of Economy and Society, 28(1), 72–81. https://doi.org/10.1111/j.1468-232X.1989.tb00724.x
- Song, Y. (2016). Hukou-based labour market discrimination and ownership structure in urban China. Urban Studies, 53(8), 1657–1673. https://doi.org/10.1177/0042098015576861
- Sun, Q. (2018). Explaining the state-owned enterprise wage premium in China: Is it unobserved heterogeneity? Economic and Political Studies, 6(2), 135–157. https://doi.org/10.1080/20954816.2018.1463477
- Sun, S., Chu, X., & Liu, X. (2021). Urban wage inequality: The reform of state-owned enterprises in China’s great transition. Economic and Political Studies, 1–20. https://doi.org/10.1080/20954816.2021.1914417
- van der Gaag, J., & Vijverberg, W. (1988). A switching regression-model for wage determinants in the public and private sectors of a developing-country. The Review of Economics and Statistics, 70(2), 244–252. https://doi.org/10.2307/1928308
- Vanophem, H. (1993). A modified switching regression-model for earnings differentials between the public and private sectors in the Netherlands. Review of Economics and Statistics, 75(2), 215–224.
- Wang, J., & Xie, Y. (2015). Feeling good about the iron rice bowl: Economic sector and happiness in post-reform urban China. Social Science Research, 53, 203–217.
- Whalley, J., & Xing, C. (2016). Ownership restructuring and wage inequality in urban China. International Labour Review, 155(1), 57–72.
- Xiao, Y., Liu, X., & Ren, T. (2022). Institutional differences in individual wellbeing in China. Sustainability, 14(2), 721. https://doi.org/10.3390/su14020721
- Xu, C. G. (2011). The fundamental institutions of China's reforms and development. Journal of Economic Literature, 49(4), 1076–1151. https://doi.org/10.1257/jel.49.4.1076
- Xu, Z., Chen, Y., & Li, M. (2015). Are Chinese workers paid the correct wages? Measuring wage underpayment in the Chinese industrial sector, 2005-2010. Review of Radical Political Economics, 47(3), 446–459. https://doi.org/10.1177/0486613414542780
Appendix
Table A. Industry-classification in 2004, 2008 and 2013.