
 ?Mathematical formulae have been encoded as MathML and are displayed in this HTML version using MathJax in order to improve their display. Uncheck the box to turn MathJax off. This feature requires Javascript. Click on a formula to zoom.
Abstract
In this study, we used data on China’s initial public offerings (IPOs), market volatility and macro environment before and after two stock crashes during 2006–2016 to investigate how different investor sentiment affects IPO first-day flipping. The empirical results show that the expected returns of allocated investors are affected by sentiment, with allocated investors having higher psychological expectations of future returns during an optimistic bull market and their optimism discouraging first-day flipping, while higher risk-free interest rate levels and rising broad market indices also discourage first-day flipping and tend to sell in the future. The pessimistic bear market during which allocated investors have lower psychological expectations of future returns, their pessimism will promote first-day flipping, and the increase in the risk-free rate level will also promote first-day flipping, which is the opposite of the optimistic bull market, indicating that their risk aversion has increased and they tend to sell on the same day. We also found an anomaly that the greater the decline in the broad market index during a pessimistic bear market, the more inclined the allocated investors are to sell in the future when the broad market index rises in an attempt to gain higher returns. These findings help explain and understand the impact of market and macro index fluctuations on investor behavior under different investor sentiments.
JEL CODE:
1. Introduction
The method of selling shares of a private business towards the public in a fresh stock issuance is called as initial public offering (IPO) and initial public offerings (IPOs) have been a hot topic of research in traditional finance, and one of the core topics of discussion is the turnover rate effect. Numerous studies have shown that the high return on investment on the first day of IPO and the low return on investment in IPO stocks in the long run, has been a long-standing phenomenon worldwide, known as the ‘IPO puzzle’ (Ljungqvist et al., Citation2006; Ritter & Welch, Citation2002). Barinov (Citation2014) give a similar definition in their study of the U.S. stock market and named it the ‘Turnover effect’. Wang and Wang (Citation2021) also reveals the same phenomenon in his study of China’s stock market, and the high first-day returns caused by the high turnover rate of flipping. IPO at a cost lower than its true value on the stock market is said to be undervaluation. The stock measured undervalued at the time of closing price of a novel stock on the first trading day is higher than the recognized IPO price.
However, the research on the effect of stock turnover on stock returns has remained in the realm of asset pricing research for a long time, and the cross-sectional data analysis using long-term asset pricing in this context does not explain the phenomenon well. With further research, subsequent scholars have introduced the perspective of behavioral finance, considered the factors of investor sentiment, and explained this phenomenon based on investor behavior, which has enriched the research results.
Through literature review, we find that previous studies of IPO first-day flipping (Ibrahim & Benli, Citation2022; Wang & Wang, Citation2021; Zhang & Liu, Citation2006), in developed countries are well validated, while the stock markets in the UK (1551) and the US (1790) have centuries of development history and have become mature markets. In contrast, there is little empirical work in developing and emerging stock markets (e.g., China), and empirical evidence from these markets would certainly help us further enhance our understanding of asset pricing.
Indeed, investment decisions in developing countries and emerging markets are more likely to be influenced by investor sentiment (Hens & Benli, Citation2021; Xian, Citation2021). If this issue is discussed in the context of immature stock markets, different insights and more precise reasons may emerge (Albada et al., Citation2022). What’s more, after more than 30 years of development, China’s stock market still has 99.76% of investors who are natural persons (SIPF, 2020), so it is clear that China’s stock market is also more susceptible to investor sentiment.
While both of these characteristics exist in other stock markets around the world, more importantly, China’s stock market has had a T + 1 trading system since 1995 and has become the second largest stock market in the world, with enough trading volume and IPO numbers under this particular trading system to provide a database for this question to be explored.
On the other hand, scholars' studies also ignore the possibility that changes in the market environment trigger the decision-making behavior of allocated investors (Ren & Han, Citation2005; Shao et al., Citation2010; Wang & Yao, Citation2020; Wei et al., Citation2014; Zhang & Liao, Citation2009). Methodologically, most studies have focused on cross-sectional regressions to identify more general patterns from the analysis of data over a long time (Baschieri et al., Citation2021; Shao et al., Citation2011; Shao & Wu, Citation2009; Zhang & Liu, Citation2006). In fact, in the related cross-sectional regression studies, little consideration is given to the different investor sentiment cycles and authorities' policy environments in which the data are located, leading to generalized but not targeted conclusions. Here is a lack of further explanation and empirical results to support what factors further trigger the first-day IPO flipping behavior of allocated investors under different investor sentiments.
However, recent empirical evidence suggests that stock returns can be predicted by using information on investor sentiment and is important in explaining cross-sectional changes in stock returns (Chen & Zheng, Citation2021; Dong & Huang, Citation2022; Kao et al., Citation2022), implying that investor sentiment needs to be classified and clarified to some extent to have greater value in validation. The limitations of the above study may be due to the difficulty of obtaining daily data on the one hand and the difficulty of finding suitable explanatory variables for some concepts on the other. To address the above issues, this study divides the period into two cycles of optimistic investor sentiment and pessimistic investor sentiment, and focuses on the triggers of the first-day IPO flipping behavior of allocated investors under different investor sentiments, and uses more precise daily macro environment data to consider the impact of changes in the market environment and macro environment of allocated investors on their first-day IPO flipping behavior, providing reliable evidence for further expansion and interpretation of this topic.
This paper contributes to the literature on investor sentiment and asset pricing in a number of ways. Firstly, it is demonstrated that there are differences in investors' expected returns under different investor sentiments, which in turn leads to differences in investment behavior. The second is the comparison of regression results showing that the same variables differ in their positive and negative correlation with investment behavior due to differences in investor sentiment. Finally, it is found that when investors are in a pessimistic bear market period, there are some phenomena that traditional finance fails to explain.
The rest of the paper proceeds as follows. Section 2 briefly describes how IPOs are allocated in the China’s stock market. Section 3 presents literature review. Section 4 explains our research method. Section 5 discusses study results. Section 6 provides discussion and section 7 draws conclusions.
2. Background
In China’s stock market, there are mainly capital lotteries and market value placement for investors who want to get IPO new shares placement. Funds lottery is a lottery based on the number of investors' subscription funds, where the IPO underwriters first set the issue price (or price range) based on some valuation method, and then the subscribers pre-deposit the full amount of subscription funds into a special bank account according to the issue price and the number of proposed subscriptions (prepayment for online IPO subscriptions has been cancelled after January 5, 2016), and the exchange will allocate a lottery number for every 1000 or 500 shares of subscriptions. The Exchange will allocate a lottery number for every 1000 or 500 shares of subscription quantity, and finally decide on the subject and the number of allocations according to the lottery results.
Market values allocation refers to the lottery based on the market value of the secondary market shares held by investors. In other words, after the underwriters set the issue price, investors will propose the number of subscriptions based on the market value of their outstanding shares (e.g. 1,000 new shares for every 10,000 yuan of market value of outstanding shares), and the exchange will allocate a lottery number for every 1,000 valid subscriptions, and then decide the target and number of allocations based on the lottery results. The biggest difference between this and the capital lottery is that investors do not need to pay subscription funds in advance.
The new shares allocated to investors under these two methods have no lock-up period restriction at the initial stage of listing and can immediately participate in secondary market trading, which is the main source of flipping on the first day of IPO flipping.
3. Literature review
The high first-day turnover was initially attributed to the depressed price of the IPO, mainly due to changes in the general market environment (Ritter, Citation1984), the company's internal governance needs regarding tax and talent incentives (Booth & Chua, Citation1996; Mello & Parsons, Citation1998), and the legal factors that the company would face after the IPO (Hughes & Thakor, Citation1992; Lowry & Shu, Citation2002; Tinic, Citation1988).
Starting from the 1990s, some scholars have challenged the traditional view of high first-day turnover due to IPO issue price suppression by pointing out that high first-day IPO returns mainly come from secondary market ‘underpricing’ rather than primary market ‘price suppression’ based on the sample matching method, i.e., the IPO first-day closing price exceeds the intrinsic value of the stock, and provide some explanations from behavioural finance perspective (Swaminathan & Purnanandam, Citation2004). Meanwhile, because of excessive investor optimism and short-sale constraints, which make investor sentiment lead to IPO first-day overpricing and make IPO stocks underperform in the long run (Derrien, Citation2005), and this series of studies provides a new theoretical framework for explaining that.
From the perspective of behavioral finance, Baker and Wurgler (Citation2007) propose the concept of ‘investor sentiment’, which is the belief that investors' misconceptions about the future returns or return-related factors of a security, usually in the form of over-optimism or over-pessimism, make asset prices not reasonably reflect economic fundamentals. Shao et al. (Citation2010) summarize the relevant literature and argue that, due to the new stock nature of IPO stocks, the amount of public information disclosed about them in the market is relatively limited, and these stocks themselves are highly susceptible to sentiment, which leads to over-optimistic investor sentiment dominating IPO trading in the early days of IPO. Han and Wu (Citation2007) and Shao and Wu (Citation2009) also support this view in their empirical studies. From the perspective of psychology, scholars have found that emotion and cognition have an influence on decision making and behavior. Lemer and Keltner (Citation2000) argue that fear makes individuals overestimate and avoid risk. Loewenstein et al. (Citation2001) propose the risk-as-feelings hypothesis that emphasizes the role of affect experienced at the moment of decision making and emotional reactions often drive behavior, when individuals reaction to risky situations. Heilman et al. (Citation2010) found that naturally occurring negative emotions also increase risk aversion in Balloon Analogue Risk Task.
With the introduction of the analytical perspective of behavioral finance, investor sentiment becomes a non-negligible factor influencing behavioral decisions, such as systematic biases in investors' perceptions (Boulton et al., Citation2021) and biases in future expectations, and the overall optimistic or negative sentiment exhibited by investors (Brown & Cliff Citation2004), which influences the behavior of allocated investors to sell high in IPOs, thus leading to incorrect pricing of stocks in stock markets (Baker & Wurgler, Citation2007; Polk & Sapienza, Citation2009).
Investors' opinions are divided under the influence of different sentiments, and in the future, there will always be optimistic investors with high valuations, and at a certain level of disagreement, the optimal choice for pessimistic investors with low valuations is to sell all the shares to optimistic investors. The optimal choice for under-valued pessimistic investors is to sell all their shares to the optimistic investors. Because of the short-sale constraints, the stock price will reflect the above-average valuation of the optimists (Harrison & Kreps, Citation1978; Hong et al., Citation2006), and there is much evidence that high volatility in the degree of disagreement also leads to high turnover (Zhang & Liu, Citation2006). The authors further extend the concept of opinion disagreement in this view to constitute the main hypothesis of this paper:
Hypothesis 1: Optimistic allocated investors are more likely to hold on the first day of IPO, while pessimistic allocated investors are more likely to sell on the first day of IPO.
In terms of group traits, there is a herding effect in the financial market where investors infer information from others based on others' investment decisions, and there is a learning and imitation phenomenon in the trading process (Bikhchandani & Sharma, Citation2000), which is an important mechanism for the transmission of investor sentiment in stock markets and objectively exacerbates asset price volatility. The phenomenon in which individuals choose to track others as well as imitate group behavior to make independent besides atomic decisions based on their private data is termed as herding effect. In the case of information asymmetry, people imitating each other's investment behavior can be used to judge the information held by others, and also to a certain extent, it can alleviate the pain that may arise due to individual-decision-making-mistakes, which ultimately affects stock prices.
In addition, financial markets are the result of group projection, where the evolution of the market or economy is a series of cognitive and projection processes in which individuals play an important role (Chou et al., Citation2002), while individual emotional reactions are influenced by group pressure and show involuntary, unconscious herding behavior in response to the presentation of a psychological situation, while this behavior is triggered by a message or a series of messages (Xiao, Citation2020). Based on the above phenomena, the authors propose a second hypothesis:
Hypothesis 2: Both optimistic and pessimistic allocated investors are susceptible to market volatility, and may stick to or abandon their original ideas, creating herding effects, and there may be self-influencing factors of investor traits.
4. Research method
4.1. Time period
Under different market conditions, investors will react differently to the same information (Lee et al., Citation1991; Ljungqvist et al., Citation2006). In the perspective of this theory, investors' behavior will differ at different stages of investor sentiment. shows that investor sentiment in China’s stock market is extremely similar to the volatility of the broad market index. The current study divides the period into bull markets and bear markets based on the NBER (National Bureau of Economic Research) business cycle (Bry & Boschan, 1972) and validity, followed by a combination of optimism and pessimism from the ISI investor sentiment indicator (Wei et al., Citation2014) to divide the time horizon of the current study from the stock market and combining the fluctuations in , which are optimistic bull market (2006-08-07 to 2007-10-17, and 2014-10-27 to 2015-06-12), and pessimistic bear markets (2007-10-18 to 2008-11-04, and 2015-06-15 to 2016-01-28). A recession implies a significant decline in economic activity is underlined by using NBER, then the above decline extends to the entire economy besides lasting for more than several months. A timeline of US business cycles is preserved by NBER Business Cycle. The chronology recognizes the dates that constitute the peaks besides valleys of the economic recession as well as expansion. The outline of economic prosperity as well as depression that modern economy exhibits in the business cycle. It is significant since they affect effectiveness and eventually regulate the success of the business.
Figure 1. SSE Index and ISI Investor Sentiment Index (2003.2-2020.11).
Note: SSE stands for Shanghai Stock Exchange and it is otherwise called as SSE Composite Index. SIPF has only been publishing the China Securities Market Investor Confidence Index since April 2008, so the index is limited in terms of time horizon, and this study selects the ISI Investor Sentiment Index with a larger time horizon. The index formula is: ISIt = 0.64NAt + 0.521TURNt-1 + 0.229CCIt-1 + 0.351DCEFt-1 + 0.227NIPOt + 0.463RIPOt, NA = New accounts, TURN = Turnover, CCI = Consumer Confidence Index, DCEF = Closed-end fund discount, NIPO = Number of IPOs, RIPO = Average first-day return.
Source: drawn by authors.
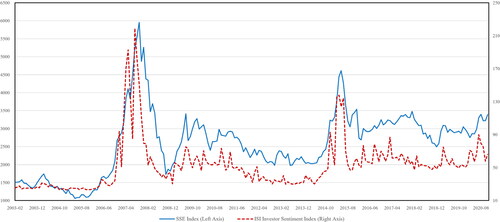
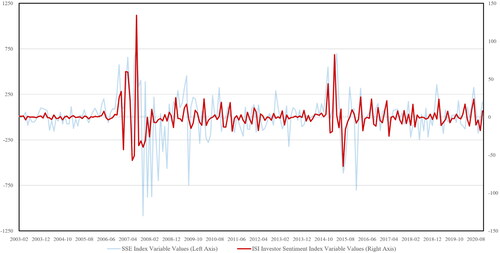
Figure 2. SSE Index Variable Values and ISI Investor Sentiment Index Variable Values (2003.2-2020.11).
Source: Variable values are the current period value minus the previous period value.
Source: drawn by authors.
4.2. Objects and variables
The population of this study is all A-share IPOs during the optimistic bull market and pessimistic bear market, of which there are 505 study subjects. Among them, since China’s stock market officially implemented the T + 1 trading system in 1995, this makes the first-day turnover rate a good observer to measure the flipping level.
According to Hypothesis 1, an indicator of the number of IPO flipping on the first day of a listing is selected as the explanatory variable, which is measured by the IPO first-day turnover rate (Shao et al., Citation2011). The investor sentiment indicator is also selected as the explanatory variable, which is measured by the A/D line and Arms index (Zhang & Liao, Citation2009). These indicators were then subjected to cross-sectional regressions to test the theoretical hypotheses, the settings and definitions of these variable indicators are shown in .
Table 1. Description of variables for Hypothesis 1.
According to Hypothesis 2, IPOs in the time horizon are divided into two subsamples based on differences in investor sentiment: Sample 1 for optimistic bull markets and Sample 2 for pessimistic bear markets, where Sample 1 contains a total of 344 IPOs and Sample 2 contains a total of 161 IPOs. cross-sectional regressions are then conducted separately to test the theoretical hypothesis and compare the differences in regression parameters between them.
The number of IPO flipping on the first day of listing indicator is selected as the explanatory variable, which is measured by the IPO first-day turnover rate (Shao et al., Citation2011). The IPO stock trait, market volatility, and macro environment indicators are also selected as explanatory variables, among which the IPO stock traits are measured by the online issue winning rate and the initial issue price, and market volatility indicators are measured by three variables: the first-day IPO rise and fall, the SSE Index Amplitude, the rise and fall of the ten-year Treasury bond, and the macro environment indicators are measured by the 9 M inflation index and the ten-year Treasury bond yield. The 10-year Treasury bond yield is an important economic benchmark then affects several interest rates. At the time of 10-year yield rises, mortgage interest rates besides other loan interest rates also rise. The settings and definitions of these variable indicators are shown in .
Table 2. Description of variables for Hypothesis 2.
4.3. Models
A statistical methodology that utilizes multiple explanatory variables to envisage the result of a response variable is termed as Multiple Linear Regression (MLR). It is also called as multiple regression. The extension of Linear Regression (OLS) is multiple regression which utilizes only one explanatory variable. To display the connection among a continuous response variable besides consistent else unmitigated informative factors, multiple linear regression is utilized. Review that basic direct relapse can be utilized to foresee the worth of a reaction dependent on the worth of a continuous predictor variable. The multiple linear regression analysis model is the most widely used one among various methods of multivariate statistical analysis, which is a mathematical and statistical method to deal with the interdependence between multiple variables. A statistical procedure used to analyze information that contains more than one kind of evaluation else observation is said to be multivariate analysis. This can also mean resolving the issues of simultaneous analysis of multiple dependent variables besides other variables. Since the interdependence between variables is abundant in practical problems, regression analysis is an effective mathematical method to study such interdependence. Depending on the requirements of the actual problem, the dependence of one or several of the variables on the remaining variables is examined (Wooldridge, Citation2007). The general form of the regression model is:
(1)
(1)
where the random variable y is called the explained variable (dependent variable), x1, x 2, …, xp are called the explanatory variables (independent variables), and β0, β1, …, βp are called the coefficients of the multiple linear regression model. The inner meaning of the multiple linear regression model is to solve for the value of β by the least-squares method. A mathematical technology which permits determining the best method to fit the curve at the top of the information point plot is said to be as Least Square Method (LSM). To facilitate the interpretation of scatter plots, LSM is broadly utilized then it is linked with regression analysis. The general form of the least square method is:
(2)
(2)
In addition to this, there are two important prerequisites for using a multiple linear regression model, the first one is that x (j=1, 2, …, p) contains no random components and is a deterministic variable. The second is that there is no perfect covariance between x1, x2, …, xp, and it is necessary to test whether there is multicollinearity among the variables (Wooldridge, Citation2007). To identify the range of a particular dependent variable depends on the ranges of two else additional independent variables, multiple regression methods are utilized by statistical analysis. Also, we can say it as, there could be multicollinearity if the two independent variables are highly interrelated. In order to further investigate the effect of the above cross-sectional data on the first day flipping behavior, this study adopts a multiple linear regression model and uses a stepwise regression method, which can also test the presence of multicollinearity is tested.
5. Study results
This section presents the empirical results for hypothesis 1 and hypothesis 2, respectively. Firstly, the results in show that hypothesis 1 holds in the time frame of the empirical evidence.
Table 3. Cross-sectional regression results for Hypothesis 1.
Next is the comparative analysis of the results in and 5. The results show that hypothesis 2 also holds in the time horizon of the empirical evidence, where the same indicator fluctuations produce opposite effects under different investor sentiments and there is a significant herding effect, and the results are analyzed in terms of IPO stock trait indicators, market volatility indicators, and macro environment indicators.
Table 4. Cross-sectional regression results for Sample 1 (optimistic bull market).
5.1. Hypothesis 1
The results of the regression on Hypothesis 1 are shown in . It can be seen from regression (1) (4) that the regression coefficients of the A/D line between the two have positive and negative signs, and both are significant at the 1% level, while it can also be seen from regression (2) (5) that the regression coefficients of the Arms index between the two have positive and negative signs, and both are significant at the 5% level.
This means that when allocated investors are in an optimistic bull market, the information they receive is mostly positive. After receiving the information, they are optimistic about the future, expecting higher returns in the future, thus inhibiting their flipping behavior. On the contrary, when the allocated investors are in a pessimistic bear market, the information they receive is mostly not positive and become pessimistic about the future, then they will generate flipping in order to reduce their risk. In the IPO sense, flipping is referred as the resale of shares through investors in the first day else weeks next to an IPO. The specified investors benefited since the initial hot-topic IPO boom. The IPO price will rise repeatedly on the first day, resultant in a value much higher than the intrinsic value created through the excess return.
5.2. Hypothesis 2
shows a graphical comparison of the arithmetic averages of the different factors, which clearly shows the difference in the performance of the indices in two markets with different sentiments, Ten-year treasury bonds up or down and Ten-year treasury yield, which are diametrically opposed.
5.2.1. IPO stock trait indicators
The cross-sectional regression results for both samples of Hypothesis 2 are presented in and . As can be seen from regression (1), the regression coefficients for the online offering winning rate are both negative and significant at the 1% level, with an adjusted R-squared of only 7% for sample 1 and up to 18% for sample 2. This implies that the higher the winning rate of the online offering, the smaller the amount of flipping by the allocated investors, whether they are in an optimistic bull market or a pessimistic bear market. The R-squared value ranges from 0 − 1, then it is generally expressed as 0% − 100%. If the value reaches 100%, it means every change in the value (else other dependent variables) is fully explained through changes in the index (else the independent variable you are interested in). On the other hand, regression (2) shows that the regression coefficients of the initial offering price are negative and significant at the 5% level, with an adjusted R-squared of 10% for sample 1 and only 2% for sample 2, indicating that the higher the initial offering price, the smaller the number of flipping by allocated investors, regardless of the cycle they are in. From the perspective of classical economics, if IPO stocks are treated as a commodity, the lower the scarcity and higher the cost, the less the flipping behavior of allocated investors, while the higher the scarcity and lower the cost, the more the flipping behavior of allocated investors, which shows that there is a non-negligible speculative behavior in IPO subscriptions of China’s stocks.
Table 5. Cross-sectional regression results for Sample 2 (pessimistic bear market).
5.2.2. Market volatility indicators
When three more control variables are added to regression (3), namely, the first-day share price up or down, the SSE index amplitude and the ten-year treasury bonds up or down, regression (4) shows that the regression coefficients of the first day of listing are positive in both samples and are significant at the 1% level, indicating that the greater the first day of listing, the greater the flipping behavior of the allocated investors, regardless of the market sentiment. This result is consistent with the findings of Aggarwal (Citation2003) and Bayley et al. (Citation2006), which suggest that the phenomenon follows the herding effect. SSE stands for Shanghai Stock Exchange and it is otherwise called as SSE Composite Index. A stock index of entire stocks like A shares & B shares traded on the Shanghai Stock Exchange. By utilizing the base period of 100, the SSE index is computed.
The results of regression (5) show that the SSE index amplitude is negative and significant at the 1% level under Sample 1, while the regression coefficient of the SSE index amplitude under Sample 2 is negative and significant at the 1% level in regressions (7) (8) (9) (10), which also implies that regardless of the market sentiment, the greater the SSE index amplitude, the less the allocated investors' flipping. The greater the SSE index amplitude, the less the flipping behavior of allocated investors. This also indicates that the greater the reduction in the SSE index, the lower the flipping behavior of allocated investors even in a pessimistic bear markets where the SSE index keeps falling.
The results of regression (6) (7) (8) (10) show that the ten-year treasury bonds up or down are negative and significant at the 5% level under Sample 1, which means that the ten-year treasury bonds up or down are also one of the factors that affect the first-day flipping level of allocated investors in a pessimistic bear market, while the ten-year treasury bonds up or down are not significant under sample 2. This indicates that when allocated investors are in an optimistic bull market, fluctuations in the risk-free rate inhibit first-day flipping behavior, and when the risk-free rate is in an uptrend, the less first-day flipping behavior there is. The hypothetical rate of return on a zero-risk investment is said to risk-free rate of return. The investor’s expected interest on investment is indicated by risk-free rate, i.e., absolutely risk-free in a given period of time.
5.2.3. Macro environment indicators
The regressions (8) (10) show that the regression coefficients of the 9 M inflation index are positive and significant at the 1% level for both samples, indicating that an increase in the level of inflation exacerbates the first-day flipping behavior of allocated investors, which implies that a decrease in the purchasing power of money exacerbates the first-day flipping cash-out behavior.
On the other hand, the regression coefficient of the ten-year treasury yield is negative in Sample 1 and positive in Sample 2, and is significant at the 1% level, indicating that in an optimistic bull market, the higher the risk-free rate, the lower the first-day flipping behavior of allocated investors, while a pessimistic bear market, the higher the risk-free rate, the higher the first-day flipping behavior of allocated investors.
This result, combined with the results of regression (6), indicates that in an optimistic bull market, the level and direction of volatility of the risk-free rate are consistent with the first-day flipping behavior of the allocated investors, suggesting that a higher level and upward volatility of the risk-free rate increases the expected return of the allocated investors and reduces the flipping behavior in order to obtain higher returns in the future. However, in a pessimistic bear market the opposite is true, as higher risk-free rates reduce the expected returns of allocated investors, thus accelerating the first-day flipping behavior of allocated investors.
6. Discussion
This paper investigates the impact of IPO stock trait indicators, market volatility, and macro environment on investor decision-making behavior under different investor sentiments by hypothesizing the existence of different effects of different investor sentiments on investor decision-making behavior. For the empirical analysis, this paper uses eleven types of data from the above three categories of indicators for cross-sectional regressions and pioneers the use of daily data with a time interval covering the period 2006–2016.
Regardless of the market cycle of the allocated investors, the level of first-day flipping is influenced by the winning rate and the IPO price, but also depends on the first-day share price up or down and the SSE index amplitude. The greater the volatility of the first day of listing, the greater the number of flipping, which seems to be consistent with the ‘disposition effect’ in behavioral finance (Shefrin & Statman, Citation1985). The disposal effect means that we tend to sell assets that have obtained financial gains prematurely, though holding assets that lose money at the same time, which is incompatible with the understanding of utility theory. If the issue price is used as a fixed reference point in the utility function of the allotted investors, the utility function of the allotted investors is risk-averse above the reference point, and the higher the increase of the share price relative to the issue price in the transaction, the stronger the tendency of the allotted investors to sell the shares to realize the profit. At the same time, the greater the SSE index amplitude, the smaller the number of flipping, and the increase in the inflation index also increases the number of flipping.
When allocated investors are in an optimistic bull market, they have higher psychological expectations of future returns, and their optimism will inhibit first-day flipping behavior, while the increase in the level of risk-free interest rates and the rise of the broad market index will also inhibit first-day flipping behavior. To some extent, the increase in the level of risk-free interest rates and the rise of the broad market index increase the expected returns of allocated investors, and allocated investors tend to sell in the future. and also clearly show the difference in first-day flipping data between the two market sentiments ( and ).
Figure 3. The bubble plot of stepwise regression coefficient of Hypothesis 2.
Note: (1) Data with significant levels below 10% in different factors were selected and processed for arithmetic averaging. (2) The ratio of the arithmetic mean of the different factors is the ratio of the graph area.
Source: drawn by authors.
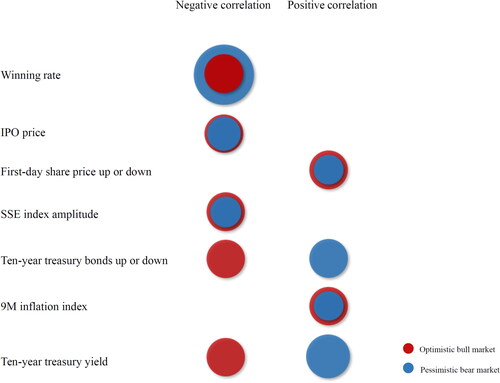
Figure 4. “IPO Winning Streak Days” in the optimistic bull market.
Source: drawn by authors.
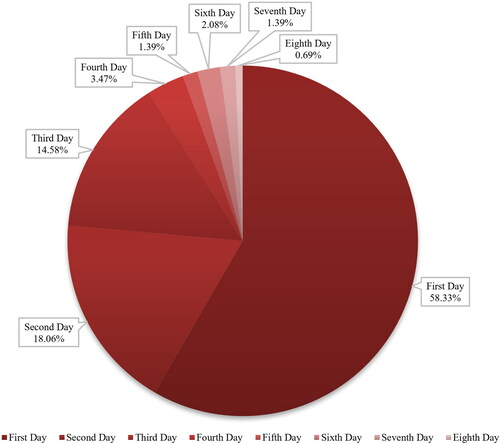
Figure 5. “IPO Winning Streak Days” in the pessimistic bull market.
Note: (1) IPO Winning Streak Days refers to the number of consecutive up days with the first day of IPO as the first day. (2) In the time range of sample 2, new policy factors appear to limit the daily rise and fall of IPO stocks, resulting in longer stock price rise and fall cycles, so the statistical time range of and is only within sample 1.
Source: drawn by authors.
When allocated investors are in a pessimistic bear market, they have lower psychological expectations of future returns and their pessimism will promote first-day flipping behavior, while an increase in the risk-free rate level will promote first-day flipping behavior. However, in general, an increase in the level of risk-free rates raises the expected return of allocated investors. This suggests that it may be due to the pessimism of the allocated investors that increases their aversion to risk, which makes the risk-free rate products to some extent substitute the flipping for profits, and the allocated investors who are eager to take profits and leave the market tend to flip on the first day and then buy the funds into the risk-free rate related products which is a lower expected return for the allocated investors, contrary to the traditional explanation of financial asset pricing. On the other hand, the increase in the magnitude of the decline of the broad market index will inhibit the first-day flipping behavior. However, the general perceptions are that the allocated investors should increase the flipping behavior in the pessimistic mood, indicating that it may be due to the higher expected return of the allocated investors on the flipping behavior when the greater the reduction of the broad market index, the allocated investors are more inclined to sell in the future when the broad market index rises to obtain higher returns. In fact, there is non-herding behavior among allocated investors even under the influence of pessimistic sentiment.
In a theoretical sense, the empirical results of this paper in different investor sentiment contexts strongly support the case that investors' limited rationality and risk aversion are reflected in different sentiments, and provide a new perspective and exploration possibility for asset pricing in behavioral finance: there may be differences in the way assets are priced in different sentiment cycles. For example, the risk-free interest rate factor in the empirical process of this paper behaves diametrically opposite in different sentiment cycles, which implies that there is some possibility for this hypothesis. This provides some evidential support for further, more precise exploration in this area. Secondly, the anomalous phenomenon supports prospect theory that that the greater the decline in the broad market index during a pessimistic bear market, the more inclined the allocated investors are to sell in the future when the broad market index rises in an attempt to gain higher returns, suggesting that there is still limited rationality (the anchoring of IPO historical returns) for investors to take investment decisions under pessimism.
And in a practical guidance, one important finding is that, in addition to the four factors of investor sentiment, IPO stock trait, market volatility, and macro environment, the expected return of allocated investors is also an important factor influencing the first-day flipping. Although there is herding behavior of allocated investors in most cases consistent with the general perception, some perverse behavior is produced due to the difference in the level of risk aversion and expected return of allocated investors in different market sentiments. This phenomenon is of great significance to market participants, as a series of factors can ultimately affect investors' expected returns, making them make very different investment decisions, and the observation and understanding of this phenomenon can help market participants to scientifically set their own investment decisions and risk control. From the perspective of financial regulators, especially in immature emerging markets, they can monitor the fluctuations of relevant factors and provide some preventive and control plans to avoid excessive market emotions and prevent financial risks from the perspective of decision-making behavior.
7. Conclusion
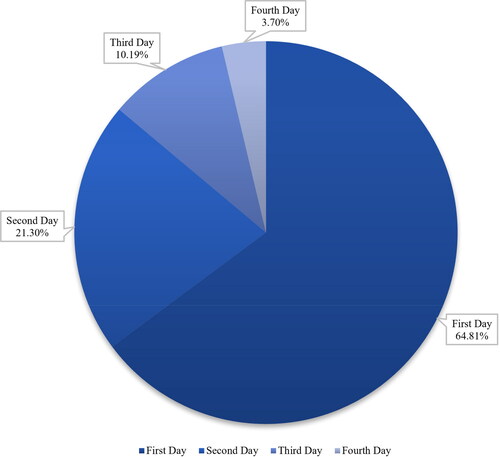
From the statistical results of the IPO winning streak days, more than half of the IPO shares reached the highest yield on the first day, and the proportion of IPO shares that could achieve a sustained rise of four days is less than 4%, so choosing to flip on the first day is the most rational choice of the allocated investors.
The above series of discussions and empirical results suggest that four factors, namely investor sentiment, IPO stock trait, market volatility, and macro environment, have an important impact on IPO first-day flipping and are important drivers of it, while classical economics and behavioral finance perspectives explain part of this series of phenomena very well. In terms of the properties of the commodity, regardless of the sentiment, IPO first-day flipping behavior is influenced by the scarcity and cost qualities of the stock. At the same time, market volatility can have an impact on first-day IPO flipping behavior, but market volatility does not always exacerbate first-day IPO flipping behavior; rather, such volatility triggers the expected rate of return within allocated investors, further inhibiting or facilitating flipping behavior. This shows that allocated investors are generally rational people who seek to maximize their interests. However, due to the risk aversion factor, allocated investors may also exhibit some perverse behavior, especially under pessimistic sentiment, such as rising market risk-free rates that may exacerbate first-day IPO flipping behavior.
As for the anomaly of non-herding behavior, the mechanism of operation under the trigger theory suggests that market volatility and changes in the macro environment trigger changes in the expected return and the degree of risk aversion of the allotted investors, and the allotted investors combine the effects of these two factors to reinforce or change their own IPO first-day flipping behavior. Therefore, the two characteristics of allocated investors, namely expected return and risk aversion, are the deeper causes of first-day IPO flipping behavior and deserve further exploration.
This paper presents strong evidence on the impact and role of different investor sentiment cycles on investors' investment decisions in China’s IPOs, but our study also has some limitations. First, investor sentiment uses indirect indicators (market indicators), but any empirical analysis of direct measures based on sentiment may provide more important information because of its stronger relevance. Another limitation is that the stock market under study is relatively short established and the empirical results may be subject to some chance, a comparative study with other emerging markets, (e.g., Malaysia, Pakistan) is needed to observe whether differences and anomalies in investor decision making behavior also exist in similar emerging markets across different investor sentiment cycles.
Finally, for future research, firstly, if the sample size is large enough, research can be conducted by industry to observe whether there are different effects of different investor sentiment cycles in different industries and then the situation of several emerging markets can be compared with the international comparative perspective, and then compared with the situation of international developed markets which will provide a more intuitive understanding and insight into the impact of different investor sentiment cycles.
Data availability statement
The data used to support the findings of this study are included within the article.
Disclosure statement
No potential conflict of interest was reported by the authors.
References
- Aggarwal, R. (2003). Allocation of initial public offerings and flipping activity. Journal of Financial Economics, 68(1), 111–135. https://doi.org/10.1016/S0304-405X(02)00250-7
- Albada, A., Low, S.-W., & Toh, M. Y. (2022). Divergence of beliefs and IPO initial return: The quasi-moderating role of investor demand. Journal of Asian Business and Economic Studies, https://doi.org/10.1108/JABES-12-2021-0206
- Baker, M., & Wurgler, J. (2007). Investor sentiment in the stock market. Journal of Economic Perspectives, 21(2), 129–152. https://doi.org/10.2139/ssrn.962706
- Barinov, A. (2014). Turnover: Liquidity or uncertainty? Management Science, 60(10), 2478–2495. https://doi.org/10.2139/ssrn.1327297
- Baschieri, G., Carosi, A., & Mengoli, S. (2021). The decision to go public and the IPO underpricing with locally biased investors. The European Journal of Finance, 27(15), 1489–1444. https://doi.org/10.1080/1351847X.2021.1890632
- Bayley, L., Lee, P. J., & Walter, T. S. (2006). IPO flipping in Australia: Cross-sectional explanations. Pacific-Basin Finance Journal, 14(4), 327–348. https://doi.org/10.1016/j.pacfin.2006.01.002
- Bikhchandani, S., & Sharma, S. (2000). Herd behavior in financial markets. IMF Staff Papers, 47, 279–310. https://doi.org/10.2307/3867650
- Booth, J. R., & Chua, L. (1996). Ownership dispersion, costly information, and IPO underpricing. Journal of Financial Economics, 41(2), 291–310. https://doi.org/10.1016/0304-405X(95)00862-9
- Boulton, T., Francis, B. B., Shohfi, T., & Xin, D. (2021). Investor awareness or information asymmetry? Wikipedia and IPO underpricing. Financial Review, 56(3), 535–561. https://doi.org/10.1111/fire.12276
- Brown, G. W., & Cliff, M. T. (2004). Investor sentiment and the near term stock market. Journal of Empirical Finance, 11(1), 1–27. https://doi.org/10.1016/j.jempfin.2002.12.001
- Chen, H., & Zheng, M. (2021). IPO underperformance and the idiosyncratic risk puzzle. Journal of Banking & Finance, 131, 106190. https://doi.org/10.1016/j.jbankfin.2021.106190
- China Securities Investor Protection Fund Limited. (2020). 2019 National Stock Market Investor Status Survey Report. http://finance.sipf.com.cn/finance/app/zhuanTi/dcbg/20200327-pc-index
- Chou, P.-H., Chih, H.-H., Chou, R. K., & Gong, Y.-L. (2002). Behavioral finance: A literature review. Review of Securities and Futures Markets, 14, 1–48. 2 https://doi.org/10.6277/TER.2016.441.1
- Derrien, F. (2005). IPO pricing in "hot" market conditions: Who leaves money on the table? The Journal of Finance, 60(1), 487–521. https://doi.org/10.1111/j.1540-6261.2005.00736.x
- Dong, Y., & Huang, J. (2022). Price limits, investor sentiment, and initial public offering underpricing: A quasi-natural experiment based on ChiNext. Emerging Markets Review, 51, 100893. https://doi.org/10.1016/j.ememar.2022.100893
- Han, L., & Wu, Y. (2007). Investor sentiment and the puzzle of IPOs - Price suppression or premium. Management World, 3(11), 51–61. https://doi.org/10.19744/j.cnki.11-1235/f.2007.03.007
- Harrison, J. M., & Kreps, D. M. (1978). Speculative investor behavior in a stock market with heterogeneous expectations. The Quarterly Journal of Economics, 92(2), 323–336. https://doi.org/10.2307/1884166
- Heilman, R. M., Crişan, L. G., Houser, D., Miclea, M., & Miu, A. C. (2010).Emotion regulation and decision making under risk and uncertainty. Emotion, 10(2), 257–265.https://doi.org/10.1037/a0018489
- Hens, T., & Benli, V. F. (2021). Behavioral finance in the era of Covid-19. Press Academia, Procedia14(1), 106–107. https://doi.org/10.17261/Pressacademia.2021.1496
- Hong, H., Scheinkman, J., & Xiong, W. (2006). Asset float and speculative bubbles. The Journal of Finance, 61(3), 1073–1117. https://doi.org/10.1111/j.1540-6261.2006.00867.x
- Hughes, P. J., & Thakor, A. V. (1992). Litigation risk, intermediation, and the underpricing of initial public offerings. Review of Financial Studies, 5(4), 709–742. https://doi.org/10.1093/rfs/5.4.709
- Ibrahim, F. A., & Benli, V. F. (2022). Impact of investors sentiment on IPO performance: Evidence from NASDAQ and NYSE. Journal of Business, Economics and Finance (JBEF), 11(1), 1–14. https://doi.org/10.17261/Pressacademia.2022.1548
- Kao, L., Chen, A., & Lu, C.-S. (2022). Retail investor attention and IPO prices with a pre-IPO market. International Review of Economics & Finance, 82, 416–432. https://doi.org/10.1016/j.iref.2022.07.007
- Leahy, R. L., Tirch, D. D., & Melwani, P. S. (2012). Processes underlying depression: risk aversion, emotional schemas, and psychological flexibility. International Journal of Cognitive Therapy, 5(4), 362–379. https://doi.org/10.1521/ijct.2012.5.4.362
- Lee, C. M., Shleifer, A., & Thaler, R. H. (1991). Investor sentiment and the closed‐end fund puzzle. The Journal of Finance, 46(1), 75–109. https://doi.org/10.1111/j.1540-6261.1991.tb03746.x
- Lerner, J. S., & Keltner, D. (2000). Beyond valence: Toward a model of emotion-specific influences on judgement and choice. Cognition & Emotion, 14(4), 473–493. https://doi.org/10.1080/026999300402763
- Ljungqvist, A., Nanda, V., & Singh, R. (2006). Hot markets, investor sentiment, and IPO pricing. The Journal of Business, 79(4), 1667–1702. https://doi.org/10.1086/503644
- Loewenstein, G. F., Weber, E. U., Hsee, C. K., & Welch, N. (2001). Risk as feelings. Psychological Bulletin, 127(2), 267–286. https://doi.org/10.1037/0033-2909.127.2.267
- Lowry, M., & Shu, S. (2002). Litigation risk and IPO underpricing. Journal of Financial Economics, 65(3), 309–335. https://doi.org/10.1016/S0304-405X(02)00144-7
- Ma, Y., Liu, G., & Qi, C. (2022). IPO pricing, investor behavior, and IPO underpricing of high-tech companies: Evidence from SSE STAR market and Nasdaq market. Discrete Dynamics in Nature and Society, 2022, 1–14. https://doi.org/10.1155/2022/1711645
- Mello, A. S., & Parsons, J. E. (1998). Going public and the ownership structure of the firm. Journal of Financial Economics, 49(1), 79–109. https://doi.org/10.1016/S0304-405X(98)00018-X
- Polk, C., & Sapienza, P. (2009). The stock market and corporate investment: A test of catering theory. Review of Financial Studies, 22(1), 187–217. https://doi.org/10.1093/rfs/hhn030
- Ren, Y., & Han, Z. (2005). An empirical analysis of stock market rationality in China. Journal of Harbin Institute of Technology, 37, 1213–1215.
- Ritter, J. R. (1984). The "hot issue" market of 1980. The Journal of Business, 57(2), 215–240. https://doi.org/10.1086/296260
- Ritter, J. R., & Welch, I. (2002). A review of IPO activity, pricing, and allocations. The Journal of Finance, 57(4), 1795–1828. https://doi.org/10.1111/1540-6261.00478
- Shao, X., & Wu, H. (2009). A study on the placement and lock-in system of institutional investors in China’s IPOs. Management World, 10(14), 28–41. https://doi.org/10.19744/j.cnki.11-1235/f.2009.10.005
- Shao, X., Wu H., Qin J., & Wang D. (2010). China’s IPO market cycle: An analysis based on investor sentiment and government timing of issuance. Financial Research, 11(21), 123–143.
- Shao, X., Wu H., Li Z., & Tang D. (2011). The mystery of ultra-high turnover rate on the first day of IPO flipping in China. Financial Research, 9(16), 122–137.
- Shefrin, H., & Statman, M. (1985). The disposition to sell winners too early and ride losers too long: Theory and evidence. The Journal of Finance, 40(3), 777–790. https://doi.org/10.2307/2327802
- Swaminathan, B., & Purnanandam, A. (2004). Are IPOs really underpriced? Review of Financial Studies, 17, 811–848. 3 https://doi.org/10.2307/3598013
- Tini, S. M. (1988). Anatomy of initial public offerings of common stock. The Journal of Finance, 43.4, 789–822. https://doi.org/10.1111/j.1540-6261.1988.tb02606.x
- Wang, Y., & Wang, G. (2021). IPO underpricing and long-term performance in China: The perspective of price limit policy. Managerial Finance, 47(9), 1233–1252. https://doi.org/10.1108/MF-08-2020-0428
- Wang, Y., & Yao, J. (2020). Investor sentiment, issuance cost, and IPO underpricing: An empirical analysis of Shanghai Stock Exchange A-shares. Applied Economics Letters, 28(6), 508–509. https://doi.org/10.1080/13504851.2020.1761530
- Wei, X., Xia, W and., & Sun, T. (2014). A study of investor sentiment measurement in A-share market based on BW model. Management Insights, 33, 71–76. https://doi.org/10.3969/j.issn.1674-2877.2014.33.030
- Wooldridge, J. M. (2007). Introductory econometrics: A modern approach (3rd ed., pp. 205–211). Tsinghua University Press.
- Xian, Y. (2021). Social media sentiment and IPO pricing. Capital Markets: Market Efficiency eJournal. https://doi.org/10.2139/ssrn.3870563
- Xiao, Z. (2020). Rumination on the influence of trigger events on individual economic behavior - A study based on behavioral economics. China Business Journal, 11, 24–27. https://doi.org/10.19699/j.cnki.issn2096-0298.2020.11.024
- Zhang, D and., & Liao, S. (2009). A study of investor sentiment in China’s securities market. Securities Market Herald, 10, 61–68.
- Zhang, Z., & Liu, L. (2006). Changing hands and stock returns: Liquidity premium or speculative bubble? Econometrics (Quarterly), 5, 871–892.