
 ?Mathematical formulae have been encoded as MathML and are displayed in this HTML version using MathJax in order to improve their display. Uncheck the box to turn MathJax off. This feature requires Javascript. Click on a formula to zoom.
Abstract
In the current situation where organisations in general and educational institutions in particular, are achieving economic benefits at the cost of the environment, there is a need to have innovations to a substantial extent that can reduce environmental pollution and improve the economic benefits. The current study is an attempt to identify the potential contribution of technology innovation in driving sustainability, especially when it is powered by Political Influence, Performance-based budgeting, and organisational culture in educational institutions from China. Based on the data of 472 respondents, the application of PLS-SEM has reported significant associations among the proposed hypotheses. The findings revealed that all of the three measures, political influence, performance-based budgeting, and organisational culture, have significant effects on enhancing the level of technology innovation. Moreover, technology innovation also improves the organisation’s sustainable performance, which includes economic, environmental, and social. Based on the findings, the organisations in general and educational institutions in particular, are recommended to cultivate a culture encouraging technology innovation. In contrast, management is recommended to have performance-based budgeting to improve productivity and the level of efficiency.
1. Introduction
Policies governing environmental pollution are becoming an integral element of industrial rules and regulations, which is a step being taken towards sustainability, especially in developing economies like China (Wu et al., Citation2022). Moreover, these policies urge organisations in general and educational institutions in particular, to have technology innovation by which the intensity of consumption of energy leading to higher pollution is reduced (Taylor Citation2005). However, several international initiatives are being taken mutually by the international agencies and governments like ‘UN2030 Agenda for Sustainability’ that have demanded to have innovations to a substantial extent, which can lead to the reduction in environmental pollution and economic benefits (Jiang et al., Citation2018; Walsh et al., Citation2020). However, there is always a research question that is being asked by numerous researchers, whether mere regulations enforce companies in general and educational institutions in particular, to have sufficient technological innovation for attaining sustainability? Despite the claim made by Porter (Citation1991) that enforcing environmental protection regulations on the organisations leads to reduce the pollution made by these organisations respectively; however researchers have also reported a negative association between the two (Walker et al., Citation2008). Moreover, a group of researchers simply negated this idea and reported the absence of any significance in the relationship between environmental regulations and innovation (Jiang et al., Citation2018; Triebswetter & Hitchens, Citation2005; You et al., Citation2019).
The context of Chinese companies in general and educational institutions in particular, is different from the other companies when it comes to following the environmental-oriented regulations. It is assumed that since Chinese companies in general and educational institutions in particular, are more inclined toward attaining commercial success, they may have certain resistance to following the environmental rules and regulations, which leads them to undermine the obligatory responsibility of environmental protection (Lynch-Wood & Williamson, Citation2014; Simpson et al., Citation2004). Moreover, despite of the homogeneity of the enforcements being made to the organisations, there is a heterogeneity in the outcome when it comes to the compliance (Berrone et al., Citation2013; Colwell & Joshi, Citation2013). Furthermore, an evasion is also assumed to be made by the Chinese companies through which they simply dodge the compliance of the regulations through different approaches (Williamson et al., Citation2006; Worthington & Patton, Citation2005). However, as highly proposed by DiMaggio and Powell (Citation1983), the role of political influence as an important pressure cannot be over-ruled.
On the other hand, despite the agreement on the maxim that efficient utilisation of resources leads to financial excellence and competitive advantage, the measures by which the utilisation is maximised are still in debate (Chege & Wang, Citation2020; Coyne, Citation1986). One of the potential measures that can govern the consumption of resources is Performance-based budgeting (PBB). PBB is different from the conventional way of budgeting as it is more systematic and performance-driven (Heinicke & Guenther, Citation2020). It utilises the information related to performance and outcome for strengthening the linkage between outcome achieved and resources utilised. The other differentiating attribute of PBB is that it is not deployed for awarding on success or punishing on failure; instead, it is deployed to maximise productivity and resource consumption (Amirkhani et al., Citation2019). Moreover, because of this attribute, the firms in general and educational institutions in particular, can be more handy in terms of relocating the funds from lower profit generating avenues to more profitable destinations. The implementation of PBB is comparatively new for Chinese companies in general and educational institutions in particular; that’s why no definite conclusion has been drawn yet. Hence, because of the uniqueness of Chinese culture, especially regarding the political influence, the potential of PBB in deriving the technological innovation for sustainability needs to be explored.
In addition to the external pressure and channelisation of the resources for incorporating innovation into the operations and processes of the organisation, internal acceptance and receptivity also need to be present within the organisation (Zeb et al., Citation2021). Such internal acceptance and receptivity are sustained by the organisational culture, which is the combination of norms, attitudes and sharing of beliefs within the organisation (Aldhuwaihi, Citation2013; Harrison & Corley, Citation2011). Therefore, the role of organisational culture is instrumental, especially in the context of incorporating innovation (Zeb et al., Citation2021). The existing literature related to organisational culture and innovation is majorly comprised of the studies discussing from the employees’ perspective and hence have explored the role of human-oriented factors like job performance, monetary incentives, job assignment, role delegation, job rotation, and role of quality circles (Cabello et al., Citation2005; Laursen, Citation2002). Hence, the studies exploring an organisational perspective are dearth and are a potential avenue for extended exploration.
The objective of the current study, in accordance with the aforementioned discussion, is to identify the potential contribution of technology innovation in driving sustainability, especially when it is powered by Political Influence, Performance-based budgeting, and organisational culture in higher educational institutions in China. The selection of the Chinese context is made because of its contribution to the national and global economies. Moreover, because of more inclined toward commercial success, Chinese organisations in general and higher educational institutions in particular, are assumed to sway the legal obligations precisely related to the environment and sustainability (Lynch-Wood & Williamson, Citation2014; Simpson et al., Citation2004). These arguments make the case of the current study more vital for extended and legitimate exploration. The organisation of the study is made as the following section discusses the development of the hypotheses, followed by methodology and statistical analysis, whereas in the last section, the investigation is concluded, and recommendations are proposed.
2. Literature review
2.1. Political influence and technology innovation
DiMaggio and Powell (Citation1983), who has proposed the Institutional Theory, have summarised the potential forces which have the tendency to influence the decision-making of any institution or organisation. The overall understanding drawn from this theory is that the process of decision-making done by any organisation in general and educational institutions in particular, is not completed in isolation. In contrast, certain forces do influence the process of decision-making (Jianxun et al., Citation2021). The most influential and powerful forces are categorised as ‘Coercive Pressures’, including political institutions, regulatory bodies, and law enforcement agencies (DiMaggio & Powell, Citation1983, Pfeffer & Salancik, Citation1978). Technology Innovation, which is adopted and then accordingly evolved, is done to improve productivity and efficiency by catering to all aspects of sustainability (Abbasi et al., Citation2022). Numerous researchers are in agreement in terms of the role of Technology Innovation in eradicating environmental pollution and achieving social well-being (Sinha et al., Citation2020; Yang & Li, Citation2017). In addition to this, the political influence led by the coercive pressures enhances the technology innovation, which derives the organisation with the development of new technology, product, and services covering the philosophy of sustainability (Kemp & Pearson, Citation2007; You et al., Citation2019). Therefore, it has been proposed as:
H1: Political Influence significantly enhances the Technology Innovation
2.2. Political influence, environmental performance and social performance
As already discussed, the role of political influence in bringing in sustainable development and enhancing the subsequent performance of the organisation in general and educational institutions in particular, cannot be ignored (Jianxun et al., Citation2021; Wu et al., Citation2022). Precisely in the context of China, the government and the regulatory bodies have stringent formal regulations, which force the organisations in general and educational institutions in particular, to opt for technologies, and operations as well as motivating them with the development of environment protection capabilities that provide assistance in increasing environmental and social performance (Hart & Dowell, Citation2011; Yang & Yang, Citation2015). Moreover, when the political entities for sustainability are forcing organisations in general and educational institutions in particular, they are more likely to proactively develop their reputation in terms of sustainability by improving their contribution to the environment and contributing to society (Agan et al., Citation2013; Amores-Salvadó et al., Citation2014). With the passage of time, several Chinese firms agree on the legitimacy of having a sense of responsibility in improving their contribution to society (Zhou et al., Citation2017). However, this agreement on the responsibility of the Chinese firms in general and educational institutions in particular, is mainly dependent and motivated by the Political Influence that is accordingly faced by these firms (Jianxun et al., Citation2021; Wu et al., Citation2022). Therefore, it has been proposed as:
H2: Political Influence significantly enhances the Environmental Performance
H3: Political Influence significantly enhances the Social Performance
2.3. Performance-based budget and technology innovation
Performance-based Budget (PPB) has been explained as the structured and organised utilisation of resources, including information, with the objective of strengthening the linkage between consumption of resources and performance outcome (Mauro et al., Citation2017). It is extremely different from the conventional way of budgeting as conventional budgeting is being done on the basis of inputs, whereas PPB is being done with a focus on outputs (Heinicke & Guenther, Citation2020). On the other hand, technology innovation has been considered as a tool through which a firm can draw a competitive advantage in the market (Chege & Wang, Citation2020). Innovation is conventionally explained as incorporating a change in the existing operations to improve productivity and efficiency (Chege & Wang, Citation2020). In addition to this, Rogers (Citation2003) explained innovativeness as a holistic approach through which novelty, uniqueness, and change are implemented in the organisation, giving the firm a competitive advantage and improving its performance in terms of timeliness, cost-effectiveness and quality management. This is the reason because of why innovation has been considered a tool of survival for the economy and the strategy for attaining economic growth, competitiveness, and productivity (Pittaway et al., Citation2004; Rogers, Citation2003). However, it should be noted that despite a need to have technology innovation, there is also a need to have sufficient financial resources which can complement the process of technology innovation and accordingly transform it for achieving competitiveness and financial excellence (Amirkhani et al., Citation2019; Chege & Wang, Citation2020). Therefore, it has been proposed as:
H4: Performance-based Budget significantly enhances the Technology Innovation
2.4. Organizational culture and technology innovation
Organizational Culture has been explained as the collective and shared norms, values, attitudes, meanings, and understandings among the members and participants of any organisation (Aldhuwaihi, Citation2013; Harrison & Corley, Citation2011). Moreover, Organizational Culture plays a very important role in bringing innovation to the organisation, which is also agreed by numerous researchers (Scaliza et al., Citation2022). Since the behaviour of the employee is highly influenced by the culture of the organisation to which he belongs, therefore linkage of innovation-driven organisational culture leading to performance has also been studied by numerous researchers (Chang & Lin, Citation2007; Mortara & Minshall, Citation2011). Few of the examples in that have been explored in understanding the aforementioned linkage include: employees’ resistance towards change, knowledge transfer and sharing among the fellow workers, and un-willingness to accept the innovation that can lead to nurturing the innovation within organisations (Büschgens et al., Citation2013; Hogan & Coote, Citation2014; Wiener et al., Citation2018). The organisation’s stakeholders’ internal receptivity is crucial and can create a difference when it comes to the adoption and acceptance of technology innovation (Scaliza et al., Citation2022). Therefore, it has been proposed as:
H5: Organizational Culture significantly enhances the Technology Innovation
2.5. Organizational culture and economic performance
As already mentioned, the employees’ attitude, behaviour, and aptitude are highly influenced by organisational culture (Chang & Lin, Citation2007; Mortara & Minshall, Citation2011). Therefore, organisational culture is also reported to enhance organisational performance (Tarba et al., Citation2019). Moreover, according to the theoretical foundations of the Resource-Based View, the organisational culture is an important element in attaining competitive advantage, which enables the organisation to improve its economic performance (Coyne, Citation1986) eventually. However, the association of performance is highly dependent on the nature of the organisational culture. For instance, organisations that possess a culture of flexibility have been reported to have a higher level of economic output (Gordon & DiTomaso, Citation1992). On the other hand, organisations that follow a market-oriented culture have also shown a positive association. However, organisations with hierarchical and clan cultures have reported a weak association with performance (Denison & Mishra, Citation1995; Deshpandé et al., Citation1993). Nevertheless, enough evidence reported either a high or low association between organisational culture and economic performance. Therefore, it has been proposed as:
H6: Organizational Culture significantly enhances the Economic Performance
2.6. Technology innovation and sustainability performance
The literature discussing the association between innovation and performance has explored various aspects, especially innovation. These include product innovation, in which the advancement in the product offerings is discussed; process innovation, in which the advancement in the process with the objective of improving the efficiency is discussed; organisational innovation, which encompasses the innovation deployed through practices, strategies, and business operations; and marketing innovation, in which advancements are being made in order to increase the market share through improving marketing and advertising strategies (Zeb et al., Citation2021). On the other hand, implementing technology for achieving sustainability acts as a cross-cutting tool that is equally beneficial for improving ecological, economic, and social performance (Chege & Wang, Citation2020; ITU., Citation2018). Because of the technological innovation, the firms are able to introduce new product and service in the market, which is different, novel and innovative (Chege & Wang, Citation2020). From the societal perspective, incorporating the philosophy of corporate social responsibility enables the firms to extend innovation in their product offering while improving social performance (Briones Peñalver et al., Citation2018; Reverte et al., Citation2016). From an environmental perspective, implementing technology innovation can extend firms’ capabilities to improve eco-efficiency, implement green practices, reduce environmental pollution, and transition towards cleaner production (Besser, Citation2012; Soundararajan et al., Citation2018). From an economic perspective, implementing technology innovation can extend firms’ productivity, efficiency, and resource utilisation capability, which decreases the level of unnecessary waste, leading to improved economic performance (Chege & Wang, Citation2020). Therefore, it has been proposed as:
H7: Technology Innovation significantly enhances the Economic Performance
H8: Technology Innovation significantly enhances the Environmental Performance
H9: Technology Innovation significantly enhances the Social Performance
H8: Economic Performance significantly enhances the Environmental Performance
H9: Economic Performance significantly enhances the Social Performance
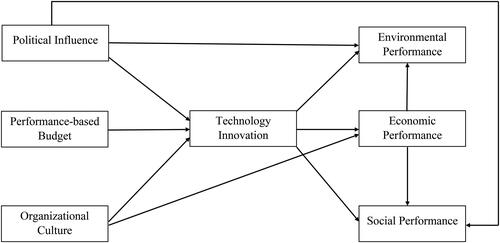
Figure 1. Framework of the study.
Source: Authors' Construction.
3. Methodology
For the purpose of assessing the proposed hypotheses, the current study follows the Quantitative Research Methodology. This methodology enables the researcher to extract the findings from the collected data through the application of quantitative techniques. This methodology further assists the researcher with generalising the findings toward the large portion of the population by collecting the data from a relatively small sample size (Cooper et al., Citation2006). Moreover, Quantitative Research Methodology is relatively easy to be employed because of its edge in terms of objectivity over the Qualitative Research Methodology, which is more subjective. Furthermore, within the Quantitative Research Methodology, the current study follows the Survey Research Design. This research design helps the researcher with the data collection procedure through the questionnaire, which can either be structured or unstructured. Because of the benefits of utilising the structured questionnaire, the current study structured questionnaire was developed based on the scales adapted from the existing literature, keeping in mind their robustness and legitimacy to gauge the studied phenomena.
In addition to this, the survey methodology is prone to capture certain variances, for which researchers need to have due diligence during the operationalisation of such research. Additionally, propositions by Hulland et al. (Citation2018) were incorporated during the execution of the survey methodology, which reduces the possibilities of operational variances and biases. Among those unwanted biases, numerous researchers warn about the bias is the Common Method Bias (Podsakoff et al., Citation2003). Such bias can be countered by operational means and statistical means, which are accordingly incorporated during the present study’s operationalisation. The operational means need to be followed before the data collection, whereas the statistical means need to be followed after the data collection (Podsakoff et al., Citation2012).
In the operational means, the most important aspect is the design of the questionnaire. It entails that the questionnaire needs to have the qualities of easy comprehension and navigation for the potential respondents, which further decreases mental stress. Such elimination of mental stress is crucial in order to have legitimate responses from the respondents. For that purpose, the questionnaire is divided into two sections. The first section comprises the questions related to the measurements of the studied phenomena. Moreover, the measurements were adapted from the existing literature to have the least mental stress, which has established their reliability and robustness by already addressing different geographical contexts. These measurements were also validated by a panel of experts who endorsed the legitimacy and efficacy of the measurements. This step was taken to cross-check the face and content validity of the questionnaire. The questions measuring studied phenomena are asked on the Likert scale seeking the level of agreement of the respondents where ‘1 represents Strongly Disagree’, ‘2 represents Disagree’, ‘3 represents neither Disagree nor Agree’, ‘4 represents Agree’, and ‘5 represents Strongly Agree’. The sources from which the measurements were adapted are listed in .
Table 1. Source of measures.
The second section of the questionnaire comprised of questions related to the demographic profiles of the respondents. Since the current study is based on the higher education institution students who are also working professionals employed in firms operating in China and as the objectives of the current study revolve around sustainability, the data is collected from the students who are employed by the firms that are ISO 140001 certified. This certification is an indication that the addressing organisations are complying with the environmental rules and regulations. In addition to this, the data is collected from the working students during their development and education program in Chinese based higher educational institutions. Initially, 800 questionnaires were distributed among the respondents, from which the researchers got around 550 responses. These responses were also passed through the procedure of data screening, in which the identification of the outliers led to the elimination of further 78 responses, including both univariate and multivariate. For data screening, procedures and measures suggested by Hair et al. (Citation2010) were followed. For minimum sample size, Hair et al. (Citation2016) stated a ten times rule as per that for every construct there must be 10 responses that lead to the minimum sample of 70. Hence, the final data of 472 respondents also meet the minimum sample size requirement for the current study.
As discussed by Podsakoff et al. (Citation2012), the statistical means need to be implemented after the process of data collection. This is required to assess whether the collected data is robust, reliable, and free from any unwanted methodological variance that could lead to inferior results. Therefore Harman’s (Citation1967) single factor test was applied. This test was applied because of its popularity among social scientists. The outcome reported through the application of Harman’s (Citation1967) single factor test declares the data free from any sort of unwanted methodological variance.
These 472 students who are also working professionals comprised 45% females and 55% males. Moreover, their age decomposition revealed that the majority of the respondents which is 41%; belong to the age group of 31–40 years, followed by 26% of the respondents who belong to the age group of less than 30 years; whereas 20% of the respondents belong to the age group of 41–50 years and 13% of the respondents belong to the age group of 51 years and above. In terms of scalability, the majority of the respondents belong to the companies that employed a workforce having 101–250 employees; followed by 21% of the respondents belonging to the companies that employed a workforce having 251–450 employees; whereas 20% of the respondents belong to the companies that employed the workforce having less than 100 employees and 18% of the respondents belong to the companies that employed the workforce more than 450 employees. The decomposition of the data in terms of the nature of the industry reveals that the majority of the respondents which is 37%, belong to the electronic industry; followed by 27% of the respondents that belong to the automobile industry; followed by 20% of the respondents that belong to the chemical industry; whereas 10% of the respondents that belong to the pharmaceutical industry; followed by 6% of the respondents that belong to the industry other than these. The decomposition of the demographic profile of the respondents is listed in .
Table 2. Descriptive statistics.
4. Estimations and results
For the purpose of assessing the proposed hypotheses, and in accordance with the collected data through the Survey Research Methodology, the current study utilises OLS based second-generation technique named ‘Partial Least Square-Structural Equation Modelling’ (PLS-SEM). This technique enables the researcher to empirically assess multiple criterion variables in a single setting which the first-generation techniques are not capable of. Additionally, PLS-SEM is the variance-based SEM superior to traditional covariance-based SEM in explaining more data variation and handling complex frameworks (Hair et al., Citation2019). Hence, because of the benefits associated with the PLS-SEM, the statistical analysis was performed through the assistance of SmartPLS software, the most user-friendly software available among the alternatives and designed by Ringle et al. (Citation2015).
In addition to this, for the application of PLS-SEM, the propositions discussed by Hair et al. (Citation2016) are followed. Precisely, Hair et al. (Citation2016) suggested that PLS-SEM application should be made in two steps. The first step requires the assessment of the measurement model. The second step requires the assessment of the structural model. Following these propositions, the assessment and the generated outcome are discussed in the subsequent sections.
4.1. Assessment of the measurement model
According to the propositions of Hair et al. (Citation2016), the assessment of the measurement model includes ascertaining the kind and nature of relationships between measurements of the variables with the variables, respectively. Moreover, this step involves assessing two kinds of validity: Convergent Validity and Discriminant Validity. Convergent Validity has been explained as the extent of convergence that the measuring items of a variable show, which eventually forces them to make a construct (Mehmood & Najmi, Citation2017). This validity is ensured by three sub-criteria: Factor Loadings, Reliability, and ‘Average Variance Extracted’ (AVE). For factor loadings, which represent the explanation of the variance of a measurement variable, also referred to as the observed variable, Hair et al. (Citation2016) suggested the threshold of 0.7. The outcome recorded in clearly authenticates the meeting of the criteria as all of the values are greater than 0.7. For Reliability which represents the internal consistency and is assessed by Cronbach’s Alpha and Composite Reliability, Hair et al. (Citation2016) suggested the threshold of 0.7. The outcome recorded in clearly authenticates the meeting of the criteria as all of the values are greater than 0.7. For AVE, which represents the average of the total variance explained by the measuring items of a construct altogether, Hair et al. (Citation2016) suggested the threshold of 0.5. The outcome recorded in clearly authenticates the meeting of the criteria as all of the values are greater than 0.5.
Table 3. Measurement model results.
On the other hand, the other validity, which is Discriminant Validity, has been explained as the extent of divergence that the measuring items of a variable show from the measuring items of other variables. This tendency leads them to eventually make different constructs (Mehmood & Najmi, Citation2017). In the current study, the assurance of Discriminant Validity was made through three criteria. The first criterion is cross-loadings. According to this criteria, a factor must be highly loaded within its construct and should have minimum loadings into the other constructs. Moreover, while comparing the loadings and cross-loadings, the difference should be greater than 0.1 (Gefen & Straub, Citation2005). The outcome recorded in clearly authenticates the meeting of the criteria as all of the loadings are greater than within their construct, and the difference of the cross-loadings is greater than 0.1.
Table 4. Results of loadings and cross loadings.
The second criterion is the Fornell and Larcker criterion (1981). This is one of the most frequently used criteria to assess Discriminant Validity. As per this criteria, the square root of AVE of every construct should be higher than the correlation values of that particular construct with the correlations of all other constructs. This criterion is mentioned in . In , the values which are formatted as highlighted, bold, and are placed at the diagonal places represent the square root of AVE, whereas all other values which are placed at locations other than diagonal positions represent the value of correlations. The outcome clearly reflects that the diagonal values are greater for every construct, whereas off-diagonal values are lower.
Table 5. Discriminant validity Fornell-Larcker criterion.
The third criterion that is utilised in the current study is the ‘Heterotrait-Monotrait ratio of correlations’ (HTMT), which is recently come into lame light since its proposition by Henseler et al. (Citation2015) because of its robustness and rigorousness. This criterion is the ratio of the correlational value across the constructs and the correlations of the constructs. Henseler et al. (Citation2015) proposed that the cut-off value where HTMT is established is 0.85. The outcome recorded in clearly authenticates the meeting of the criteria as all of the values are lower than 0.85.
Table 6. Results of HTMT ratio of correlations.
4.2. Assessment of the structural model
In this step, the tendency and quality of prediction and explanation made by the predictor variable(s) of criterion variable(s) are ascertained. This includes understanding the capability and relevancy, and its accuracy is determined by two criteria. These are named ‘coefficient of determination’ and ‘Cross-Validated Redundancy’. The ‘coefficient of determination’ is gauged by the outcome of R-Square. Different statisticians claim different threshold levels. Following the claims by Cohen (Citation1988), the explanation is said to be substantial when the value of R-Square is reported to be larger than 0.26 and should be considered weak if found below 0.02. However, any value in-between the aforementioned levels should be considered moderate. For ‘Cross-Validated Redundancy’, which is computed on the statistical framework of Stone Geisser’s methodology, the accepted value could be anything greater than zero (Hair et al., Citation2016). The outcome recorded in clearly authenticates the meeting of the discussed criteria.
Table 7. Predictive power of construct.
4.3. Hypotheses testing
The additional advantage of PLS-SEM through SmartPLS is the computation of statistical significance by following the Bootstrapping methodological framework. In this framework, the significance is computed after drawing a number of sub-samples from the dataset. Though the drawing of sub-samples is entirely up to the researchers, however Hair et al. (Citation2016) recommended the drawing of 5000 subsamples which is accordingly followed in the current study.
For understanding the extent and nature of the association between political influence and technology innovation, the relationship is reported as significant and positive, with a coefficient of 0.327 This is the reflection that 32.7% of increment is expected in technology innovation through political influence. This relationship is interpreted as when an organisation in general and educational institutions in particular, perceives a certain level of influence politically from the government institutions, including financial institutions and law enforcement agencies, the organisation is more inclined to have technological innovation within their operations to improve their existing operations for achieving excellence and moving towards newer technological adaptations. These findings are complementing the earlier researches who have reported the similar outcome (Abbasi et al., Citation2022; Jianxun et al., Citation2021; You et al., Citation2019). For understanding the extent and nature of the association between performance-based budgeting and technology innovation, the relationship is reported as significant and positive, with a coefficient of 0.192
This reflects that 19.2% of increment is expected in technology innovation through performance-based budgeting. This relationship is interpreted as when an organization in general and educational institutions in particular, drafts budget based on targets and the roadway to achieve those targets; the organisation is more inclined to have technological innovation within their operations to improve their existing operations to achieve excellence and move towards newer technological adaptations. These findings are complementing the earlier researches who have reported the similar outcome (Amirkhani et al., Citation2019; Chege & Wang, Citation2020; Heinicke & Guenther, Citation2020).
For understanding the extent and nature of the association between organisational culture and technology innovation, the relationship is reported as significant and positive, with a coefficient of 0.263 This reflects that 26.3% of increment is expected in technology innovation through organisational culture. This relationship is interpreted as when an organisation in general and educational institutions in particular, creates and cultivates a culture of mutual respect, commitment, compliance to the rules and regulations, cooperation and unity; the organisation is more inclined to have technological innovation within their operations to improve their existing operations to achieve excellence and move towards newer technological adaptations. These findings are complementing the earlier researches who have reported the similar outcome (Scaliza et al., Citation2022; Wiener et al., Citation2018). For understanding the extent and nature of the association between political influence and environmental performance, the relationship is reported as significant and positive, with a coefficient of 0.265
This reflects that 26.5% of increment is expected in environmental performance through political influence. This relationship is interpreted as when an organisation in general and educational institutions in particular, perceives a certain level of influence politically from government institutions, including financial institutions and law enforcement agencies; the organisation is more inclined to improve its contribution to the environment by improving its performance. This could be done by implementing environment-friendly technologies, taking green initiatives, reducing carbon and greenhouse gas emissions, reducing carbon footprints, etc. Such initiatives will improve the organisation’s environmental performance and benefit society and humanity. These findings are complementing the earlier researches who have reported the similar outcome (Jianxun et al., Citation2021; Wu et al., Citation2022).
For understanding the extent and nature of the association between political influence and social performance, the relationship is reported as significant and positive, with a coefficient of 0.147 This reflects that 14.7% of increment is expected in social performance through political influence. This relationship is interpreted as when an organisation in general and educational institutions in particular, perceives a certain level of influence politically from government institutions, including financial institutions and law enforcement agencies; the organisation is more inclined to improve its contribution to society by improving its performance. This could be done through initiatives including charity drives, donations, and the steps taken to enhance the well-being of socially deprived people. These findings are complementing the earlier researches who have reported the similar outcome (Jianxun et al., Citation2021; Wu et al., Citation2022). For understanding the extent and nature of the association between organisational culture and economic performance, the relationship is reported as significant and positive, with a coefficient of 0.169
This reflects that 16.9% of increment is expected in economic performance through organisational culture. This relationship is interpreted as when an organisation in general and educational institutions in particular, creates and cultivates a culture of mutual respect, commitment, compliance to the rules and regulations, cooperation, and unity; the organisation is more inclined to have excellence within their operations, whereas by improving their existing operations the financial and economic performance of the organisation will be enhanced. These findings are complementing the earlier researches who have reported the similar outcome (Tarba et al., Citation2019).
For understanding the extent and nature of the association between technology innovation and all three kind of performances of sustainability, the relationship is reported as significant and positive, with a coefficient of 0.223 for environmental performance coefficient of 0.169 for economic performance
and coefficient of 0.229 for social performance
This reflects that 22.3% of increment is expected in environmental performance, 16.9% of increment is expected in economic performance, and 22.9% of increment is expected in social performance through technology innovation. This relationship is interpreted as when an organisation in general and educational institutions in particular, creates and cultivates acceptance of technological innovation through research and development, collaborating for new product development, and improving the existing operational processes; the organisation is more inclined to improve its contribution to the environment, society, and financial position by improving its performance. This could be done by implementing environment-friendly technologies, taking green initiatives, reducing carbon and greenhouse gas emissions, reducing carbon footprints, etc. Such initiatives will improve the organisation’s environmental performance and benefit society and humanity. Moreover, initiatives including charity drives, donations, and the steps taken to enhance the well-being of socially deprived people will help bring social change, whereas improving resources consumption can enhance the level of financial performance. These findings are complementing the earlier researches who have reported the similar outcome (Briones Peñalver et al., Citation2018; Chege & Wang, Citation2020; Zeb et al., Citation2021).
Lastly, for understanding the extent and nature of the association of economic performance with environmental performance and social performance, the relationship is reported as significant and positive, with a coefficient of 0.354 for economic performance and environmental performance and a coefficient of 0.266 for economic performance and social performance
This reflects that 35.4% of increment is expected in environmental performance, and 26.6% of increment is expected in social performance through economic performance. This relationship is interpreted as when an organization in general and educational institutions in particular, improves its operational excellence, financial position, and economic well-being, it can eventually improve its environmental and social performance. This is because by improving the financial performance, the organisation will have sufficient financial resources that can be invested in environmentally friendly technologies and green initiatives, whereas expenditure incurred for improving social reputation and performance is also a non-profit-making operation. Therefore for improving the other two aspects of sustainable performance, the improvement in economic performance is a pre-requisite, crucial, pivotal, and mandatory. These findings are complementing the earlier researches who have reported the similar outcome (Ahmed et al., Citation2020; Chege & Wang, Citation2020). The generated outcome is summarised in and , respectively.
Figure 2. Output of the PLS-SEM.
Source: Authors' Construction.
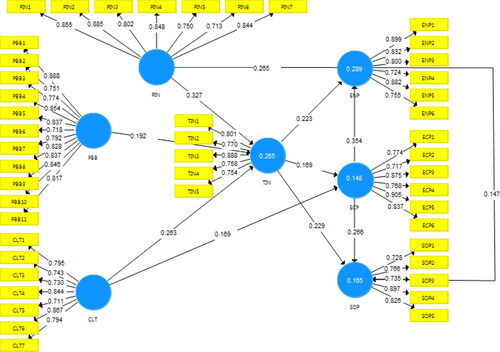
Table 8. Results of path coefficients.
5. Conclusion and recommendations
Environmental pollution is an issue that has brought the attention of both local and international agencies and governments. Accordingly, several initiatives are taken mutually by the international agencies and governments like ‘UN2030 Agenda for Sustainability’ that have demanded to have innovations to a substantial extent, which can lead to the reduction in environmental pollution and improvement to the economic benefits. Though innovation is needed to improve the existing processes and operations, its relationship with organisational performance, especially in terms of sustainability, has reported contrasting evidence.
It is assumed that Chinese companies are more inclined toward attaining commercial success and have some level of resistance in meeting the environmental objectives at the cost of financial success. Hence the current study is an attempt to identify the potential contribution of technology innovation in driving sustainability, especially when it is powered by Political Influence, Performance-based budgeting, and organisational culture in China. Based on the data of 472 respondents, the application of PLS-SEM have reported the significant associations among the proposed hypotheses. The findings revealed that all of the three measures, political influence, performance-based budgeting, and organisational culture, have significant effects on enhancing the level of technology innovation. Moreover, technology innovation also leads to improving the organisation’s sustainable performance, which includes economic, environmental, and social.
Based on the outcome, there are various recommendations that the current study offer. Firstly, organisations need to transform the existing way of budgeting to performance-based budgeting. Through the help of this kind of budgeting, the organisation in general and educational institutions in particular, will be in a better position to identify the more revenue-generating avenues that enable them to shift the investments accordingly. Secondly, the role of political influence has been proven; therefore, organisations need to have a higher level of compliance with the rules governing environmental protection. This should be done before certain penalties are being imposed on the organisations based on non-compliance. Thirdly, the development and improvement of organisational culture can also make a difference, especially in the scenario where organisations are towards implementing change and innovation. Fourthly, technology innovation is found as the potential solution to achieve sustainable performance; hence there is a need to develop, accept and adopt the innovation being introduced in the organisation as it reaps economic, environmental, and social benefits. Lastly, economic performance needs to be improved for improving social and environmental performance. Hence, resource allocation and utilisation should be done by which the economic performance is improved as through it; the other two performances can also be improved.
Based on the current study’s limitations, there are various propositions for future research. Firstly, all of the studied three forces, political influence, Performance-based budgeting, and organisational culture, are huge areas that require fresh exploration, especially in the post-pandemic scenario. Secondly, the current study explores the linear relationships among the studied variables. Hence there is a need to explain the non-linear and asymmetric relationships among the variables. Thirdly, current research is done on the ISO certified organisations’ professionals enrolled in the Chinese based higher educational institutions engaged in the manufacturing operations; therefore, exploration of service-providing companies could lead to different outcomes. Lastly, the current study is based on the companies from China, and hence there will be a limitation on the generalising of the findings belonging to the companies from other countries and regions.
Disclosure statement
No potential conflict of interest was reported by the authors.
References
- Abbasi, K. R., Hussain, K., Haddad, A. M., Salman, A., & Ozturk, I. (2022). The role of financial development and technological innovation towards sustainable development in Pakistan: Fresh insights from consumption and territory-based emissions. Technological Forecasting and Social Change, 176, 121444. https://doi.org/10.1016/j.techfore.2021.121444
- Agan, Y., Acar, M. F., & Borodin, A. (2013). Drivers of environmental processes and their impact on performance: A study of Turkish SMEs. Journal of Cleaner Production, 51, 23–33. https://doi.org/10.1016/j.jclepro.2012.12.043
- Ahmed, W., Najmi, A., & Ikram, M. (2020). Steering firm performance through innovative capabilities: A contingency approach to innovation management. Technology in Society, 63, 101385. https://doi.org/10.1016/j.techsoc.2020.101385
- Aldhuwaihi, A. (2013). The influence of organisational culture on job satisfaction, organisational commitment and turnover intention: A study on the banking sector in the Kingdom of Saudi Arabia [Doctoral dissertation, Victoria University].
- Amirkhani, T., Aghaz, A., & Sheikh, A. (2019). An implementation model of performance-based budgeting. International Journal of Productivity and Performance Management, 69(2), 382–404. https://doi.org/10.1108/IJPPM-05-2018-0171
- Amores-Salvadó, J., Martín-de Castro, G., & Navas-López, J. E. (2014). Green corporate image: Moderating the connection between environmental product innovation and firm performance. Journal of Cleaner Production, 83, 356–365. https://doi.org/10.1016/j.jclepro.2014.07.059
- Berrone, P., Fosfuri, A., Gelabert, L., & Gomez‐Mejia, L. R. (2013). Necessity as the mother of 'green’inventions: Institutional pressures and environmental innovations. Strategic Management Journal, 34(8), 891–909. https://doi.org/10.1002/smj.2041
- Besser, T. L. (2012). The consequences of social responsibility for small business owners in small towns. Business Ethics: A European Review, 21(2), 129–139. https://doi.org/10.1111/j.1467-8608.2011.01649.x
- Briones Peñalver, A. J., Bernal Conesa, J. A., & de Nieves Nieto, C. (2018). Analysis of corporate social responsibility in Spanish agribusiness and its influence on innovation and performance. Corporate Social Responsibility and Environmental Management, 25(2), 182–193. https://doi.org/10.1002/csr.1448
- Büschgens, T., Bausch, A., & Balkin, D. B. (2013). Organisational culture and innovation: A meta-analytic review. Journal of Product Innovation Management, 30(4), 763–781.
- Cabello, C., Carmona, A., & Valle, R. (2005). Characteristics of innovative companies: A case study of companies in different sectors. Creativity and Innovation Management, 14(3), 272–287.
- Chang, S. E., & Lin, C.-S. (2007). Exploring organisational culture for information security management. Industrial Management & Data Systems, 107(3), 438–458.
- Chege, S. M., & Wang, D. (2020). The influence of technology innovation on SME performance through environmental sustainability practices in Kenya. Technology in Society, 60, 101210. https://doi.org/10.1016/j.techsoc.2019.101210
- Cohen, J. (1988). Statistical power analysis for the behavioral sciences (2nd ed.). Academic Press [Database].
- Colwell, S. R., & Joshi, A. W. (2013). Corporate ecological responsiveness: Antecedent effects of institutional pressure and top management commitment and their impact on organisational performance. Business Strategy and the Environment, 22(2), 73–91.
- Cooper, D. R., Schindler, P. S., & Sun, J. (2006). Business research methods (Vol. 9, pp. 1–744). Mcgraw-hill.
- Coyne, K. (1986). Sustainable competitive advantage—What it is and what it isn’t. Business Horizons, 29(1), 54–61. https://doi.org/10.1016/0007-6813(86)90087-X
- Denison, D., & Mishra, A. (1995). Toward a theory of organisational culture and effectiveness. Organization Science, 6(2), 204–223. https://doi.org/10.1287/orsc.6.2.204
- Deshpandé, R., & Farley, J. U. (2004). Organisational culture, market orientation, innovativeness, and firm performance: An international research odyssey. International Journal of Research in Marketing, 21(1), 3–22.
- Deshpandé, R., Farley, J. U., & Webster, F. E. Jr, (1993). Corporate culture, customer orientation, and innovativeness in Japanese firms: A quadrad analysis. Journal of Marketing, 57(1), 23–37. https://doi.org/10.1177/002224299305700102
- Dey, P. K., Malesios, C., De, D., Chowdhury, S., & Abdelaziz, F. B. (2020). The impact of lean management practices and sustainably-oriented innovation on sustainability performance of small and medium-sized enterprises: Empirical evidence from the UK. British Journal of Management, 31(1), 141–161. https://doi.org/10.1111/1467-8551.12388
- DiMaggio, P. J., & Powell, W. W. (1983). The iron cage revisited: Institutional isomorphism and collective rationality in organisational fields. American Sociological Review, 48(2), 147–160. https://doi.org/10.2307/2095101
- Fornell, C., & Larcker, D. F. (1981). Evaluating structural equation models with unobservable variables and measurement error. Journal of Marketing Research, 18(1), 39–50. https://doi.org/10.1177/002224378101800104
- Gao, Y. (2017). Business leaders’ personal values, organisational culture and market orientation. Journal of Strategic Marketing, 25(1), 49–64. https://doi.org/10.1080/0965254X.2015.1076879
- Gefen, D., & Straub, D. (2005). A practical guide to factorial validity using PLS-Graph: Tutorial and annotated example. Communications of the Association for Information Systems, 16(1), 5.
- Gordon, G., & DiTomaso, N. (1992). Predicting corporate performance form organisational culture. Journal of Management Studies, 29(6), 783–798. https://doi.org/10.1111/j.1467-6486.1992.tb00689.x
- Gu, X., Hasan, I., & Zhu, Y. (2019). Political influence and financial flexibility: Evidence from China. Journal of Banking & Finance, 99, 142–156. https://doi.org/10.1016/j.jbankfin.2018.12.002
- Hair, J. F., Black, B., Babin, B., & Anderson, R. E. (2010). Multivariate data analysis (7th ed.). Pearson Prentice Hall.
- Hair, J. F., Jr, Hult, G. T. M., Ringle, C., & Sarstedt, M. (2016). A primer on partial least squares structural equation modeling (PLS-SEM). Sage Publications.
- Hair, J. F., Risher, J. J., Sarstedt, M., & Ringle, C. M. (2019). When to use and how to report the results of PLS-SEM. European Business Review, 31(1), 2–24. https://doi.org/10.1108/EBR-11-2018-0203
- Harman, H. H. (1967). Modem factor analysis. University of Chicago.
- Harrison, S. H., & Corley, K. G. (2011). Clean climbing, carabiners, and cultural cultivation: Developing an open-systems perspective of culture. Organization Science, 22(2), 391–412. https://doi.org/10.1287/orsc.1100.0538
- Hart, S. L., & Dowell, G. (2011). Invited editorial: A natural-resource-based view of the firm: Fifteen years after. Journal of Management, 37(5), 1464–1479. https://doi.org/10.1177/0149206310390219
- Heinicke, X., & Guenther, T. (2020). The role of management controls in the higher education sector: An investigation of different perceptions. European Accounting Review, 29(3), 581–630. https://doi.org/10.1080/09638180.2019.1619603
- Henseler, J., Ringle, C. M., & Sarstedt, M. (2015). A new criterion for assessing discriminant validity in variance-based structural equation modeling. Journal of the Academy of Marketing Science, 43(1), 115–135. https://doi.org/10.1007/s11747-014-0403-8
- Hogan, S. J., & Coote, L. V. (2014). Organisational culture, innovation, and performance: A test of Schein’s model. Journal of Business Research, 67(8), 1609–1621. https://doi.org/10.1016/j.jbusres.2013.09.007
- Hulland, J., Baumgartner, H., & Smith, K. M. (2018). Marketing survey research best practices: Evidence and recommendations from a review of JAMS articles. Journal of the Academy of Marketing Science, 46(1), 92–108. https://doi.org/10.1007/s11747-017-0532-y
- Iranmanesh, M., Zailani, S., Hyun, S., Ali, M., & Kim, K. (2019). Impact of lean manufacturing practices on firms’ sustainable performance: Lean culture as a moderator. Sustainability, 11(4), 1112. https://doi.org/10.3390/su11041112
- ITU. (2018). Achieving universal and affordable internet in the least developed countries.
- Jiang, Z., Wang, Z., & Li, Z. (2018). The effect of mandatory environmental regulation on innovation performance: Evidence from China. Journal of Cleaner Production, 203, 482–491. https://doi.org/10.1016/j.jclepro.2018.08.078
- Jianxun, C., Arkorful, V. E., & Shuliang, Z. (2021). Electronic health records adoption: Do institutional pressures and organisational culture matter? Technology in Society, 65, 101531. https://doi.org/10.1016/j.techsoc.2021.101531
- Kemp, R., & Pearson, P. (2007). Final report MEI project about measuring eco-innovation. UM Merit, Maastricht, 10(2), 1–120.
- Laursen, K. (2002). The importance of sectorial differences in the application of complementary HRM practices for innovation performance. International Journal of the Economics of Business, 9(1), 139–156.
- Lynch-Wood, G., & Williamson, D. (2014). Understanding SME responses to environmental regulation. Journal of Environmental Planning and Management, 57(8), 1220–1239. https://doi.org/10.1080/09640568.2013.793174
- Mauro, S., Cinquini, L., & Grossi, G. (2017). Insights into performance-based budgeting in the public sector: A literature review and a research agenda. Public Management Review, 19(7), 911–931. https://doi.org/10.1080/14719037.2016.1243810
- Mehmood, S. M., & Najmi, A. (2017). Understanding the impact of service convenience on customer satisfaction in home delivery: Evidence from Pakistan. International Journal of Electronic Customer Relationship Management, 11(1), 23–43. https://doi.org/10.1504/IJECRM.2017.086752
- Mortara, L., & Minshall, T. (2011). How do large multinational companies implement open innovation? Technovation, 31(10–11), 586–597. https://doi.org/10.1016/j.technovation.2011.05.002
- Ogbonna, E., & Harris, L. C. (2000). Leadership style, organisational culture and performance: Empirical evidence from UK companies. International Journal of Human Resource Management, 11(4), 766–788.
- Pfeffer, J., & Salancik, G. R. (1978). The External Control of Organizations: A Resource Dependence Perspective. New York, NY: Harper & Row.
- Pittaway, L., Robertson, M., Munir, K., Denyer, D., & Neely, A. (2004). Networking and innovation: A systematic review of the evidence. International Journal of Management Reviews, 5(3–4), 137–168.
- Podsakoff, P. M., MacKenzie, S. B., Lee, J. Y., & Podsakoff, N. P. (2003). Common method biases in behavioral research: A critical review of the literature and recommended remedies. The Journal of Applied Psychology, 88(5), 879–903.
- Podsakoff, P. M., MacKenzie, S. B., & Podsakoff, N. P. (2012). Sources of method bias in social science research and recommendations on how to control it. Annual Review of Psychology, 63, 539–569.
- Porter, M., e. (1991). America’s green strategy. Scientific American, 264(4), 168–168. https://doi.org/10.1038/scientificamerican0491-168
- Pratolo, S., Sofyani, H., & Anwar, M. (2020). Performance-based budgeting implementation in higher education institutions: Determinants and impact on quality. Cogent Business & Management, 7(1), 1786315. https://doi.org/10.1080/23311975.2020.1786315
- Reverte, C., Gomez-Melero, E., & Cegarra-Navarro, J. G. (2016). The influence of corporate social responsibility practices on organisational performance: Evidence from Eco-Responsible Spanish firms. Journal of Cleaner Production, 112, 2870–2884. https://doi.org/10.1016/j.jclepro.2015.09.128
- Ringle, C. M., Wende, S., & Becker, J. M. (2015). SmartPLS 3. Bönningstedt, Germany: SmartPLS GmbH.
- Rogers, E. M. (2003). Elements of diffusion. In Diffusion of innovations (5th ed.). Macmillan Publishing Co., Inc.
- Scaliza, J. A. A., Jugend, D., Jabbour, C. J. C., Latan, H., Armellini, F., Twigg, D., & Andrade, D. F. (2022). Relationships among organisational culture, open innovation, innovative ecosystems, and performance of firms: Evidence from an emerging economy context. Journal of Business Research, 140, 264–279. https://doi.org/10.1016/j.jbusres.2021.10.065
- Simpson, M., Taylor, N., & Barker, K. (2004). Environmental responsibility in SMEs: Does it deliver competitive advantage? Business Strategy and the Environment, 13(3), 156–171. https://doi.org/10.1002/bse.398
- Sinha, A., Shah, M. I., Sengupta, T., & Jiao, Z. (2020). Analysing technology-emissions association in Top-10 polluted MENA countries: How to ascertain sustainable development by quantile modeling approach. Journal of Environmental Management, 267, 110602. https://doi.org/10.1016/j.jenvman.2020.110602
- Soundararajan, V., Jamali, D., & Spence, L. J. (2018). Small business social responsibility: A critical multilevel review, synthesis and research agenda. International Journal of Management Reviews, 20(4), 934–956. https://doi.org/10.1111/ijmr.12171
- Tarba, S. Y., Ahammad, M. F., Junni, P., Stokes, P., & Morag, O. (2019). The impact of organisational culture differences, synergy potential, and autonomy granted to the acquired high-tech firms on the M&A performance. Group & Organization Management, 44(3), 483–520. https://doi.org/10.1177/1059601117703267
- Taylor, M. S. (2005). Unbundling the pollution haven hypothesis. Advances in Economic Analysis & Policy, 4(2).
- Triebswetter, U., & Hitchens, D. (2005). The impact of environmental regulation on competitiveness in the German manufacturing industry—A comparison with other countries of the European Union. Journal of Cleaner Production, 13(7), 733–745. https://doi.org/10.1016/j.jclepro.2004.01.009
- Walker, H., Di Sisto, L., & McBain, D. (2008). Drivers and barriers to environmental supply chain management practices: Lessons from the public and private sectors. Journal of Purchasing and Supply Management, 14(1), 69–85. https://doi.org/10.1016/j.pursup.2008.01.007
- Walsh, P. P., Murphy, E., & Horan, D. (2020). The role of science, technology and innovation in the UN 2030 agenda. Technological Forecasting and Social Change, 154, 119957. https://doi.org/10.1016/j.techfore.2020.119957
- Wiener, M., Gattringer, R., & Strehl, F. (2018). Participation in inter-organisational collaborative open foresight A matter of culture. Technology Analysis & Strategic Management, 30(6), 684–700. https://doi.org/10.1080/09537325.2017.1376045
- Williamson, D., Lynch-Wood, G., & Ramsay, J. (2006). Drivers of environmental behaviour in manufacturing SMEs and the implications for CSR. Journal of Business Ethics, 67(3), 317–330. https://doi.org/10.1007/s10551-006-9187-1
- Worthington, I., & Patton, D. (2005). Strategic intent in the management of the green environment within SMEs: An analysis of the UK screen-printing sector. Long Range Planning, 38(2), 197–212. https://doi.org/10.1016/j.lrp.2005.01.001
- Wu, J., & Boateng, A. (2010). Factors influencing changes in Chinese management accounting practices. Journal of Change Management, 10(3), 315–329. https://doi.org/10.1080/14697017.2010.493303
- Wu, B., Fang, H., Jacoby, G., Li, G., & Wu, Z. (2022). Environmental regulations and innovation for sustainability? Moderating effect of political connections. Emerging Markets Review, 50, 100835.
- Xiao, Z. J., Weetman, P., & Sun, M. (2004). Political influence and coexistence of a uniform accounting system and accounting standards: Recent developments in China. Abacus, 40(2), 193–218. https://doi.org/10.1111/j.1467-6281.2004.00151.x
- Yang, L., & Li, Z. (2017). Technology advance and the carbon dioxide emission in China–Empirical research based on the rebound effect. Energy Policy, 101, 150–161. https://doi.org/10.1016/j.enpol.2016.11.020
- Yang, F., & Yang, M. (2015). Analysis on China’s eco-innovations: Regulation context, intertemporal change and regional differences. European Journal of Operational Research, 247(3), 1003–1012. https://doi.org/10.1016/j.ejor.2015.07.029
- You, D., Zhang, Y., & Yuan, B. (2019). Environmental regulation and firm eco-innovation: Evidence of moderating effects of fiscal decentralisation and political competition from listed Chinese industrial companies. Journal of Cleaner Production, 207, 1072–1083. https://doi.org/10.1016/j.jclepro.2018.10.106
- Zeb, A., Akbar, F., Hussain, K., Safi, A., Rabnawaz, M., & Zeb, F. (2021). The competing value framework model of organizational culture, innovation and performance. Business Process Management Journal, 27(2), 658–683.
- Zhou, K. Z., Gao, G. Y., & Zhao, H. (2017). State ownership and firm innovation in China: An integrated view of institutional and efficiency logics. Administrative Science Quarterly, 62(2), 375–404. https://doi.org/10.1177/0001839216674457