
 ?Mathematical formulae have been encoded as MathML and are displayed in this HTML version using MathJax in order to improve their display. Uncheck the box to turn MathJax off. This feature requires Javascript. Click on a formula to zoom.
Abstract
The paper investigates the impact of US economic policy uncertainty (EPU) on major crude oil markets. GARCH-tDDC-Copula model is constructed to study the spillover effect of US EPU on the international crude oil market risk, and then the median-CoVaR portfolio model is constructed to discuss the optimal portfolio strategy of crude oil importers when US EPU is in different states. Results show that the spillover effect of US EPU on international crude oil market risk is nonlinear, asymmetric and time-varying. When US EPU increases from the average level to the 0.95 quantile level, the price reduction risk of crude oil market in Brent, Dubai and Western Texas increases by 37.26%, 42.66%, and 39.28% respectively, and the price increase risk increases by 7.22%, 6.64%, and 7.53% respectively. Compared with the median-VaR portfolio strategy and the equal-weight combination portfolio strategy, the advantage of the median-CoVaR model is that it can achieve ‘targeted’ management for asset risk under specific conditions. When US EPU peak occurs, crude oil importers can formulate a basket price strategies with dynamic weighted based on the median-CoVaR model, which can better reduce the depreciation risk of crude oil assets. The findings have important implications for importers and investors.
1. Introduction
Oil is not only a commodity, but also an indispensable strategic resource for national survival and development, which plays an immeasurable role in ensuring the national economic and social development as well as defence security. Statistical Bulletin of National Economic and Social Development in 2019 issued by the National Bureau of statistics shows that, China’s imports of crude oil and refined oil reached 1.78 trillion, which include 1.66 trillion crude oil imports, accounting for 11.7% of the total imports of goods in that year. In addition, according to the blue book of China’s oil and gas industry development analysis and Outlook report (2019–2020) released by the China Petroleum Enterprise Association, China’s crude oil imports in 2019 were 505.72 million tons, with an average daily import volume of 10 million barrels, which increased by 9.5% over 2018. The foreign dependence of oil has reached 70.8%. In this context, the huge amount of crude oil import may enlarge an unremarkable fluctuation in the international market into a huge economic loss, just like the butterfly effect.
Since the decoupling of the US dollar from gold, the international oil settlement agreements signed among the United States and major oil producing countries has made the US dollar the designated currency for oil trading. The correlation between oil and the US dollar makes exchange rate risk of the US dollar affect the international oil market. After major events such as the Financial Crisis and the global outbreak of COVID-19, the US economic policy tends to change dramatically, which are passed on to the international oil market through petrodollars. Specifically, after the September 11 Attacks in 2001, the US EPU rose from 84 in August to 173 in October, and the crude oil prices of Brent, Dubai and West Texas fell by 19.81%, 18.45% and 13.33% respectively; After the outbreak of the financial crisis, the US EPU rose from 96 in August 2008 to 190 in October, and the market prices of the three major crude oil fell by 26.47%, 28.50%, and 26.66% respectively; After the global outbreak of the COVID-19, the US EPU rose from 156 in February 2020 to 284 in March, and the market prices of the three major crude oils fell by 40.05%, 38.09% and 40.96% respectively. The WTI crude oil 2005 contract even settled at -$37.63/BBL.
EPU serves as an important factor in asset pricing and macroeconomic forecasting. This indicator may be a good predictor of recessions (Balcilar et al., Citation2016). Although the fluctuation of international oil prices cannot be completely attributed to the EPU, existing literature shows that EPU is an important observable factor affecting international oil prices (Albulescu et al., Citation2019), and EPU can improve the prediction accuracy of the model on the volatility of the crude oil market (Ma et al., Citation2018; Christou et al., Citation2018). Increased economic policy certainty will reduce systemic risk in the oil market. EPU is economically significant in determining systemic risk, and less disagreement in economic policies may decrease systemic risk (Yang & Hamori, Citation2021). EPU reveals fluctuating responses to oil price shocks, while the oil price has a negative response to the uncertainty (Lin & Bai, Citation2021). Some studies show that, when the Brent oil market is prosperous, EPU in China and India has a negative impact on the oil returns, whereas EPU in Russia and Brazil has a positive effect (Yuan et al., Citation2022). Policymakers should institute country-level policies to minimize the adverse impact of external uncertainty shocks (Boateng et al., Citation2022). Accurate analysis of the relationship between EPU and international crude oil market risk is of great practical significance to reduce the loss of crude oil import trade and ensure national energy security. The questions derived from this are as follows, what is the relationship between US EPU and international crude oil market risks? How much does the US EPU contribute to international oil market risk? How can Chinese crude oil importers reduce the market losses induced by US EPU?
2. Literature review
2.1. The impact of EPU on oil prices
There are several factors affecting crude oil market, mainly including oil supply and demand (Kilian, Citation2009), monetary policy (Szturo et al., Citation2021), geopolitical conflicts (Monge et al., Citation2017), strikes (Zhang et al., Citation2009), new energy policies (Chen et al., Citation2020), etc. In the long term, the trend of oil prices is determined by the supply and demand of oil, and the supply of oil-producing countries largely determines the stability of the oil market. In the short term, fluctuations in oil prices are affected by economic factors such as business cycles and speculation, which increases the instability of oil markets (Robe & Wallen, Citation2016). With the improvement of the degree of crude oil financialization, the correlation between crude oil price and financial market such as exchange rate, stock market and commodity futures market has been strengthened (Kanjilal & Ghosh, Citation2017; Nusair & Olson, Citation2019; Vrbka et al., Citation2022). Financial assets are associated with macroeconomic variables (Masood et al., Citation2019). In addition, the price of crude oil has experienced several sharp fluctuations over the past few decades due to the impact of a number of contingencies, including war and political instability, economic and financial slowdown, terrorist attacks, and natural disasters (Taghizadeh-Hesary et al., Citation2019; Evgenidis & Papadamou, Citation2021). Containing various information, EPU reflects significant rises and declines when facing shocks like financial crisis, oil-price change, and other specific economic or policy events (Lin & Bai, Citation2021). In a word, the fluctuation of crude oil market risk is affected by many factors, showing more complex dynamic characteristics, in which EPU has received more and more attention in the research in recent years.
Scholars such as Baker first published the economic policy uncertainty index of major countries and its construction method in 2012. In recent years, the literature on the impact of EPU has increased substantially, mainly involving research on investment, trade, exchange rates, stocks, and commodity markets. In terms of empirical research on the relationship between EPU and oil price, the research of Ma et al. (Citation2018) and Christou et al. (Citation2018) showed that EPU index can improve the prediction accuracy of price fluctuation, and taking EPU as a predictor can obtain excess profits in the market. Albulescu et al. (Citation2019) found that there is a nonlinear causal relationship between EPU, oil price and exchange rate, which provides a reference for arbitrage trading and investment portfolio. Yang (Citation2019) studied the relationship between American EPU and West Texas crude oil and Brent crude oil based on the VAR model combined with wavelet decomposition, and found that there was a significant correlation among the three, and the correlation between American EPU and Brent crude oil market was higher. Chen et al. (Citation2019) verified the spillover effect between oil price and EPU by using the BEKK-GARCH model based on wavelet decomposition, and found that the spillover effect between the two is weak in the short term, but with the increase of time scale, the spillover effect increases gradually. Using a VAR model based on wavelet decomposition, Chen et al. (Citation2020) studied the multi-scale relationship between international oil prices and EPU, and the analysis showed that the relationship was time-varying on different time scales. There are time-varying effects of global EPU shocks on the volatility of two international pricing benchmarks for crude oil-Brent and West Texas intermediate crude oil prices (Lyu et al., Citation2021). In addition, Feng and Pan (Citation2016) and Zhu and Wang (Citation2017) all used the DCC-GARCH model to study the dynamic relationship between China’s EPU and the Daqing crude oil market.
2.2. Conditional risk measurement
The 2008 financial crisis shows that both VaR and CVaR indicators underestimated the impact of extreme risks. The main reason is that these indicators cannot well reflect the losses caused by systemic risks. CoVaR model was proposed by Adrian and Brunnermeier in 2008 and officially published in 2016. CoVaR refers to the maximum possible loss of other assets or portfolios when the loss of an asset or portfolio in a certain future period is equal to VaR at a certain confidence level. The model can show that the risk value of an institution (market) is affected by other institutions (markets) or systemic risks. Compared with indicators such as VaR, CoVaR is a more comprehensive and effective risk management indicator. The current methods of calculating CoVaR are mainly divided into quantile measurement method (Adrian & Brunnermeier, Citation2011), multivariate GARCH model (Girardi & Ergün, Citation2013) and Monte Carlo simulation method based on Copula function (Mainik & Schaanning, Citation2014).
Scholars mainly used the above three methods to conduct empirical research. Yang (Citation2016) established DCC-TGARCH-CoVaR and DCC-TGARCH-MES models, and conducted empirical research on the identification of systemically important banks based on the daily return of 16 listed commercial banks in China. It is believed that CoVaR can capture the spillover effect of a single bank’s risk on the overall banking industry, while MES pays more attention to the impact of market risk. Yu et al. (Citation2018) used the ADCC-ΔCoVaR model to study the contribution of crude oil risk to American industry returns. Braiek et al. (Citation2018) used CoVaR, ΔCoVaR, and quantile regression models to study the contribution of stock indexes to systemic risk in the US stock market. Bonaccolto et al. (Citation2019) established QL-CoVaR and QL-CoCaViaR models and found that the quantile positioning relationship can improve the accuracy of conditional risk prediction. Zheng et al. (Citation2019) embedded the constructed liquidity index into the quantile regression to optimize the CoVaR quantile estimation method. Xu et al. (Citation2018) constructed Teng Copula-CaViaR model to estimate the risk spillover effect of the stock market. Ke et al. (Citation2019) used three Copula functions and CoVaR to simulate the risk spillover effect between agricultural futures markets in China and the United States. In order to better depict the risk spillover effect between financial assets, Zhang et al. (Citation2019) constructed the Copula-GH-CoVaR model to measure the risk spillover effect, and then conducted an empirical study by using international commodity prices and China’s crude oil prices as examples, which shows that the model improves the accuracy and effectiveness of measurement of risk spillover effect.
2.3. Progress of portfolio modeling
For the buyer, the upward price change means the appreciation of the asset, and the decline in the asset price results in a loss. For the seller, the relationship between the change of asset price and profit and loss is just the opposite. Markowitz’s mean-variance combination model uses the variance of the return on assets to measure investment risk, whose disadvantage is that the variance cannot distinguish the direction of asset price fluctuation. Jorion (Citation1996) proposed to replace variance index with VaR. Duarte and Reis Alcantara, (Citation1999) proposed the mean-VaR model and derived the efficient frontier of the portfolio. Compared with the mean-variance model, the mean-VaR model can avoid the problem of overlarge parameter estimation error. But Artzner et al. (Citation1999)pointed out that VaR cannot describe losses beyond VaR. Rockafellar and Uryasev (Citation2000) proposed to use CVaR as a risk measurement index, and proved that the efficient frontier of mean-VaR and mean-CVaR portfolio models are the same under the assumption that the return of portfolio assets follows normal distribution. However, since VaR and CVaR indicators can’t well reflect the losses caused by extreme events, asset allocation based on these two indicators can’t effectively reduce the conditional risk of asset portfolio when major events such as financial crisis break out. But the portfolio model based on CoVaR is helpful to avoid market risk in extreme events. Lan (Citation2013) and Zhang et al. (Citation2019) constructed the mean-CoVaR model and made an empirical analysis. Zalewska (Citation2018) provided the proof process of mean-CoVaR efficient frontier under the assumption of normal distribution.
Existing studies mainly discuss the relationship between EPU and crude oil prices, but few literatures analyse the relationship between EPU and crude oil market risk and the contribution of EPU to crude oil market risk. When copula function is used to measure CoVaR, less attention is paid to the influence of skewness of marginal distribution on the measurement results. The correlation coefficient in copula function is often set as a constant, which ignores the time-varying characteristics of market risk. However, the setting is inconsistent with the theory and practice of cross-market arbitrage. In addition, the mean value in the mean-CoVaR portfolio model is susceptible to extreme values. Assuming that the portfolio return follows the normal distribution, it limits the application of the model. In this paper, the ARMA-GARCH model is used to fit the marginal distribution of crude oil return rate under the skewed t distribution of Hansen (Citation1994). Then, the stochastic simulation method based on tDCC-Copula is used to analyse the impact of the US EPU on the risk of crude oil market. Finally, the median-CoVaR model is constructed to discuss the portfolio strategy of crude oil importers when EPU is at its peak.
3. Models and data
3.1. CoVaR model
Conditional risk in this study refers to the maximum possible loss or profit from trading in foreign crude oil market
when the U.S. EPU reaches a certain level
under a certain probability level
The value of
is 1, 2 or 3, representing Brent, Dubai and West Texas crude oil markets respectively. Conditional risk is expressed as quantile regression model as follows:
(1)
(1)
According to the definition of Adrian and Brunnermeier (Citation2011), the marginal risk of energy market caused by the exchange rate risk of US dollar is recorded as equation (2), where represents the median of the US dollar exchange rate risk.
(2)
(2)
3.2. GARCH-tDCC-Copula model
On the basis of analysing the marginal distribution of variables, Copula function is used to measure the correlation and nonlinear structure between sequences. Sklar’s theorem proposes that n-dimensional joint distribution function can be decomposed into n marginal distribution functions and a Copula function (denoted as C), and Copula is used to describe the correlation between variables.
(3)
(3)
(4)
(4)
Using the Copula method to calculate CoVaR is essentially to calculate the upper limit integral of the density function. If the Copula function and the joint distribution function F have N-order partial derivatives, then the joint distribution density function is as follows:
(5)
(5)
The parameters of edge density function and Copula density function are estimated by two-step method. The ARMA-GARCH family model is used to fit the marginal function, and the residual term of the model is assumed to obey the Hansen’s generalized t distribution [equation (7)] (Hansen, Citation1994):
(6)
(6)
Where
The dynamic tDCC-Copula function is used to fit the correlation between the residual sequences. The likelihood function to be optimized is as follows:
(7)
(7)
The dynamic correlation coefficient matrix Rt is estimated according to the following Engle’s DCC(1,1) model (Engle, Citation2002):
(8)
(8)
Where represents the covariance matrix of the residual vector zt, and
represents an n-order square matrix whose main diagonal element is equal to the square root of Qt main diagonal element, where other elements are equal to zero.
Specifically, in this study, the residual items of Brent, Dubai and West Texas crude oil markets are recorded as z1t, z2t and z3t, and the uncertainty residual items of the US EPU are recorded as z4t. The p-quantiles of z1t, z2t and z3t can be expressed as the following conditional distributions:
(9)
(9)
When is known to be equal to p1, the corresponding conditional quantiles of z1t, z2t and z3t can be obtained by solving the above equations. The solution of multiple integral can be realized by Monte Carlo simulation. After calculating the conditional quantile, the conditional risk of market j can be calculated according to the definition of value at risk:
(10)
(10)
and
respectively represent the forecast values of conditional mean value and conditional variance of market return, and the dynamic conditional risk can be obtained from equation (10). When
is equal to 0.5, the corresponding conditional quantile can be obtained by solving equation (9). Similarly, equation (10) can be used to calculate the corresponding conditional risk. The difference between the two conditional risks can obtain the net impact (the risk premium of US EPU in crude oil markets) of the US EPU on the crude oil market risk
(11)
(11)
3.3. Portfolio strategy model
In order to better diversify the market risk of imported crude oil, it is necessary to select an appropriate reference price when negotiating the import contract. The price of imported crude oil is mainly affected by the international benchmark price of crude oil. Benchmark prices include Dubai price, Brent price, West Texas price and basket price composed of main crude oil market prices. The US EPU has a certain impact on crude oil prices, which increases the market risk of domestic enterprises in importing crude oil. If we don’t consider the exchange rate condition and make the pricing decision according to the traditional portfolio model, additional losses are likely to occur. According to the theory of incomplete asset markets, if the impact of the US EPU on the three crude oil markets is different, the law of one price in the international crude oil market will be broken, and there will be short-term arbitrage opportunities between different markets, and importers can offset part of the market risk. Therefore, the median-CoVaR portfolio model is constructed to reduce the market loss induced by the US EPU by minimizing the conditional risk. It is assumed that when the US EPU is at its peak, the decision of domestic enterprises to import crude oil is expressed as, under the constraint of expected returns, choosing the optimal basket price as the contract benchmark price to minimize the market risk faced by the enterprise. Since the EPU is the main but not the only factor affecting the international crude oil market, this study constructs a portfolio strategy model based on the mean-CoVaR portfolio model proposed by Lan (Citation2013), Zalewska (Citation2018) and Zhang et al. (Citation2019), which considers both the crude oil market risk and the impact of the US EPU. The model is as follows:
(12)
(12)
In order to improve the computational efficiency of the model, the objective function CoVaR is given in the form of CoCaViaR with exogenous variables:
(13)
(13)
The decision variable is the weight of the three major crude oil market prices in the contract benchmark price. In the first constraint of equation (12), the expected return of the enterprise is set as the average return. Considering that the mean value is easily affected by extreme values, we replace the average with the median yield. In the second constraint, Qp is the p-quantile operator. The solution process of portfolio strategy model is as follows: firstly, solve the parameter values in quantile regression in the second constraint condition, then calculate the quantile of asset portfolio and the logarithmic return rate of US dollar index put them into the objective function. Finally, optimize the objective function to get the value of decision variables.
The following Cornish-Fisher expansion is used to calculate the quantile q corresponding to the probability p:
(14)
(14)
Where c(p) is the p-quantile of the standard normal distribution, s represents the skewness of the portfolio return, and k represents the kurtosis of the portfolio return. Using equation (14) to calculate quantile can reduce the influence of distribution setting error on the optimal solution of portfolio strategy model.
3.4. Data description
The US Economic Policy Uncertainty Index (EPU) is published by Baker and other scholarsFootnote1. Brent, Dubai and West Texas crude oil prices are sourced from the IMF's commodity price databaseFootnote2. The data sampling frequency is monthly, and the time period is from January 1985 to March 2020, with a total of 423 sets of data. reports the descriptive statistical results for each variable.
Table 1. Descriptive statistics of the data.
The skewness of the return sequences is negative, which indicates that the probability of negative return in crude oil market is greater. That is, the risk of crude oil asset depreciation is greater than the risk of asset appreciation after purchasing crude oil. The kurtosis of the crude oil return sequences is greater than 3, which indicates that there are more extreme values compared with normal distribution. From the perspective of skewness and kurtosis, the occurrence of minimum value is more than that of maximum value. The skew distribution is more suitable for describing the data generation process than the symmetric distribution, and median is a better statistic than arithmetic mean. The correlation coefficients between the returns of the three crude oil markets and EPU in the sample period were −0.193, −0.214 and −0.203, respectively. In other words, when the uncertainty of the US economy increased, the returns of the crude oil market decreased, while when the uncertainty of the US economy decreased, the returns of the crude oil market increased. When calculating the conditional quantile, it is found that when the EPU is greater than or equal to its 0.95 quantile, the returns of the three crude oil markets will be lower than the 0.05 quantile, but no returns above the 0.95 quantile. When the EPU was less than or equal to its 0.05 quantile, there were no returns below the 0.05 quantile in the three markets, but the return rate is higher than 0.95 quartile for three times ().
4. Results
4.1. Parameter estimation results
reports the parameter estimation results of the variable marginal distribution model (6). Except for a few intercept terms in the conditional expectation and conditional variance functions, AR, MA, ARCH, GARCH and threshold terms are all significant at the 95% confidence level. In the residual distribution function, the return sequences obey the skewed t distribution, while the EPU sequence obeys the t distribution.
Table 2. Fitting results of marginal distribution.
The residual of the above equations are transformed into the probability value into the interval [0, 1] through kernel density estimation, and substitute them into equations (7) and (8) to estimate the three parameters of the tDCC-Copula function. Where the degree of freedom is 7.109, α is equal to 0.019, and β is equal to 0.973, and the corresponding t statistic values are 5.222, 4.490, and 220.487, respectively. All the three parameters are significant.
reports the change of correlation coefficients among variables during the empirical period. The correlations between the three major crude oil markets and between the three major crude oil markets and the EPU are highly nonlinear and time-varying. The correlation coefficient between the Brent and Dubai markets is greater than 0.95 most of the time. Correlation coefficients between the Brent and West Texas markets are mainly in the range of 0.9 ∼ 0.95, while correlation coefficient between Dubai and West Texas is mainly in the range of 0.875–0.925.
Figure 1. Dynamic correlations among variables.
Source: Created by authors based on calculations.
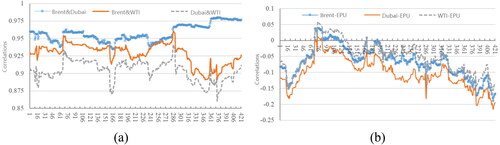
The correlation coefficient between the three major oil markets and EPU is mainly in the range of −0.2 and 0. The negative correlation between the crude oil market and EPU gradually strengthened from 1985 to 1986, among which the correlations between Dubai crude oil market and EPU reached −0.18, and that between the other two crude oil markets and EPU reached −0.15. From 1987 to 1990, the negative correlation between oil market and EPU gradually weakened, and oil market and EPU maintained a short and weak positive correlation during 1991. The correlations between the three crude oil markets and the EPU gradually returned to negative and showed an increasing trend since 1992. The correlation coefficient between Dubai crude oil market and EPU reached −0.18 in December 2008, and the correlation coefficient between Brent crude oil market and EPU reached −0.15, while the coefficient between West Texas crude oil market and EPU reached −0.12. The negative correlation between crude oil market and EPU once weakened during 2009–2011. However, the negative correlation between the two has strengthened again after 2011, and the correlation coefficient is in the range of −0.15∼ −0.2.
4.2. Relationship between EPU and conditional risk
According to the GARCH-tDCC-Copula model, 1 million simulation calculations were carried out on the international crude oil market return rate and the value of US EPU from January 1985 to March 2020, so as to obtain the change of US EPU in different periods and its impact on international crude oil market risk. reports the change of international crude oil market risk when the US EPU changes from the average level to 0.95 quantile. Through the model test of back-testing, it is found that among the 421 groups of observations, the number of samples with return rate lower than CoVaR0.05|P(EPU)=0.95 in the Brent market is 10, that in Dubai and West Texas is 12 and 9 respectively. For comparison, under the assumption that the marginal distribution obeys the skewed t distribution, the VaR0.05 values of the three crude oil markets are calculated based on the GARCH model. Among the 421 groups of observations, the number of samples with return rate lower than VaR0.05 in Brent market is 25, and that in Dubai and West Texas is 32 and 28 respectively. It can be seen that CoVaR0.05|P(EPU)=0.95 is a more conservative risk management index than VaR0.05. Under the assumption that the marginal distribution obeys t distribution, the CoVaR0.05|P(EPU)=0.95 values of the three crude oil markets are calculated based on the GARCH-tDCC-Copula model. Among the 421 groups of observations, the number of samples with return rate lower than CoVaR0.05|P(EPU)=0.95 in the Brent market is 14, that in Dubai and West Texas is 13 and 11 respectively. Therefore, skew t distribution is better than t distribution in fitting edge distribution.
Figure 2. Changes of US EPU and simulation of international crude oil market risk.
Source: Created by authors based on calculations.
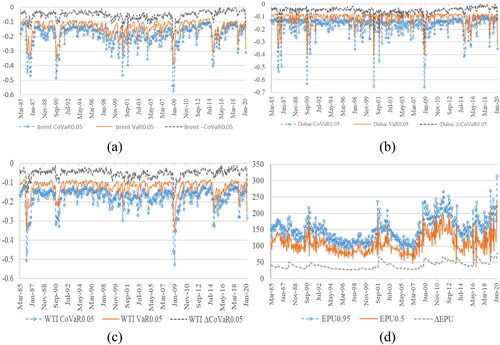
Judging from the value of VaR0.95, COVaR0.05 and ΔCOVaR0.05 of the three markets, the higher the US EPU is, the higher the international crude oil market risk is. The main peaks of the US EPU from January 1985 to March 2020 corresponded to the first Iraq War in 1991, the September 11 attacks in 2001, the second Iraq War in 2003, the outbreak of the financial crisis in 2008, and the global outbreak of COVID-19 in 2020. International crude oil prices dropped sharply in the month or the following month when these events occurred, and corresponding risk extremes appeared in all three markets. In addition, judging from the frequency and value of extreme values in the three markets, the Dubai crude oil market is more sensitive to the extreme value of US EPU than the West Texas market.
The risk statistics ① to ⑦ in report the average level of risk values of the three major crude oil market under different levels of EPU, and ⑧ to ⑮ report the average response of the crude oil market risk after the EPU changing. For crude oil buyers, price drops after buying crude oil means loss, so buyers are mainly concerned about the left tail risk. The risk statistic ① indicates that when the EPU is equal to the median of 107.1096, the left tail risks of the three major crude oil markets are −0.1417, −0.1205 and −0.1278 respectively. The risk statistic ③ indicates that when the EPU is equal to the 0.95 quantile of 148.0757, the left tail risks of the three major crude oil markets are −0.1946, −0.1719 and −0.1780 respectively. The risk statistic ③-① indicates that when the EPU rises from the average level of 107.1096 to 148.0757, the left tail risk change values caused by the change of EPU are −0.0528, −0.0514 and −0.0502, respectively. Similarly, ⑥-① means that when the EPU drops from the average level of 107.1096 to 65.8462, the change value of left tail risk caused by EPU change is −0.0157, −0.0113 and −0.0142, respectively. The comparison shows that the left tail risk caused by the rise of EPU is much higher than the left tail risk caused by the fall of EPU.
Table 3. The effect of changes of US EPU on crude oil market risk.
For crude oil sellers, price rises after selling crude oil means loss, so sellers are mainly concerned about the right tail risk. The risk statistic ② indicates that when the EPU is equal to the median of 107.1096, the right tail risks of the three major crude oil markets are 0.1232, 0.1175 and 0.1168 respectively. The risk statistic ⑤ indicates that when the EPU is equal to the 0.95 quantile of 65.8462, the right tail risks of the three major crude oil markets are 0.1557, 0.1550 and 0.1552 respectively. The risk statistic ⑤-② indicates that when the EPU drops from the average level of 107.1096 to 65.8462, the right tail risk change values caused by the change of EPU are 0.0325, 0.0375 and 0.0334, respectively. Similarly, ④-② means that when the EPU rises from the average level of 107.1096 to 148.0757, the change value of right tail risk caused by EPU change is 0.0089, 0.0078 and 0.0088, respectively. The comparison shows that the right tail risk caused by the fall of EPU is much higher than the right tail risk caused by the rise of EPU.
The value of risk statistic ⑦ is positive, which indicates that when the US EPU is at the average level, the international crude oil market mainly faces the right tail risk, that is, the probability of crude oil price increase is greater than the probability of price decrease. The risk statistics ⑨,⑪,⑬, and ⑮ show that when the US EPU increases from the average level to the 0.95 quantile level, the price reduction risk in the Brent, Dubai and West Texas crude oil markets increases by 37.26%, 42.66%, and 39.28% respectively, and the risk of price increase in the three markets increases by 7.22%, 6.64%, and 7.53% respectively. When the US EPU decreases from the average level to the 0.05 quantile level, the price reduction risk in the Brent, Dubai and West Texas crude oil markets increases by 11.08%, 9.38%, and 11.11% respectively, and the risk of price increase in the three markets increases by 26.38%, 31.91%, and 28.60% respectively.
4.3. Optimal portfolio strategy
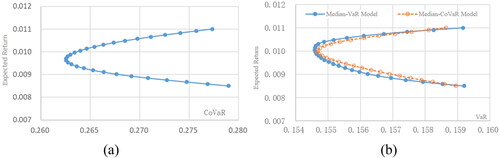
Since domestic importers enter the international crude oil market as buyers, this study focuses on the pricing strategies to avoid the left tail risk. Taking the data from March 1985 to March 2020 as an example, set the significance level as 0.05, and calculate the portfolio boundary of the median-CoVaR model in the sample period according to equations from (12) to (14) (). For comparison, according to the weights calculated by the median-CoVaR model, the median-CoVaR portfolio boundary is converted to the median-VaR coordinate system, and the median-VaR portfolio boundary is calculated at the same time (). It is found that the weights corresponding to the minimum risk values of the two models are not the same. In the median-CoVaR model, the minimum value of CoVaR0.05 is −0.2619, the corresponding expected return rate is 0.0099, and the corresponding VaR0.05 value is −0.1547 at this time; In the median-VaR model, the VaR0.05 minimum value is −0.1546, the corresponding expected return rate is 0.0101, and the corresponding CoVaR0.05 value is −0.2766. In general, when the US EPU is at a high level, enterprises can better avoid policy risks by using the median-CoVaR model to configure their portfolios.
Figure 3. Portfolio boundary of the median-CoVaR and median-VaR model.
Source: Created by authors based on calculations.
reports some typical major events related to the United States and the corresponding peak value of EPU, and VaR0.05 and CoVaR0.05 of the three major crude oil markets, and VaR0.05 and CoVaR0.05 under different portfolio strategies which are calculated according to equations from (12) to (14) over the same period.
Table 4. Comparison of imported crude oil investment portfolio strategies and effects under major events.
From the four major events in , the US EPU all reached a peak state after the event. At this time, there is a big difference between VaR0.05 andCoVaR0.05. Especially in the recent outbreak of the COVID-19, CoVaR0.05 is close to twice the VaR0.05. Using the VaR indicator to measure the risks of the international crude oil market seriously underestimates the risk of oil price falling. At this time, the purchase and pricing decisions based on VAR index will lead to huge losses.
Affected by the COVID-19, the US EPU reached a historical peak of 283.608 in March 2020. Portfolio decisions are made according to the median -CoVaR model. When CoVaR is the minimum, the price weights of Brent, Dubai and West Texas are 0.5679, 0.0457 and 0.3864 respectively. That is to say, the optimal benchmark price of crude oil import contracts for enterprises is determined by Brent, Dubai and West Texas, with the weights are 56.79%, 4.57%, and 38.64% respectively.
When the peak of US EPU appear, the comparison of VaR and CoVaR shows that ignoring the impact of US EPU will seriously underestimate the international crude oil market risk. The VaR and CoVaR of a single crude oil market are not the smallest, so importers should not determine the price of imported crude oil refer to the single market. It is also not effective to adopt the minimizing VaR or equal weight portfolio strategy. The portfolio strategy of minimizing CoVaR can minimize the total risk. In addition, with the change of US EPU and CoVaR, the price weight of each market in the optimal portfolio strategy will change.
5. Discussion and conclusion
This paper constructs a GARCH-tDCC-Copula model to analyse the correlation between the US EPU and international crude oil market risk, and calculates the contribution of the US EPU to the international crude oil market risk, and establishes a median-CoVaR model on this basis to discuss the portfolio strategy of crude oil importers when the peak of US EPU appears. The main conclusions and enlightenment are as follows:
Firstly, the spillover effect of US EPU on international crude oil market risk is asymmetric. When the US EPU is at the average level, the average CoVaR is bigger than 0. That is to say, the risk of crude oil price increase is greater than the risk of price decrease. When the US EPU rises, the risk of crude oil piece decrease is far greater than the risk of price increase, which is not conducive to longs (buyers). So importers should avoid depreciation after purchasing crude oil. When the US EPU falls, the risk of crude oil price increase is far greater than the risk of piece decrease, which is not conducive to short (sellers). Thus exporters should avoid the loss of crude oil being sold at a low price. In addition, asymmetry is also manifested in that the risk of international crude oil price reduction caused by the US EPU rising from the median to the 0.95 quantile is higher than the risk of crude oil price rising caused by the US EPU falling from the median to the 0.05 quantile.
Crude oil importers should guard against the risk of price reduction after importing crude oil. On the one hand, it is recommended to include the US EPU as an observable oil price driving factor into the China Energy Forecast and Early Warning System, and promptly issue different warnings to relevant companies based on the US EPU. On the other hand, inventory is a risk regulator for the crude oil market. A diversified crude oil reserve system should be established. We should encourage local state-owned enterprises, private enterprises and joint ventures in the domestic oil industry chain to expand their reserve capacity through tax relief and other measures, and encourage relevant enterprises to participate in domestic crude oil reserves through credit incentives. We can cope with the ever-changing market risk by improving the company’s crude oil reserve capacity and effectively guarantee national energy security by improving the ability of the enterprise to resist the energy market risk.
Secondly, the correlation coefficients between crude oil markets and between the US EPU and crude oil markets are dynamic. Price fluctuation caused by the US EPU is different in different crude oil markets, and the risk contribution to different markets is also different. This shows that importers can take advantage of cross-market arbitrage in the international crude oil market or reduce market risk through portfolio when the EPU changes significantly. The advantage of median-CoVaR model is that it can realize targeted management of asset risks under specific conditions. When the US EPU is at its peak, a portfolio strategy based on the median CoVaR model can better avoid the crude oil market risk caused by the uncertainty of US economic policy.
It is suggested that importers should monitor the correlation coefficient between crude oil markets and between US EPU and crude oil market, so as to enhance the cross market arbitrage ability of enterprises, and obtain excess profits by using the short-term market disequilibrium caused by external factors. In addition, it is suggested that domestic crude oil importers should consider using dynamic weight basket price based on median-CoVaR model to replace fixed weight basket price when signing purchase contracts, and use contracts for differences (CFDs) to hedge policy risks when the US EPU is at a high level.
This paper provides a new perspective for policy makers to guard against systemic risks in the crude oil market, and also provides a scientific method for crude oil importers to formulate portfolio strategies. The highlights of this paper may be as follows: (1) we study the impact of US EPU on three international pricing benchmarks for crude oil. (2) We use the ARMA-TARCH model to fit the marginal distribution of crude oil returns under Hansen’s skewed t distribution, then use tDCC-Copula method to analyse the dynamic correlation between US EPU and crude oil market risk. (3) The median-CoVaR model is constructed to discuss the pricing strategies of crude oil importers when the EPU is in different states. These conclusions bring significant theoretical and practical significance for policy makers and crude oil importers to prevent crude oil market risk. However, research limitations may be as follows: (1) The relationship between the EPU and oil market risk is not analysed at different time scales. (2) The mechanism of the EPU affecting crude oil market risk is not analysed. Many investors include corporate social responsibility as one eligibility criterion (García et al., Citation2022), but this constraint is not considered in this paper. There is still a long way to go for work in this field, and continuous in-depth research is required. As future line of work, academicians and researchers are encouraged to explore the factors affecting the integration and contagion among the EPU and energy markets.
Correction Statement
This article has been republished with minor changes. These changes do not impact the academic content of the article.
Disclosure statement
No potential conflict of interest was reported by the authors.
Additional information
Funding
Notes
References
- Adrian, T., & Brunnermeier, M. K. (2011). CoVaR (No. w17454). National Bureau of Economic Research.
- Albulescu, C. T., Demirer, R., Raheem, I. D., & Tiwari, A. K. (2019). Does the US economic policy uncertainty connect financial markets? Evidence from oil and commodity currencies. Energy Economics, 83, 375–388. https://doi.org/10.1016/j.eneco.2019.07.024
- Artzner, P., Delbaen, F., Eber, J. M., & Heath, D. (1999). Coherent measures of risk. Mathematical Finance, 9(3), 203–228. https://doi.org/10.1111/1467-9965.00068
- Balcilar, M., Gupta, R., & Segnon, M. (2016). The role of economic policy uncertainty in predicting US recessions: A mixed-frequency Markov-switching vector autoregressive approach. Economics, 10(1), 20160027. https://doi.org/10.5018/economics-ejournal.ja.2016-27
- Boateng, E., Asafo-Adjei, E., Addison, A., Quaicoe, S., Yusuf, M. A., Abeka, M. J., & Adam, A. M. (2022). Interconnectedness among commodities, the real sector of Ghana and external shocks. Resources Policy, 75, 102511. https://doi.org/10.1016/j.resourpol.2021.102511
- Bonaccolto, G., Caporin, M., & Paterlini, S. (2019). Decomposing and backtesting a flexible specification for CoVaR. Journal of Banking & Finance, 108, 105659. https://doi.org/10.1016/j.jbankfin.2019.105659
- Braiek, S., Bedoui, R., & BelKacem, L. (2018). Systemic risk contribution in Islamic equity markets: CoVaR based model. Available at SSRN 3100908.
- Chen, X., Sun, X., & Li, J. (2020). How does economic policy uncertainty react to oil price shocks? A multi-scale perspective. Applied Economics Letters, 27(3), 188–193. https://doi.org/10.1080/13504851.2019.1610704
- Chen, X., Sun, X., & Wang, J. (2019). Dynamic spillover effect between oil prices and economic policy uncertainty in BRIC countries: A wavelet-based approach. Emerging Markets Finance and Trade, 55(12), 2703–2717. https://doi.org/10.1080/1540496X.2018.1564904
- Chen, Y., Zheng, B., & Qu, F. (2020). Modeling the nexus of crude oil, new energy and rare earth in China: An asymmetric VAR-BEKK (DCC)-GARCH approach. Resources Policy, 65, 101545. https://doi.org/10.1016/j.resourpol.2019.101545
- Christou, C., Gupta, R., Hassapis, C., & Suleman, T. (2018). The role of economic uncertainty in forecasting exchange rate returns and realized volatility: Evidence from quantile predictive regressions. Journal of Forecasting, 37(7), 705–719. https://doi.org/10.1002/for.2539
- Duarte, A. M., & Reis Alcantara, S. D. (1999). Mean-value-at-risk optimal portfolios with derivatives. Derivatives Quarterly, 6(2), 56–64.
- Engle, R. (2002). Dynamic conditional correlation: A simple class of multivariate generalized autoregressive conditional heteroskedasticity models. Journal of Business & Economic Statistics, 20(3), 339–350. https://doi.org/10.1198/073500102288618487
- Evgenidis, A., & Papadamou, S. (2021). The impact of unconventional monetary policy in the euro area. Structural and scenario analysis from a Bayesian VAR. International Journal of Finance & Economics, 26(4), 5684–5703. https://doi.org/10.1002/ijfe.2088
- Feng, M., & Pan, Q. (2016). Research on the dynamic correlation between economic policy uncertainty and crude oil prices. Social Sciences in Guangxi, 31(03), 72–76.
- García, F., Gankova-Ivanova, T., González-Bueno, J., Oliver, J., & Tamošiūnienė, R. (2022). What is the cost of maximizing ESG performance in the portfolio selection strategy? The case of The Dow Jones Index average stocks. Entrepreneurship and Sustainability Issues, 9(4), 178–192. https://doi.org/10.9770/jesi.2022.9.4(9)
- Girardi, G., & Ergün, A. T. (2013). Systemic risk measurement: Multivariate GARCH estimation of CoVaR. Journal of Banking & Finance, 37(8), 3169–3180. https://doi.org/10.1016/j.jbankfin.2013.02.027
- Hansen, B. E. (1994). Autoregressive conditional density estimation. International Economic Review, 35(3), 705–730. https://doi.org/10.2307/2527081
- Jorion, P. (1996). Risk2: Measuring the risk in value at risk. Financial Analysts Journal, 52(6), 47–56. https://doi.org/10.2469/faj.v52.n6.2039
- Kanjilal, K., & Ghosh, S. (2017). Dynamics of crude oil and gold price post 2008 global financial crisis–New evidence from threshold vector error-correction model. Resources Policy, 52, 358–365. https://doi.org/10.1016/j.resourpol.2017.04.001
- Ke, Y., Li, C., McKenzie, A. M., & Liu, P. (2019). Risk transmission between Chinese and US agricultural commodity futures markets—A CoVaR approach. Sustainability, 11(1), 239. https://doi.org/10.3390/su11010239
- Kilian, L. (2009). Not all oil price shocks are alike: Disentangling demand and supply shocks in the crude oil market. American Economic Review, 99(3), 1053–1069. https://doi.org/10.1257/aer.99.3.1053
- Lan, W. R. (2013). Application of CoVaR in asset allocation. Institute of Finance, National Chengchi University.
- Lin, B., & Bai, R. (2021). Oil prices and economic policy uncertainty: Evidence from global, oil importers, and exporters’ perspective. Research in International Business and Finance, 56, 101357. https://doi.org/10.1016/j.ribaf.2020.101357
- Lyu, Y., Tuo, S., Wei, Y., & Yang, M. (2021). Time-varying effects of global economic policy uncertainty shocks on crude oil price volatility: New evidence. Resources Policy, 70, 101943. https://doi.org/10.1016/j.resourpol.2020.101943
- Ma, F., Wahab, M. I. M., Liu, J., & Liu, L. (2018). Is economic policy uncertainty important to forecast the realized volatility of crude oil futures? Applied Economics, 50(18), 2087–2101. https://doi.org/10.1080/00036846.2017.1388909
- Mainik, G., & Schaanning, E. (2014). On dependence consistency of CoVaRand some other systemic risk measures. Statistics & Risk Modeling, 31(1), 49–77. https://doi.org/10.1515/strm-2013-1164
- Masood, O., Tvaronavičienė, M., & Javaria, K. (2019). Impact of oil prices on stock return: Evidence from G7 countries. Insights into Regional Development, 1(2), 129–137. https://doi.org/10.9770/ird.2019.1.2(4)
- Monge, M., Gil-Alana, L. A., & de Gracia, F. P. (2017). Crude oil price behaviour before and after military conflicts and geopolitical events. Energy, 120, 79–91. https://doi.org/10.1016/j.energy.2016.12.102
- Nusair, S. A., & Olson, D. (2019). The effects of oil price shocks on Asian exchange rates: Evidence from quantile regression analysis. Energy Economics, 78, 44–63. https://doi.org/10.1016/j.eneco.2018.11.009
- Robe, M. A., & Wallen, J. (2016). Fundamentals, derivatives market information and oil price volatility. Journal of Futures Markets, 36(4), 317–344. https://doi.org/10.1002/fut.21732
- Rockafellar, R. T., & Uryasev, S. (2000). Optimization of conditional value-at-risk. The Journal of Risk, 2(3), 21–41. https://doi.org/10.21314/JOR.2000.038
- Szturo, M., Włodarczyk, B., Miciuła, I., & Szturo, K. (2021). The essence of relationships between the crude oil market and foreign currencies market based on a study of key currencies. Energies, 14(23), 7978. https://doi.org/10.3390/en14237978
- Taghizadeh-Hesary, F., Yoshino, N., Rasoulinezhad, E., & Chang, Y. (2019). Trade linkages and transmission of oil price fluctuations. Energy Policy, 133, 110872. https://doi.org/10.1016/j.enpol.2019.07.008
- Vrbka, J., Horák, J., & Krulický, T. (2022). The influence of world oil prices on the Chinese Yuan exchange rate. Entrepreneurship and Sustainability Issues, 9(4), 439–462. https://doi.org/10.9770/jesi2022.9.4(24)
- Xu, Q. F., Wang, X. Y., Jiang, C. X., & Xiong, X. (2018). Investigating risk spillover effects among stock markets: A vine copula-CAViaR approach. Systems Engineering - Theory & Practice, 38, 2738–2749.
- Yang, L. (2019). Connectedness of economic policy uncertainty and oil price shocks in a time domain perspective. Energy Economics, 80, 219–233. https://doi.org/10.1016/j.eneco.2019.01.006
- Yang, P. (2016). The research on dynamic identification of systemically important banks-take China’s listed banks as examples. Southwestern University of Finance and Economics.
- Yang, L., & Hamori, S. (2021). Systemic risk and economic policy uncertainty: International evidence from the crude oil market. Economic Analysis and Policy, 69, 142–158. https://doi.org/10.1016/j.eap.2020.12.001
- Yu, H., Du, D., Fang, L., & Yan, P. (2018). Risk contribution of crude oil to industry stock returns. International Review of Economics & Finance, 58, 179–199. https://doi.org/10.1016/j.iref.2018.03.009
- Yuan, D., Li, S., Li, R., & Zhang, F. (2022). Economic policy uncertainty, oil and stock markets in BRIC: Evidence from quantiles analysis. Energy Economics, 110, 105972. https://doi.org/10.1016/j.eneco.2022.105972
- Zalewska, A. (2018). On peculiarities of CoVaR-based portfolio selection. Applicationes Mathematicae, 45(2), 181–197. https://doi.org/10.4064/am2353-5-2018
- Zhang, B. S., Duan, J., & Tian, Y. (2019). A study on the risk spillover effect based on Copula-GH-CoVaR model. Chongqing Normal University, 36, 81–92.
- Zhang, B. S., Jiang, T., Zhou., & X. H., Duan. (2019). New approaches to portfolio optimization: Mean-CoVaR model. Statistics & Decisions, 35, 67–70.
- Zhang, X., Yu, L., Wang, S., & Lai, K. K. (2009). Estimating the impact of extreme events on crude oil price: An EMD-based event analysis method. Energy Economics, 31(5), 768–778. https://doi.org/10.1016/j.eneco.2009.04.003
- Zheng, D., Yan, Y. R., & Lei, L. (2019). The spillover effect of liquidity risk in China’s commercial banks: A dynamic CoVaR approach. Financial Economics, 43(01), 39–51.
- Zhu, D., & Wang, Q. (2017). Research on the correlation between economic policy uncertainty and crude oil price based on SVAR-DCC-GARCH model. Journal of Northeast Agricultural University (Social Science Edition), 15(02), 9–15.