
 ?Mathematical formulae have been encoded as MathML and are displayed in this HTML version using MathJax in order to improve their display. Uncheck the box to turn MathJax off. This feature requires Javascript. Click on a formula to zoom.
Abstract
What has been neglected in much of the existing studies of the influence of seasonal and regional characteristics of agriculture on the market power and national security. This paper constructs a multivariate equations model to investigate the monopoly power of seasonal suppliers and national security in China’s soybean market. The results show no relationship between market share and monopoly power; and that CR3 and HHI show China’s soybean import market has been the highest oligopoly type, but the model suggest that exporters (the U.S., Brazil and Argentina) have very weak monopoly power and China has no monopsony power; and that the performance of some exporters’ soybeans is affected by others, while others are relatively independent in market. This is due to the non-substitutability of the product, the non-substitutability of the buyer and the seller, etc., which causes the mutual dependence of the seller and buyer, and their market power cancel each other out. The seasonality and regionality of soybean production is the root. Considering national security, it is necessary to take the seasonal and regional characteristics of exporters into account to disperse trade risks and oppose monopolisation of international food production and trade.
1. Introduction
For bulk agriculture, latitude and longitude, location of land, and proximity to sea determine its feasibility. Food production is confined within certain latitudes, which causes pronounced seasonality in supply. Market power and national security are crucial aspects trade in bulk agricultural products (especially grain). And the consequences of international monopolies in fundamental fields, such as agriculture and energy, will not limited to the loss of economic efficiency and social welfare.
According to Kissinger, former American Secretary of State, ‘Control oil and you control nations; control food and you control the people’, multinational agribusiness monopoly poses serious threats to national and regional security. What’s worse, some countries, for example, the U.S. strategy has negatively impacted family farming in the U.S. and abroad and led to 95% of global grain reserves controlled by six multinational agribusiness corporations (Foda, Citation2016). Many countries are nervous about national security and are responding positively by implementing anti-monopoly, trade restrictions and agricultural subsidies polices (Nakano, Citation2011). For example, the Japanese government heavily subsidises rice cultivation and restricts rice imports to maintain the independent domestic market (Shougennji, Citation2006; Yamazawa, Citation2015). Therefore, it is necessary to investigate monopoly in international trade and especially agricultural productions, which is important economically, politically, and socially.
Rice, wheat, corn, and soybean are the world’s top four food crops. Soybean imports have far-reaching significance for China (Yan et al., Citation2022). According to FAO and UN ComTrade Data, soybean production of the U.S., Brazil and Argentina in 2018-2019 accounted for 81.6% of global production (358.8 million tons), with exports accounting for 97.2% of global volume. Most other countries are soybean importers, such as China, EU, Japan and so on. China’s soybean output in 2018-2019 was 15.97 million tons, ranking fourth and accounting for 4.5% of global output. China is the largest importer of soybeans, with a total import volume of 88.03 million tons in 2019, accounting for 61.92% of the global soybean trade. That is, more than two-thirds of the world’s soybean trade is exported to China. With a fifth of the world’s population (1.42 billion), more than 80% China’s soybean supply is met by imports, concentrated from the U.S., Brazil and Argentina. Therefore, a study on Chinese soybean market can server as a typical case of market power of seasonal suppliers and national security in international trade.
2. Literature review
Market power is an important topic of industrial organisation (including structuralism and new industrial organization theory). The structuralist research on monopoly power can be traced to Lerner and Bain, who posited a positive relationship between the market concentration and monopoly power, and that can be measured by the degree and level of price maintained at marginal cost (Bain, Citation1956; Lerner, Citation1934). And by constructing the research framework on industrial competition, Porter enriched the measurement method (Porter, Citation1979). Now, Market Concentration Rate (CR) and Herfindahl-Hirschman index (HHI) are two of the most widely used criteria for judging market structure, as their simplicity ad wide applicability (Cabral, Citation2017; Unwin, Citation2019). Ying Wang et al. (Citation2019) classified China’s soybean import market as 'extremely oligopolistic’ by using CR4 and HHI from 2001 to 2017. However, such conclusions are only reflecting the source of market power through the common structural characteristics. And the scores are not precise enough or helpful for in-depth analysis of market structure and the formulation of national policies without additional research many times. For example, more than 80% of the soybeans in the world are produced in Brazil, the U.S. and Argentina, which leads to the concentration of soybean import sources and the high scores of HHI and CR of nearly all importers (Voora et al., Citation2020). And this approach of structuralism is often criticised as lacks the corresponding micro-foundation (Su & Su, Citation2021).
According to new industrial organization theory, market power should be estimated not by direct observation but by econometric analysis and indirect conjecture (Devine et al., Citation2018; Su & Su, Citation2021). Empirical organization economists have long been concerned with measuring the degree of competition in markets using modelling approach based on single-demand equation, or systems of demand or inverse-demand equations (Ukav, Citation2017). Toru Nakashima construct a residual demand elasticity parameter model to estimate the market power of American soybeans using time series data, and found that it had no market power in China from 1996 to 2010, but its market power in Japan and Mexico increased after 1990, which the author believes is related to the industrial structure of importers (Nakajima, Citation2012). In empirical research, many market power measurement models have been constructed considering industry and market characteristics to study specific problems, such as the relationship between market concentration and the productivity, the profit and market power (Olmstead-Rumsey, Citation2019; Rubens, Citation2021). Furthermore, special factors can also be considered in the model and studied separately, such as the seasonal variations in prices and ages of consumers (Soysal & Chintagunta, Citation2019; Winfree et al., Citation2004). Arnade and Pick (Citation2000) extended the mark-up approach to estimating the seasonal oligopoly power of Pears and Grapes in the U.S. retail market, and found their annual oligopoly power remain low but seasonal oligopoly power are considerable. Maybe this is the earliest research about seasonal oligopoly power, and since then, some studies have frequently paid attention to the seasonal fluctuations of market power.
Studies based on the industrial organization mainly focus on the suppliers, and the consumers are assumed to be price takers. However, in fact, importers are not full price takers; they may have bargaining power and even monosony power when the consumption is large enough. Trading powers use their influence on the international market to regulate relevant market force through policies, improve their own terms of trade, maximise trade benefits and increase their own welfare (Krugman et al., Citation2018). The ‘Large country effect’ is its influence on a commodity’s international market, that is, its monopoly capacity. This effect on imports stems from the buyer’s monosony power and the effect on exports comes from the seller’s monopoly power (Krugman et al., Citation2018). For example, President Trump adopted the ‘American first’ policy by imposing tariffs on about $300 billion of goods imported from China in order to reverse the long-standing Sino-U.S. trade deficit and promote the U.S. economy (Cui et al., Citation2019; Liu & Woo, Citation2018; Trump, Citation2017).
In the literature, the market power of seasonal suppliers and the national security has not been investigated. This is of current significance, especially in the context of food crises that regularly threaten many countries. This paper analysis the soybean trade through econometric modelling to highlight the seasonal character of products to market power of exporting/importing countries. To our knowledge, this is the first study to investigate the market power of seasonal suppliers with dominant share in import market, and that of consumer with dominant share in supplier’s sales.
3. Methods and materials
3.1. Methods
To investigate the market power of imported soybeans in China, our study consisted of two steps: (1) determine the type of soybean import market in China from the structuralist perspective; (2) construct an econometric model of monopoly power according to the new industrial organization theory.
3.1.1. Methods for the type of market structure
Industry concentration is the most basic factor to determine the market structure; it reflects the competition and monopoly in the market. Frequently used measures of concentration are the CR Index, HHI, Lorentz curve, Gini coefficient, inverse Index, and entropy Index. Among these, CR and HHI are often used in monopoly analysis (Su & Su, Citation2021).The market concentration rate is defined as:
(1)
(1)
where
is the market concentration, which indicates the rate at which the import volume of the largest suppliers from rank 1 to n, compared to the total volume of the Chinese market;
is the volume of country
and
is the number of the whole supplies.
The greater the the higher the degree of monopoly. Bain and Ministry of International Trade and Industry Japan both have developed a standard of market concentration and industry concentration, classified as either Oligopolistic or Competitive. shows the market type division with CR3 as the reference, and it is according to Bain and the researches on China’s industrial structure (Bai & Li, Citation1996).
Table 1. Market type division of CR3.
The widely used HHI index, based on Bain’s SCP theory, measures market concentration:
(2)
(2)
where
is the sum of squares of the respective import shares of all supplies;
is the soybean supplier ranked
by the exported volume to China.
The higher the HHI, the higher the market concentration. When the market is a monopoly, HHI = 1. When there are many firms in the market of the same size, HHI = 1/n. When n tends to infinity, HHI tends to 0. The U.S. Department of Justice uses HHI to measure industry concentration and sets criteria for dividing the market structure ().
Table 2. Classification of market structure based on the HHI.
3.1.2. Market power analysis model
Different regions have different harvest times. The Southern Hemisphere and the Northern Hemisphere are opposite, resulting in different participants entering the market alternately and decreasing their irreplaceable. September is the harvest time for most American beans, but Brazilian soybeans are in the growing phase and Argentine soybeans are in the planting phase. Over time, soybean from different countries in the Chinese market follows a cycle process, from gradually occupying the market to gradually withdrawing. Then, the market power (if any) follows a continuous switching process.
We draw lessons from new industrial organization theory to build our mathematical model (Carter & MacLaren, Citation1997; Goldberg & Knetter, Citation1999; Karp & Perloff, Citation1989). To approximate reality, we relax the consumer price taker assumptions. X represents an irreplaceable product whose demand is long-term and stable. Assume that X imported by country A is supplied by country (where:
) located in different latitude of the latitude and whose supply times are different. At this point, all the export behaviour turns into a pure monopoly. Besides domestic production factors, the export behaviour of country
is also influenced by the demand of country A. Moreover, the fluctuations of rate between countries also affect the behaviour. Meanwhile, the other countries’ export behaviour in the same period also impacts country
The pricing strategy should be based on the principle of maximising the dominant country’s (DC) interests, the price of the following countries (FC), the demand of intentional market, and the international market, and exchange rate fluctuations.
Next, we construct the price equations:
(3)
(3)
(4)
(4)
EquationEquation (3)(3)
(3) is the pricing strategy model of the DC(
), EquationEquation (4)
(4)
(4) is the pricing strategy model of the FC(
);
is the price of
is the export quality of
to country A,
are other countries’ export prices, and
is the influence facts of country A.
The profit equation of is:
(5-1)
(5-1)
where
is the profit, and
is exchange rate between country
and A.
The profit maximisation equation is:
(5-2)
(5-2)
We obtain EquationEquations (6)(6)
(6) and Equation(7)
(7)
(7) by taking the partial derivative of
(6)
(6)
(7)
(7)
Then, we obtain the following processing equation by taking the partial derivative of using EquationEquation (5-2):
And then, we obtain the following equation after transformation.Footnote1
(8-1)
(8-1)
where
is the strategy of country
to other countries when it set the price; thus, labelled as
Then, the profit maximisation condition can be written as:
(8-2)
(8-2)
We use as the conversion of fixed cost when country
produces X and
as the set of the conversion of other competitive countries.
EquationEquation (4)(4)
(4) can be written as follows:
The demand curve of the leading country is:
(9)
(9)
where
is the import volume of country
is the price of FC(n);
is the volume of demand of the import country;
is the fixed-cost conversion of all FC; and
is the set of competitive strategic behaviours of country
The main factors affecting the demand country include its export volume, the demand of the importing country, and the cost-conversion vector of other non-dominant countries. To estimate the demand elasticity facing country
we construct a double-logarithm equation:
(10)
(10)
where
is country
is time;
is the demand elasticity facing country
The value range of
is
When
or close to 0, country
has no dominant power; and the closer
is to 1, the stronger the control ability of country
is;
indicates that country
has complete dominance in the market, in other words, there is no FC.
is a policy dummy variable indicating whether to implement trade regulation policies or not, and
is the random error term.
3.2. Soybeans
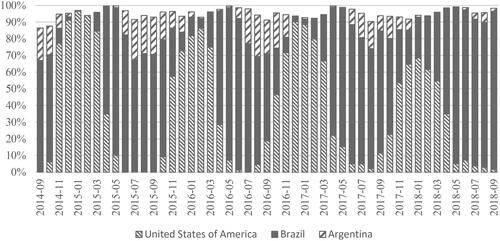
For the convenience, we only investigate the performance of imported soybeans in the Chinese market without considering domestic soybeans. In addition, because there are many types of imported soybeans in China, and non-seed soybeans account for more than 99%, we focus on non-seed soybeans, which are mainly soybeans. We do not consider black beans and mung beans. Only under the circumstance of equal and open market can the study have broader, practical, and referential significance. Since China’s accession to the WTO in 2001 to the announcement of the Chinese government to impose a 25% tariff on U.S. soybeans in September 2018, soybean imports and export policy has remained stable. The data are obtained from January 2005 to September 2018. shows the proportion of imported soybeans from three countries in different months from September 2014 to September 2018.
Figure 1. Share of the main supplies in the Chinese market.
Source: https://comtrade.un.org/data/; https://www.customs.gov.cn; https://data.stats.gov.cn/.
China’s international soybean demand is mainly driven by feed (Xue, Yan, Cui, et al., Citation2022; Xue, Yan, Zhao, et al., Citation2022; Xue et al., Citation2021). Except for a very small amount of exports (less than 1%), soybean meal is mainly used in the production of feed, and its proportion has remained relatively stable. Therefore, domestic feed yield was taken as the reaction of domestic soybean demand. The exchange rate is an international cost factor that affects trade. Therefore, to avoid the influence of the international oil market, and to clarify the focus, this study employed the exchange rate to indicate inter-country influence ().
Table 3. Structure of the soybean import market in China and the results of the CR3 and HHI.
The data resource are as follows: (1) Soybean import quality (HS code: 120100 and 120190) of China was obtained from the General Customs Administration of China (https://www.customs.gov.cn). (2) Soybean imports price are expressed as the unit import value obtained by comparing the value of imports with the import quality. China’s import quality and import value data from the United States, Brazil and Argentina were obtained from the General Customs Administration of China. (3) Domestic feed output was obtained from the China National Database (https://data.stats.gov.cn/) and the China Statistical Yearbook. (4) The exchange rate, expressed by the current currency of the exporting country in terms of the exchange rate with the RMB of China. The data were obtained from the Bank of China (https://www.boc.cn/). (5) Export data for the United States, Brazil and Argentina were from the U.S. Census Bureau (https://www.census.gov/), Ministério do Desenvolvimento, Indústria e Comércio Exterior (https://www.mdic.gov.br/sitio) and Instituto Nacional de Estadística y Censos (https://www.indec.gov.ar/). The world soybean trade data were obtained from UN ComTrade Datebase (https://comtrade.un.org/data/).
4. Results
4.1. Structure of soybean import market in China
From 2001 to 2019, China’s soybean import market was CR3 > 90%, which is a very high market concentration. According to , China’s soybean import market is of the Oligopolistic Type I (CR3 ≥ 85%). However, there was a slight downward trend, from 99% to around 95%. Second, HHI was above 0.3 from 2001 to 2019 with a rising fluctuation after 2010. Combined this with the information in , China’s soybean import market is of the High Oligopolistic Type I (HHI ≥ 0.3).
This comports with the literature. That is, China’s soybean import market structure is an Oligopolistic Market, and the trend is getting worse (Dayan & Jing, Citation2016; Ma & Wang, Citation2012). However, this method cannot accurately reflect the power of a single. Thus, we need a monopoly model for in-depth analysis, which is as follows.
4.2. Market power of soybean import market in China
We use EquationEquation (10)(10)
(10) to build models similar to the Oligopoly Market for elasticity analysis. The models of the U.S., Brazil and Argentina, in the form of double logarithms, are respectively:
(11)
(11)
(12)
(12)
(13)
(13)
where
is exchange rate of the U.S. Dollar to RMB;
is exchange rate of Brazilian real to the RMB;
is exchange rate of Argentine peso to the RMB. For convenience, the exchange rate between countries is taken as the fixed cost.
is random disturbance term. We took the domestic feed output volume as the representative influencing factor of China’s domestic market, expressed by
is a policy dummy variable, indicating whether to implement trade regulation policies.
The next task is to estimate the model coefficients. Since we used time series data, we use the ordinary least squares (OLS) to estimate the coefficients. We first carry out the horizontal stability test and the co-integration relationship test of the sequence.
4.2.1. ADF examination
ADF examination on the time series is necessary to detect possible autocorrelation and spurious regression. The results show that some series are not consistent with rejecting the null hypothesis of existence of the unit root, but after first difference, they all become stationary. displays the results of ADF unit root test.
Table 4. The results of the ADF test.
4.2.2. Cointegration test
The Johansen Co-Integration test tested for a co-integration relationship between variables in the U.S., Brazil and Argentina models.
We found (at the significance level of 5%) a co-integration relationship among import price, import volume, monthly feed output, exchange rate and policy dummy variables (see ). There is at least one co-integration equation in the U.S. model and at least three in the Brazilian and Argentine models.
Table 5. Co-integration test results.
4.2.3. Estimation results
The OLS method was used to estimate the three models. displays the results.
Table 6. The estimated results of models.
Except for the Argentine model, the others have a low fitting degree. However, the F values are all significant at the 1% level, and there is no sequential correlation problem. Therefore, from a comprehensive perspective, all models have a good explanatory power. According to the regression results, all elasticities of demand are negative at 1%, indicating that the soybeans of the three countries all had monopoly power in China’s import market. When imports from the U.S. increase by 1%, the import price will decrease by 0.02%. For Brazil, it is 0.03%. For Argentina, it is 0.06%. This indicates that the change of soybean import quantity has little impact on price, and the sellers’ monopoly power is relatively weak.
The estimated coefficient of the prices of soybean imports for the three countries against the Domestic Feed Production is significantly positive at 1%; thus, there is no monopsony power in soybean imports of China. China’s soybean demand had a significant impact on the import prices of soybeans from the three countries, with Domestic Feed Production increasing by 1%, U.S. soybean prices up 0.81%, Brazilian soybean prices up 0.7%, and Argentine soybean prices up 8%.
The Exchange Rate coefficient is not significant in the U.S. and Brazil models, indicating no significant competitive relationship between the U.S. soybean exports and that of Brazil and Argentina. An important reason is that American soybeans do not simultaneously mature with Brazilian and Argentine soybeans and there is no substitution between them. In the Argentina model, the exchange rate is significant at 10%, which suggests that Brazil has some influence on Argentina, but Argentina’s influence on Brazil is not obvious. The root cause is an overlap between the time Brazil and Argentina come to market, but Brazil occupies an absolute dominant position in the Chinese market, leading to the observed relative competitiveness of Argentina’s soybeans.
The coefficient of the U.S. and Argentina policy dummy variables are not significant, indicating their trade policies in the Chinese market do not impact on soybean prices. However, the coefficient of policy dummy variable in the Brazilian model is significantly negative at the level of 5%, indicating that if Brazil controls exports to China, the export of Brazilian soybean will be caused.
To sum up, (1) The three countries have monopoly power in China’s soybean import market, but they are very weak and may not affect the market price; China has no monopsony power. (2) The U.S. and Brazil are independent and are not affected by the export behaviour of other countries. Argentina was affected by Brazil. The soybeans exported from Brazil to China have a substitution effect on Argentine soybeans, but Argentine soybeans do not replace Brazilian soybeans. (3) The independent trade policy of Brazilian soybeans exported to China plays a role, whereas the trade policy of American and Argentine soybeans in the Chinese market do not.
5. Discussion
5.1. Market structure and market power
This paper argued that the regionalism and seasonality of food production can possibly break the monopoly of international food production and trade. The seasonality of agricultural production limits the monopoly power in time, and regionalism limits the global market share of each country’s production. Moreover, the importing country can also use its advantages in international trade, such as the (buyer’s) large country effect. In that case, even if the seller occupies a large market share, the market is not completely controlled by monopoly power. Our paper clarifies the formation and action of monopoly power, which can help solve international food security problems.
In this study, we measured China’s soybean import market structure by CR3 and HHI, and estimated and studied the monopoly power of soybeans from the U.S., Brazil, and Argentina in the market using the multivariate equations model. The CR3 and HHI show that the market structure is of the Oligopolistic Market. It is consistent with the former research (Ma & Wang, Citation2012; Wang et al., Citation2019). But the model constructed in the paper showed that the relationship between export volume and export price of the three countries were very weak, indicating that the monopoly power of exporters may not substantially affect the market price. That is, China’s soybean imports market evidence no inevitable relationship between market share and monopoly power. In fact, previous studies had also found that the monopoly power of the main soybean exporting country could not play a full role in the market. For example, Muhammad and Valdes found that Argentina can use tariffs to exert monopoly power in China’s soybean import market only in the short run, indicating that the relationship between monopoly power and price is very weak (Muhammad & Valdes, Citation2019). An important reason for the result is the regional and seasonal nature of agriculture. For bulk agricultural products such as soybeans, it may be rational for producers to sell most of the soybeans during the harvest time, taking storage and transportation into account (Bicudo Da Silva et al., Citation2020). The export volume and market share are closely related to the crop production cycle, and short harvest time results in short-lived monopoly power. Another reason is the non-substitutability of the buyers. This makes the producing countries depend on importers to an extent so that they do not have a strong monopoly power even if they occupy a considerable market share.
Therefore, for national security, it is prudent to diversify import sources, especially from different harvest seasons. Furthermore, importers should try to prevent the collusion of large producers, especially those from different latitudes and to prevent a country or multinational business from controlling the global production and trade of important crops (such as rice, wheat, and corn).
At the same time, our results also show that the performance of some countries’ soybeans in China’s soybean market is affected by other countries’ products, while others are relatively independent. For example, the soybeans exported from Brazil to China had a certain substitution effect on Argentine soybeans, and Argentine soybeans could not replace Brazilian soybeans; while the U.S. and Brazil are independent and are not affected by the export behaviour of other countries. The mutual influence among participants is easy to understand, and comports with the literature that the U.S., Brazil, and Argentina are correlated in China’s soybean market (Gale et al., Citation2019; Muhammad & Valdes, Citation2019). It is necessary to return to the seasonality and regionality of agriculture. This may be due to the non-substitutability of the product because there is no competition among soybeans from different locations, given different harvest seasons (Gale et al., Citation2019; Guan et al., Citation2019; Liu & Woo, Citation2018; Voora et al., Citation2020). To enact effective export policy, the exporter should not only know its own products and the importer’s market conditions, but the production of its competitors and the global relationship of its products.
This study also shows that the market power of China in its soybean market is not significant, which means China has no monopsony power. This is due to the non-substitutability of the product or the non-substitutability of the seller, which in turn comports with the literature (Ma & Wang, Citation2012). It is difficult for China to control prices by controlling consumption, and it may be vulnerable to the international soybean trade. The buyer considers the effect of the domestic industrial structure adjustment, the development and improvement of relevant industrial chains, and national security more than it considers the profit. This is also reflected in international trade practices. Sino–U.S. trade friction in 2018 and China’s policy of retaliatory tariffs on U.S. soybeans show that China is concerned not only with the profits of soybean trade but also with the U.S. soybean industry because there is a substitution effect from the same harvest time of the two countries, and tariff policy can promote the development of the domestic soybean and related industries (Liu & Woo, Citation2018). The model constructed in this paper does not reflect this fact, nor does it affect the correctness and rigour of this research. It is, however, a suggested topic for future research.
5.2. Market power and national security
The interdependence of the buyer and the seller and the mutual counterbalance of market forces eventually reach a state of equilibrium, and the situation in China’s soybean market is due to the irreplaceability of the product, the irreplaceability of the buyer and the seller and other reasons. China’s soybeans import market is precisely a monopoly market structure with a balance market power among the main participant. It is the balance that makes it possible for China, a country with more than 1.4 billion people, to solve the problem of food supply in international trade. The long-term and substantial trade between China and the four major soybean producing countries has resulted in a certain degree of interdependence between their soybean industry and China’s market (Bicudo Da Silva et al., Citation2020; Gale et al., Citation2019).
The international trade has formed an interdependent relationship among countries. When the trade volume is large enough, the international security issue is no longer a question of who the controller would be. It would be difficult for any participate to succeed in taking unilateral actions and at least suffer some losses while gaining benefits. The current international trade and WTO policies are moving countries towards integration. For development, there are no enemies but only friends, and ‘Cooperation Benefits Both, While Confrontation Hurts’ (Beesley & Oak, Citation2020; Liu & Woo, Citation2018). Given path dependence of institutional change, the relationships among countries are getting closer, which conforms to the interests of the vast majority of countries.
But the trend of international integration is often challenged, with some countries not satisfied with the existing pattern of interest distribution (Prazeres, Citation2020). It is not wrong to maintenance national interests from the political perspective, but it is a game among countries. In fact, this is a process of interest redistribution initiated by a few market power not satisfied with the existing market equilibrium, let global trade situation into another one (if any), where monopoly power works better (Lester & Zhu, Citation2018). This is, in effect, Kissinger’s idea of controlling other countries through international monopolies; but whether such an equilibrium exists is not known, and what kind of market structure will eventually emerge will depend on how countries play against each other. Thus, the policy challenge between states, especially great powers, is the tension to address national security concerns (Smith & Glauber, Citation2019).
6. Conclusion
For food security of importers, it is necessary to account for the seasonal and regional characteristics of traders in order to diversify trade risks. It is necessary to strengthen international cooperation, strengthen industrial relations between countries, promote international integration, and enhance the status of the country in the international industry chain. In addition, countries should unite to oppose monopolization of international food production and trade.
The empirical findings fully explain many existing contradictory phenomena of the market and provide ideas for solving the practical problems in trade. However, the model constructed in this paper still has room for improvement. Specially, a future model that will account for countries’ differences in industrial characteristics. Future research can expand and improve the seasonal monopoly model and apply it to additional field.
Disclosure statement
No potential conflict of interest was reported by the authors.
Additional information
Funding
Notes
1
References
- Arnade, C., & Pick, D. (2000). Seasonal oligopoly power: The case of the US fresh fruit market. Applied Economics, 32(8), 969–977. https://doi.org/10.1080/000368400322020
- Bai, W., & Li, Y. (1996). An empirical study on industrial concentration in China. China Industrial Economics, (11), 45–50. http://doi.org/10.19581/j.cnki.ciejournal.1994.11.011
- Bain, J. S. (1956). Barriers to new competition: Their character and consequences in manufacturing industries. Harvard University Press.
- Beesley, C., & Oak, E. R. (2020). Trading with the enemy? Framing national security concerns and public opinion about trade.
- Bicudo Da Silva, R. F., Batistella, M., Moran, E., Celidonio, O. L. D. M., & Millington, J. D. (2020). The soybean trap: Challenges and risks for Brazilian producers. Frontiers in Sustainable Food Systems, 4, 12. https://doi.org/10.3389/fsufs.2020.00012
- Cabral, L. M. (2017). Introduction to industrial organization. MIT Press.
- Carter, C. A., & MacLaren, D. (1997). Price or quantity competition? Oligopolistic structures in international commodity markets. Review of International Economics, 5(3), 373–385. https://doi.org/10.1111/1467-9396.00063
- Cui, L., Sun, Y., Melnikiene, R., Song, M., & Mo, J. (2019). Exploring the impacts of Sino–US trade disruptions with a multi-regional CGE model. Economic Research-Ekonomska Istraživanja, 32(1), 4015–4032. https://doi.org/10.1080/1331677X.2019.1679211
- Dayan, L., & Jing, Z. (2016). An analysis on the effects of changes in import structure on China’s soybean import price under the background of imperfect competition. Management Review, 28(9), 31–40.
- Devine, P. J., Lee, N., Jones, R. M., & Tyson, W. J. (2018). An introduction to industrial economics (Vol. 14). Routledge.
- Foda, R. B. (2016). Kissinger: Control food and you control the people. https://shareverything.com/2016/05/23/kissinger-control-food-and-you-control-the-people/
- Gale, F., Valdes, C., & Ash, M. (2019). Interdependence of China, United States, and Brazil in soybean trade. Technical Report (pp. 1–48). US Department of Agriculture’s Economic Research Service (ERS) Report.
- Goldberg, P. K., & Knetter, M. M. (1999). Measuring the intensity of competition in export markets. Journal of International Economics, 47(1), 27–60. https://doi.org/10.1016/S0022-1996(98)00015-4
- Guan, C., Yahalom, S. S., Germanakos, L., Lapage, S., & McKeever, B. (2019). Global soybean trade, supply chain and tariffs. WIT Transactions on the Built Environment, 187, 239–250.
- Karp, L. S., & Perloff, J. M. (1989). Dynamic oligopoly in the rice export market. The Review of Economics and Statistics, 71(3), 462–470. https://doi.org/10.2307/1926903
- Krugman, P. R., Obstfeld, M., & Melitz, M. J. (2018). International trade: Theory & policy. Pearson Education Limited.
- Lerner, A. (1934). The concept of monopoly and the measurement of monopoly power. The Review of Economic Studies, 1(3), 157–175. https://doi.org/10.2307/2967480
- Lester, S., & Zhu, H. (2018). A proposal for rebalancing to deal with national security trade restrictions. Fordham International Law Journal, 42, 1451.
- Liberman, P. (1996). Trading with the enemy: Security and relative economic gains. International Security, 21(1), 147–175. https://doi.org/10.2307/2539111.
- Liu, T., & Woo, W. T. (2018). Understanding the US-China trade war. China Economic Journal, 11(3), 319–340. https://doi.org/10.1080/17538963.2018.1516256
- Ma, S., & Wang, J. (2012). Whether there is a "Big Country Effect" in China’s grain import trade: Based on the analysis of soybean import market power. Issues in Agricultural Economy, 33(9), 24–32+110.
- Mackinnon, A., Jorm, A. F., Christensen, H., Korten, A. E., Jacomb, P. A., & Rodgers, B. (1999). A short form of the Positive and Negative Affect Schedule: Evaluation of factorial validity and invariance across demographic variables in a community sample. Personality and Individual differences, 27(3), 405–416. https://doi.org/10.1016/S0191-8869(98)00251-7, https://www.sciencedirect.com/science/article/abs/pii/S0191886998002517
- Meijer, H. (2016). Trading with the Enemy: The Making of US Export Control Policy toward the People's Republic of China. Oxford and New York: Oxford University Press. https://www.cambridge.org/core/journals/china-quarterly/article/trading-with-the-enemy-the-making-of-us-export-control-policy-toward-the-peoples-republic-of-china-hugo-meijer-oxford-and-new-york-oxford-university-press-2016-xiii-416-pp-7400-isbn-9780190277697/FBA4E12535FDE3A7CB5CEFBABBA1A14D
- Muhammad, A., & Valdes, C. (2019). Export tax reform and the competitiveness of imported soybeans in China. Journal of Agricultural and Applied Economics, 51(3), 511–525. https://doi.org/10.1017/aae.2019.15
- Nakajima, T. (2012). Estimating time variation of market power: Case of us soybean exports (No. 323-2016-11346. 2012). University of Tokyo.
- Nakano, T. (2011). TPP and national subjugation. Shueisha Inc.
- Olmstead-Rumsey, J. (2019). Market concentration and the productivity slowdown. https://mpra.ub.uni-muenchen.de/107000/
- Porter, M. E. (1979). The structure within industries and companies’ performance. The Review of Economics and Statistics, 61(2), 214–227. https://doi.org/10.2307/1924589
- Prazeres, T. L. (2020). Trade and national security: Rising risks for the WTO. World Trade Review, 19(1), 137–148. https://doi.org/10.1017/S1474745619000417
- Rubens, M. (2021). Market structure, oligopsony power, and productivity. Oligopsony Power, and Productivity Retrieved 8 March, 2021, from https://papers.ssrn.com/sol3/papers.cfm?abstract_id=3800254
- Shougennji, S. (2006). Policy reform in Japanese agro-food sectors. University of Tokyo Press.
- Smith, V. H., & Glauber, J. W. (2019). Trade, policy, and food security. Agricultural Economics, 51(1), 159–171. https://doi.org/10.1111/agec.12547
- Soysal, G., & Chintagunta, P. K. (2019). What explains price declines in seasonal goods markets? An empirical examination. An Empirical Examination. Retrieved 10 January, 2019, from https://papers.ssrn.com/sol3/papers.cfm?abstract_id=3313627
- Su, D., & Su, Z. (2021). The industrial economics (5th ed.). Higher Education Press.
- Trump, D. J. (2017). National security strategy of the United States of America. Executive Office of The President.
- Ukav, I. (2017). Market structures and concentration measuring techniques. Asian Journal of Agricultural Extension, Economics & Sociology, 19(4), 1–16. https://doi.org/10.9734/AJAEES/2017/36066
- Unwin, G. (2019). Industrial organization in the sixteenth and seventeenth centuries. Routledge.
- Voora, V., Larrea, C., & Bermudez, S. (2020). Global market report: Soybeans. JSTOR.
- Wang, Y., Xiao, G., Gong, B., & Wang, Q. (2019). A study on market structure and price elasticity of soybean import in China under the background of Globalization. The Theory and Practice of Finance and Economics, 40(2), 149–154. https://doi.org/10.16339/j.cnki.hdxbcjb.2019.02.021
- Winfree, J. A., McCluskey, J. J., Mittelhammer, R. C., & Gutman, P. (2004). Seasonal oligopoly power in the D’Anjou pear industry. Journal of Food Distribution Research, 35(2), 56–65. https://doi.org/10.22004/ag.econ.27238
- Xue, Y., Yan, J., Cui, Y., Zhao, H., Zhang, Y. n., Ma, C., & Zheng, H. (2022). The technical efficiency of beef calf production systems: Evidence from a survey in Hebei, China. Agriculture, 12(10), 1604. https://doi.org/10.3390/agriculture12101604
- Xue, Y., Yan, J., Zhao, H., Zheng, H., & Ma, C. (2022). Can domestic animal husbandry develop independently? An empirical study of China’s beef cattle industry. Pakistan Journal of Zoology, 54(3), 1053–1062. https://doi.org/10.17582/journal.pjz/20201015081030
- Xue, Y. J., Yan, J. L., Zhao, H. F., & Ma, C. H. (2021). Meat consumption practice in China: An empirical analysis based on elastic theory. Journal of Animal and Plant Sciences, 31(6), 1779–1787. https://doi.org/10.36899/japs.2021.6.0382
- Yamazawa, I. (2015). TPP, RCEP and rice policy in Japan. Intentional Trade and Investment, 27(3), 45–59.
- Yan, J., Xue, Y., & Mohsin, M. (2022). Accessing occupational health risks posed by fishermen based on fuzzy AHP and IPA methods: Management and performance perspectives. Sustainability, 14(20), 13100. https://doi.org/10.3390/su142013100