?Mathematical formulae have been encoded as MathML and are displayed in this HTML version using MathJax in order to improve their display. Uncheck the box to turn MathJax off. This feature requires Javascript. Click on a formula to zoom.
Abstract
Green technological innovation (G.T.I.) contributes to making economic growth compatible with ecological sustainability (E.S.). Thus, in light of environmental challenges and attempts of emerging economies’ progress toward a green revolution, this study examines the effects of G.T.I. on green growth (G.G). and E.S. for 25 emerging economies from 1990 to 2018. It also investigates the moderating role of G.T.I. on the impacts of energy intensity and foreign direct investment (F.D.I.) on G.G. and E.S. to illustrate the energy rebound effect and pollution haven hypothesis. The Fully modified least square (F.M.O.L.S.), the Dynamic least square (D.O.L.S.), and the Pooled mean group autoregressive distributed lag (P.M.G./A.R.D.L.) estimators are used. The findings imply that G.T.I. positively impacts G.G. and E.S. in emerging economies. Conversely, F.D.I. and energy intensity have adverse effects on G.G. and E.S. However, the negative effects of F.D.I. and energy intensity on G.G. and E.S. are decreasing with respect to G.T.I., implying that emerging countries promoting G.T.I. minimize the pollution haven effects of F.D.I. and mitigate the negative effect of energy intensity. Therefore, G.T.I. is a vital factor to facilitate the pathway to the green revolution in emerging economies. Policy implications are forwarded based on the findings of the study.
1. Introduction
Climate change and increasing ecological deficit are among countries’ foremost coercions and challenges (Anwar et al., Citation2021) and have recently motivated countries to promote a carbon-resilient economy and ecological sustainability (E.S.) (Galeotti et al., Citation2020). These challenges required countries to balance economic activities and E.S., promote green growth (G.G.). Some literature argues that green technological innovation (G.T.I.) is an important means of improving the environment and directly contributes to the progress toward G.G. and E.S. (Fernandes et al., Citation2021). It contributes to the green revolution by promoting new technologies and business models that positively impact the environment and society (Fernandes et al., Citation2021; Meiling et al., Citation2020; Sohag et al., Citation2021; Nosheen et al., Citation2021).
Moreover, it is argued that G.T.I. can play a crucial role in the efficient usage of energy sources, which indirectly contributes to G.G. and E.S. (Fisher-Vanden et al., Citation2006). In other words, G.T.I. affects energy intensity which has been widely used as an indirect way to indicate technological progress in terms of energy conservation effect (Zhang & Lin, Citation2012) and improves energy efficiency (Wang et al., Citation2019). Besides, G.T.I. can moderate the relationship between foreign direct investment (F.D.I.) and G.G. and productivity (Xu & Li, Citation2021) because countries promoting G.T.I. can attract new F.D.I. that can transfer and disseminate new technologies, direct the existing investment to the eco-friendly business and minimize the pollution haven effects of F.D.I. inflow to less advanced countries (Lin & Chen, Citation2018).
In contrast, some other empirical studies argue that G.T.I. negatively affects G.G. and E.S. by increasing carbon emissions and will contribute to the depletion of ecological resources (Santra, Citation2017). It adversely affects G.G. and E.S. through the technological or energy rebound effect (Wang & Wei, Citation2020). Also, due to the high initial cost of G.T.I. and the application of G.T.I. will be limited by the level of economic size, the impact of G.T.I. on the G.G. and E.S. is insignificant (Liu et al., Citation2020).
Therefore, despite all the above empirical studies, there is no clear consensus among economists on the impacts of G.T.I. on G.G. and E.S. and remains rather inconclusive due to the differences in the econometric methods and models, time horizon, sample countries and regions and the existing studies mainly target advanced economies and a few developing countries. Thus, this study is motivated to fill this gap by examining the impacts of G.T.I. on G.G. and E.S. in emerging economies. The selection of emerging economies as a case study is based on the following facts. First, emerging economies have registered the fastest economic growth in the last three decades. They have shared almost 60% of the world’s gross domestic product (G.D.P.) growth (Lin & Wang, Citation2019). Consistently, the average economic growth of the sample emerging economies considered in this study stood at 3.76%, which is greater than the average world economic growth of 3.13% (). Besides, these countries are recently industrialized (Adebayo et al., Citation2022).
Second, the accelerated growth in emerging economies has come with challenges of increased energy consumption and depletion of natural resources (Ozturk & Uddin, Citation2012; Khattak et al., Citation2020), as natural resource extraction was the main source of growth. For instance, some emerging economies such as Colombia, Chile, Indonesia, Brazil, and Turkey are on the front list regarding the contribution of subsoil assets to their economic growth (OECD, Citation2017). Additionally, little progress in resource use efficiency and productivity and increasing environmental conflicts because of resource-based economic activities have challenged the progress of G.G. and E.S. in emerging economies (Capozza & Samson, Citation2019).
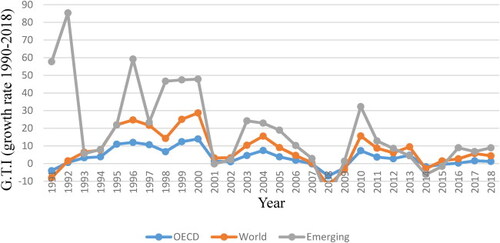
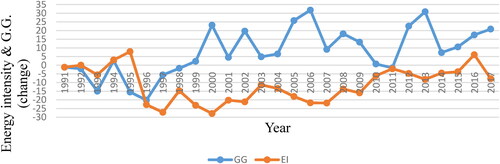
Third, emerging economies have been largely contributing to CO2 emissions. For example, on average, the sample emerging economies contributed 49.5% of CO2 emissions for the last three decades (). Besides, some emerging economies such as China, India, Russia, Turkey, Indonesia, and Saudi Arabia are among the most polluted economies (Huang et al., Citation2022). There are also rapidly rising greenhouse gas emissions in some of these countries (Wolf et al., Citation2022). Fourth, the ecological footprint has been increasing in the sample countries and was greater than the world ecological footprint growth (). Thus, environmental and resource productivity has worsened in these economies as they are facing ecological deficits. Fifth, these countries consume more than one-third of the world’s energy (IEA, Citation2022) with a limited percentage share of renewable energy consumption (19.37%) and a declining rate of renewable energy share (). Sixth, F.D.I. to emerging economies has increased from about 5% in 2000 to almost 19% in 2020 (Xie & Sun, Citation2020) and above world average F.D.I. inflow (). Finally, emerging economies significantly improved the growth rate of G.T.I. compared to the rest of the world ().
Hence, increasing energy consumption, depletion of natural resources, greenhouse and carbon emissions, ecological deficit, economic growth and industrialization, F.D.I. inflow, and their pressure on the environment have recently motivated emerging economies to promote G.G. and E.S. (Galeotti et al., Citation2020; Yarimoglu & Binboga, Citation2019). However, the question of how to improve G.G. and E.S. in emerging economies has become a focus of attention, which this study is aimed to investigate. Thus, against this background, this study addresses three specific research questions. First, does G.T.I. promote G.G and E.S. in emerging economies? Second, how does G.T.I. moderates the impacts of energy intensity on G.G. and E.S.? Third, how G.T.I. moderates the effects of F.D.I. on G.G. and E.S. in emerging economies? Motivated by these research questions, this study provides fresh evidence on the effects of G.T.I. on the G.G. and E.S. progress of 25 emerging economies using data from 1990 to 2018. We used the F.M.O.L.S., D.O.L.S. and P.M.G./A.R.D.L. estimators. It further investigates the moderating role of G.T.I. in the impacts of energy intensity and F.D.I. on G.G. and E.S. to revisit the energy rebound effect of G.T.I. and G.T.I.'s role in reducing the pollution haven effect of F.D.I.
This study contributes to the existing literature in several ways. First, this is the first study to examine the effects of G.T.I. on G.G. and E.S. in a wide range of emerging market economies. Second, an interesting endeavour of this study is examining the moderating role of G.T.I. on the impacts of energy intensity and F.D.I. on G.G. and E.S. Thus, it is able to investigate the indirect effects of G.T.I. by improving energy efficiency and reducing negative effects of F.D.I. Third, E.S. is proxied by the ecological footprint, a broader concept that is an important variable in defining biocapacity and E.S. Also, we drive an aggregate indicator of G.G. from environmental and resource productivity indicators, which are more important indicators of the progress of G.G. (Demiral & Demiral, Citation2021), applying principal component analysis. Finally, it employs heterogeneous dynamic panel data models, namely the F.M.O.L.S., D.O.L.S., and P.M.G./A.R.D.L., that can solve endogeneity concerns, cross-sectional dependence and heterogeneity issues.
The remainder part of this study is organized as follows. Section 2 provides a review of the literature. Section 3 presents the methodology and data of the study. Section 4 contains the results and findings. Section 5 provides discussions and policy implications.
2. Literature review
2.1. Green technological innovation and green growth
The G.G. concept appears as a new terminology regarding E.S. and modernization. The G.G. concept, whose origins can be taken until the 1970s, is accepted as a mandatory criterion for sustainable development (Awan et al., Citation2021). The G.G. theory then starts from the simple observation that the natural environment is also a factor of production, but one which both classical growth theory and historic patterns of economic growth in practice have largely ignored (Solow, Citation1974). Theoretically, it was introduced as a model, claiming that G.G. requires balancing economic activities and the environment. Moreover, the green economy in eco-modernization theory implies that human initiative will be able to match economic advancement with environmental improvement (Mol & Sonnenfeld, Citation2000). Based on this theoretical foundation, the G.G. concept can be interpreted as a low-carbon intensive and resource-efficient strategy for attaining economic development.
Similarly, modern growth theories provide evidence that directed technological innovation positively influences G.G. (Acemoglu et al., Citation2016). It also includes technological advancements in energy conservation, pollution prevention, and waste recycling. Thus, it promotes environmentally friendly technologies and reduces the cost of environmental sustainability (Popp, Citation2012).
Based on this theoretical foundation, a few empirical studies investigated the effects of G.T.I. on G.G. and E.S. For instance, Meiling et al. (Citation2020) assess the impact of technological innovation on green total factor productivity within O.E.C.D. countries. The results imply that technological innovation has a significant positive influence on green productivity. Also, Fernandes et al. (Citation2021) and Sohag et al. (Citation2021) analysed technological innovations’ role in G.G. using the O.E.C.D. countries, showing that G.T.I. promotes G.G. Similarly, Nosheen et al. (Citation2021) estimated the impact of green technology on G.G., demonstrating that green technology increases G.G. Moreover, G.T.I. promotes G.G. through carbon neutrality (Jian & Afshan, Citation2022; Fu et al., Citation2022). Also, a recent study by Liguo et al. (Citation2022) revealed that technologies associated with marine energy innovation negatively affect CO2 emissions in the U.S.A. Besides, You et al. (Citation2022a) examined the effects of innovation in various aspects of renewable energy-related technologies on CO2 emissions in the U.S.A. and found that innovation in renewable energy generation plays a significant role in mitigating CO2 emissions in the U.S.A. Therefore the following hypothesis is be articulated based on the literature.
H1a: G.T.I. positively impacts the progress toward G.G.
2.2. Green technological innovation and ecological sustainability
E.S. is represented by the ecological footprint that measures the carrying capability of the ecosystem or biocapacity. It is a consumption-based indicator of E.S. calculated in global hectares (gha) that accounts for people’s demand for biological assets and the supply of nature (G.F.N., 2019). The ecological modernization theory first presented the concept of E.S. by Huber (Citation2000) based on the principles that revolve around how contemporary industrialized societies deal with environmental concerns. This theory was based on the notion that the earth has a finite quantity of non-renewable resources. However, rapid economic growth is depleting the stock of natural resources and adversely affecting the environment, thus, worsening E.S.
Some empirical studies argue that G.T.I. can positively influence E.S. For example, Ahmad et al. (Citation2020) found that technological innovations have negative impacts on ecological footprint, implying that technological innovations promote E.S. A more recent study by Khattak and Ahmad (Citation2022a) investigated the effects of green and sustainable technologies on CO2 emissions in O.E.C.D. countries and findings implied that positive shocks to sustainable technological innovation decrease CO2 emissions and the negative shocks to it increases CO2 emissions. These outputs are congruent with the findings of Weimin et al. (Citation2022), which investigated the impacts of innovation on ecological quality in a panel of countries.
Also, Khattak et al. (Citation2022) examined the asymmetrical and cyclical relationship between environmental-friendly technological innovation and CO2 emissions using a panel of G7 nations and found that positive shocks in innovation in these technologies mitigate CO2 emissions during economic boom periods. This analysis was further applied by Khattak and Ahmad (Citation2022b) to the B.R.I.C.S. economies, and their findings showed that the relationship between green and sustainable technology and CO2 emissions was counter-cyclical during economic expansion and contraction. Moreover, the findings of Khattak et al. (Citation2022) and Khattak and Ahmad (Citation2022b) support the evidence of Xin et al. (Citation2021) and Ahmad and Zheng (Citation2021), who found consistent results in the U.S.A. and B.R.I.C.S. economies.
Furthermore, You et al. (Citation2022b) examined the relationship between international collaboration in environmental-related technologies and CO2 emissions in the U.S.A. The results indicated that environmental innovation and international collaboration in environmental-related technology decrease CO2 emissions. Besides, Ding et al. (Citation2021) suggested that eco-innovation is among the factors affecting CO2 emissions in the G7 countries. On the other hand, Tao et al. (Citation2022) investigated the effects of fintech on carbon and greenhouse gas emissions and showed that fintech reduces greenhouse gas emissions. Also, Su et al. (Citation2022) investigated the effects of green credit on air quality in China and showed that green credit in infancy and mature stages have diverse effects on the environment, with no effect at the initial stage and a significant effect at the later stage. Therefore, the following hypothesis is formulated based on the literature.
H1b: G.T.I. positively contributes to E.S.
2.3. Green technological innovation, energy intensity, F.D.I., green growth, and ecological sustainability
Energy consumption is positively related to CO2 emissions (Ozturk et al., Citation2022) and negatively associated with E.S. (Bilgen, Citation2014), which may result in adverse effects on progress toward G.G. Furthermore, Su et al. (Citation2022) argue that renewable energy has a role in reducing emissions. Also, Qin et al. (Citation2022) provided evidence that renewable energy consumption has improved the U.S.A.’s carbon neutrality. However, energy intensity has been widely used as an indirect way to show the effects of G.T.I. on G.G. and E.S. in terms of energy conservation effect (Zhang & Lin, Citation2012). Moreover, some empirical studies provide evidence that G.T.I. can moderate the relationship between energy consumption intensity, G.G. and E.S. Erdoğan et al. (Citation2020), Churchill et al. (Citation2019) and Ibrahim and Ajide (Citation2021) show that G.T.I. could play a vital role in attaining sustainability of the environment by moderating the effects of energy efficiency via the production of energy-efficient technologies. Besides, it can stimulate efficiency in the way energy products are utilized (Churchill et al., Citation2019), hence moderating the impacts of energy intensity on G.G. and E.S. However, Wang and Wei (Citation2020) argue that promoting G.T.I. can negatively affect progress toward G.G. and E.S. through the energy rebound effect. Thus, the following hypotheses are developed.
H2a: Energy intensity negatively affects G.G. and E.S.
H2b: G.T.I. negatively moderates the relationship between energy intensity and G.G.
H2c: G.T.I. negatively moderates the relationship between energy intensity and E.S.
Moreover, the existing literature has inconsistent results regarding the effects of F.D.I. on G.G. and E.S. Yilanci et al. (Citation2019) provide evidence that F.D.I. negatively affects environmental progress by increasing CO2 emission, thus, adversely affecting G.G. and E.S., supporting the pollution haven hypothesis which claims that investment from developed countries adversely affects G.G. and E.S. in developing countries. However, Waqih et al. (Citation2019) and Lin and Chen (Citation2018) provide evidence that F.D.I. positively influences G.G. and E.S., supporting the pollution halo hypothesis that argues that investments from advanced economies contribute to the host country’s progress toward G.G. and E.S. by promoting green technology spillover. However, Xu and Li (Citation2021) argue that innovation positively moderates the effect of F.D.I. on green productivity, which can mitigate the pollution haven effects of F.D.I. Thus, the following hypotheses are formulated.
H3a: F.D.I. negatively affects G.G. and E.S.
H3b: G.T.I. negatively moderates the relationship between F.D.I. and G.G.
H3c: G.T.I. negatively moderates the relationship between F.D.I. and E.S.
2.4. Summary and research gap
The studies discussed above examined the impacts of G.T.I., F.D.I., and energy on environmental quality, G.G. and E.S. These studies have substantial contributions in the area; however, they have some gaps this study aimed to fill. First, unlike our study, most of these studies examined the impacts of energy and environmental-related technological innovation on CO2 emissions, considering CO2 emissions as the environmental quality indicator. However, CO2 emissions cannot fully capture the impacts of G.T.I. on G.G. and E.S. Thus, if CO2 emission is taken to exclusively reflect environmental quality, empirical results may mislead policymakers. In order to concretely quantify environmental quality and E.S., another comprehensive measure of environmental quality is required (Wang et al., Citation2022). Hence, this study is more robust because E.S. is proxied by ecological footprint, which has the advantage of including a variety of aspects of environmental degradation, including the footprints of agricultural land, carbon emissions, grazing land, forests, fishing grounds, and built-up land (Wackernagel & Rees, Citation1996). Moreover, we used the environmental and resource productivity index, which is a more important indicator of the progress of G.G. (Demiral & Demiral, Citation2021).
Second, previous studies on the association between G.G. and technological innovation mostly focused on a panel of developed countries, especially O.E.C.D. countries (Meiling et al., Citation2020; Fernandes et al., Citation2021; Nosheen et al., Citation2021; Sohag et al., Citation2021), the effect of G.T.I. on CO2 emissions in G-7 countries (Ibrahim & Ajide, Citation2021; Khattak et al., Citation2022) and the impacts of environmental-related technological innovation on CO2 emissions in the U.S.A. (Liguo et al., Citation2022; Su et al., Citation2022; Khattak & Ahmad, Citation2022a; Xin et al., Citation2021; You et al., Citation2022a) and some emerging economies (B.R.I.C.S.) (Khattak & Ahmad, Citation2022b; Ahmad and Zheng (Citation2021). Therefore, unlike existing empirical studies, which mainly focus on the impacts of green innovation on CO2 in a panel of advanced or individual economies, this study primarily focuses on the effects of G.T.I. on G.G. and E.S. in the panel of emerging economies, considering comprehensive indicators of G.G. and E.S.
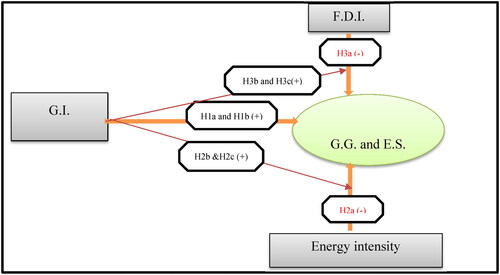
Third, this study is unique to existing empirical studies as it analyses the indirect impacts of G.T.I. on G.G. and E.S. by revisiting the moderating role of G.T.I. on the impacts of energy intensity and FDI on G.G. and E.S. Hence, by including the interaction term of F.D.I. and G.T.I., we will be able to investigate the extent to which G.T.I. can promote G.G. in terms of reducing pollution haven effect of F.D.I. Thus, it can provide evidence on the indirect effects of G.T.I. by affecting energy efficiency and the impacts of F.D.I. on G.G. and E.S. Therefore, given the growing importance of emerging economies’ energy consumption, the energy intensity and its interaction with G.T.I. in emerging economies should be considered in the pathway of the green revolution. depicts the conceptual framework of the study.
Figure 1. Conceptual framework.
Source: Authors' formulated.
3. Methodology and data
3.1. Method of analysis
There is an increasing interest in panel data methods, where the number of time-series observations is of a similar order of magnitude of panel groups or relatively large. In most applications of this type, the estimates of interest are the long-run effects and the speed of adjustment in the long-run (Pesaran et al., Citation1999). To this end, this study used the Pedroni (Citation2001) heterogeneous F.M.O.L.S. and D.O.L.S. estimators for the panel cointegration regression estimate long-run EquationEqs. (1)(1)
(1) and Equation(2)
(2)
(2) for G.G. and E.S., respectively, as they can correct endogeneity and serial correlation and provide reliable estimates of parameters (Ozcan, Citation2013) and are widely used in empirical panel studies.
(1)
(1)
where GGi,t is the progress toward green growth of i-country at time t, GGi,t-1 is the lagged value of green growth. Ci,t, FDIi,t, and CFi,t are consumption expenditure, F.D.I. and gross fixed capital formation, respectively. Ri,t, and EIi,t are renewable energy share and energy intensity, respectively. GIi,t is G.T.I. µij is the coefficient of the lagged dependent variable (G.G.), β, α, κ, σ, ο and ϑ are coefficient vectors, and εit represents the stochastic term.
(2)
(2)
where ESi,t is the ecological sustainability proxied by the ecological footprint of i-country at time t, ESi,t-1 is the lagged value of E.S. GDPi,t, Popi,t and FDIi,t are the real G.D.P., F.D.I. and population size, respectively. Ri,t, and EIi,t are renewable energy share and energy intensity, respectively. GIi,t is G.T.I. and µij is the coefficient of the lagged dependent variable (G). β, θ, ϕ, φ, ξ and τ are coefficient vectors, and εit represents the stochastic term.
Moreover, to investigate the indirect effect of G.T.I. on G.G. and E.S. by moderating the impacts of energy intensity and F.D.I., we redefine EquationEqs. (1)(1)
(1) and Equation(2)
(2)
(2) . It is based on the notion that including the interactions between G.T.I. and energy as well interaction between G.T.I. and F.D.I. will help us specify the extent to which G.T.I. can contribute to G.G. and E.S. in terms of energy efficiency (Wang et al., Citation2019) and reducing pollution haven effect of F.D.I. Therefore, the following models are defined to examine the moderating role of G.T.I. on the impacts of energy intensity and F.D.I. on G.G. and E.S., respectively.
(3)
(3)
(4)
(4)
where γ, ψ, ϑ and π are coefficients of the interaction terms.
Alternatively, P.M.G./A.R.D.L. is applied to simultaneously estimate the long and short-run effects of G.T.I. on G.G. and E.S. and for robustness test (see Supplementary material, available online).
3.2. Data
This study used a panel of 25 emerging economies (based on I.M.F. classification) for 1990–2018 based on data availability for ecological footprint.Footnote1
3.2.1. Dependent variables
There are two dependent variables: environment and resources productivity index to proxy G.G. and ecological footprint to proxy E.S. Environmental and resource productivity, one of the G.G. indicators, is a more important indicator of the progress toward G.G. (Demiral & Demiral, Citation2021). Therefore, CO2 productivity, and energy and non-energy resources productivity are important indicators of G.G. (Demiral & Demiral, Citation2021). Using environment and resource productivity indicators data from the O.E.C.D. database, we derive a single indicator using principal component analysis (see Supplementary material, available online). E.S. is proxied by ecological footprint, which accounts for six categories of ecological assets: fishing grounds, cropland, forest products, built-up land, grazing land, and carbon demand on land (GFN, Citation2019). We borrowed the data from the G.F.N. database.
3.2.2. Target variables
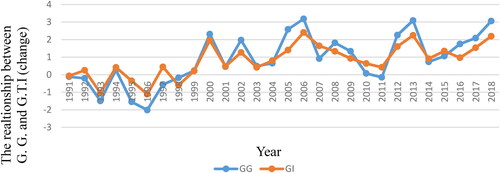
The target variables are G.T.I., F.D.I. and energy intensity. Most of the existing literature adopted the number of patented grants to measure G.T.I. because patents are essential aspects reflecting innovation capabilities. Therefore, G.T.I. is proxied by the number of patents related to technology development with higher value inventions (with the patent family of two) from the O.E.C.D. database following the works of Fernandes et al. (Citation2021). There is a positive association between G.G. and G.T.I. ().
Figure 2. The pattern of G.T.I. and G.G. Source: Calculated by authors from O.E.C.D. data.
Energy intensity is measured by energy consumption per kilowatt hour per dollar. We used energy intensity data compiled by Our World in Data. Because it is negatively associated with energy efficiency and intensity, it shows the indirect effect of G.T.I. on G.G. and E.S. by affecting energy efficiency (Wang et al., Citation2019). Thus, it is negatively associated with G.G. (). The net inflow of F.D.I. is taken from the W.D.I. of the World Bank database and included in the regression following the works of Demiral and Demiral (Citation2021). F.D.I. and G.G. have a negative pattern ().
Figure 3. The relationship between F.D.I. and G.G. Source: Calculated by authors from O.E.C.D. and Our World in Data databases.
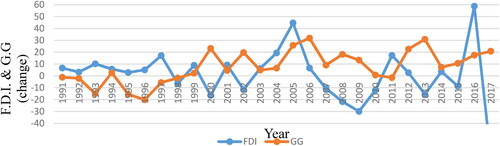
Figure 4. The relationship between energy intensity and G.G. Source: Calculated by authors from O.E.C.D. and W.D.I databases.
3.2.3. Control variables
Control variables are included based on existing literature. The data for gross fixed capital formation, consumption expenditure, population size and G.D.P. per capita is borrowed from the W.D.I. of the World Bank database. Additionally, renewable energy share data is utilized from Our World in Data. The descriptive statistics for all the variables are reported in Table S1 in the Supplementary material, available online. We used the inverse hyperbolic sine to transform variables with zero-valued and negative observations (see Supplementary material, available online).
Table 1. Stationarity tests.
4. Results and findings
4.1. The panel unit root tests test
A panel unit root test of Im et al. (Citation2003) is conducted to test the null hypothesis of unit root against the alternative hypothesis of no unit root. The results show that F.D.I., energy intensity and fixed capital formation are stationary at I(0) (). However, all other variables are stationary at the first difference. Besides, the dependent variables, G.G. and E.S., are stationary at I(1).
4.2. Co-integration test
We test long-run cointegration using Westerlund (Citation2007) and Pedroni (Citation2001), which are techniques most extensively applied methods to investigate the cointegration relationship. The results indicate that of Pedroni cointegration test confirms the rejection of the null hypothesis across three models. Similarly, Westerlund’s (Citation2007) test accepts the alternative hypothesis at a 1% significance level in all specifications ().
Table 2. Pedroni and Westerlund cointegration test.
We also found consistent results from Kao’s test (See Supplementary material, available online).
4.3. The effects of green technological innovation on green growth
This section provides the effects of G.T.I. on G.G. The results are reported in .
Table 3. The effects of G.T.I. on G.G. (F.M.O.L.S. & D.O.L.S. estimators).
The signs of the coefficients and significance of control variables estimators are consistent with the existing empirical works. Capital formation has a statistically significant positive impact on G.G. Also, consumption expenditure has a robust positive effect on progress toward G.G. Also, renewable energy share has a positive effect on progress toward G.G. in emerging economies, which provides evidence that renewable energy consumption contributes to environmental quality and progress toward environmental sustainability.
Regarding variables of interest, G.T.I. has a statistically significant positive impact on G.G., implying that G.T.I. promotes progress toward G.G. in emerging economies (). The effects of G.T.I. are consistent with the hypothesis (H1a). Therefore, G.T.I. is an important driving factor in promoting the G.G. of emerging economies. However, the effects of F.D.I. on G.G. are negative and statistically significant, implying that F.D.I. flow to emerging economies has adverse effects on the progress toward G.G. These findings are consistent with the pollution haven hypothesis that F.D.I. accelerates emissions in the host country and claims that developed countries seek to establish factories abroad through F.D.I. flows, leading to more emissions and pollution (Cole, Citation2004). Moreover, energy intensity has a significant negative effect on G.G., implying that an increase in energy consumption intensity adversely affects the G.G. progress of emerging market economies.
Moreover, using the P.M.G./A.R.D.L. model, we further investigate the long-run and short-run effects of G.T.I. on G.G. The results spotlight that the coefficients of error correction terms are negative and statistically significant (See Table S3 in Supplementary material, available online). Therefore, the results confirm the existence of an established long-run relationship among the variables. The statistical significance of the error correction term also shows the rate of convergence from short-run to long-run equilibrium. The long-run estimates of P.M.G./A.R.D.L. are consistent with the results of F.M.O.L.S. and D.O.L.S. Regarding short tun effects, G.T.I. positively affects progress toward G.G. in emerging economies.
4.4. The effects of green technological innovation on ecological sustainability
In this section, we examine the impacts of G.T.I. on E.S. The results are presented in .
Table 4. The impacts of G.T.I. on E.S. (F.M.O.L.S. & D.O.L.S. estimators).
The coefficients of control variables are consistent with the existing theoretical and empirical literature. The G.D.P. per capita has a statistically significant positive impact on ecological footprint, indicating that economic growth negatively impacts E.S. Also, population growth has robust positive effects on ecological footprint and adversely affects E.S. Moreover, renewable energy share negatively affects the ecological footprint and contributes to E.S. in emerging economies.
Regarding our target variables, G.T.I. negatively influences ecological footprint and contributes to E.S. in emerging economies. Thus, the result is consistent with the hypothesis (H1b). Therefore, the increase in G.T.I. related to the environment is critical for long-term E.S. as it significantly decreases ecological footprints. However, energy intensity has a positive and significant effect on ecological footprint and negatively affects E.S. Moreover, long-run and short-run effects of G.T.I. on E.S. using P.M.G./A.R.D.L. are consistent with the results of F.M.O.L.S. and D.O.L.S. Regarding short tun effects, energy intensity has a negative effect on E.S. in the short run (See Table S4 in Supplementary material, available online).
4.5. The moderating role of green technological innovation
We further investigate the moderating role of sustainable technological innovation on the impacts of energy intensity on G.G. and E.S. ( and ). The impact of the interaction term of G.T.I. and energy intensity on G.G. is positive and statistically significant (). Also, the interaction of G.T.I. and energy intensity has a negative and statistically significant effect on the ecological footprint (). Moreover, the impact of the interaction term of G.T.I. and F.D.I. on G.G. is positive and statistically significant. Finally, the interaction of G.T.I. and F.D.I. has a negative and substantially significant impact on the ecological footprint. Thus, the findings consistent with our hypotheses. To further discuss the marginal effects of energy intensity and F.D.I. on G.G. and E.S. with respect to G.T.I., we calculate the partial derivative of G.G. and E.S. subject to energy intensity and F.D.I. (see Supplementary Material, available online).
The results indicate the negative effect of energy intensity is decreasing subject to G.T.I., implying that countries investing in G.T.I. mitigate the negative effect of energy intensity on progress toward G.G. Also, the marginal effect of F.D.I. on G.G. conditional to G.T.I. is decreasing, implying that the negative effect of F.D.I. on G.G. is decreasing with respect to G.T.I., implying that countries investing in G.T.I. and promoting environmental policies that facilitate G.T.I. minimize the pollution haven effects of F.D.I.
The results further imply that the marginal effect of energy intensity and F.D.I. on ecological footprint is conditional to G.T.I., providing evidence that promoting G.T.I. by developing new technologies, services, products, and business models that positively affect the environment and technological advancements in energy conservation and pollution prevention help mitigate the impact of energy intensity on E.S. in emerging economies and reduces pollution haven effects of F.D.I.
5. Discussions and policy implications
This study’s findings show that G.T.I. has a robust positive direct impact on G.G. and a negative effect on ecological footprint, providing evidence that G.T.I. promotes progress toward G.G. and E.S., which can contribute to attempts of the green revolution in emerging economies ( and ). Therefore, G.T.I. is an important driving factor in promoting the G.G. and E.S. as it can generate green technological progress and improve the allocation rate of resources in emerging economies.
These findings are consistent because most emerging economies are striving to expand G.T.I. For example, Chile and South Africa already have advanced green hydrogen strategies consistent with sustainable development (UNCTAD, Citation2022). Moreover, South Africa launched a green economy accord to promote energy efficiency, green products, and energy consumption. Also, Colombia, Mexico, Peru, and other emerging economies have developed green growth strategies and economy-environment interlinkages (Capozza & Samson, Citation2019). Therefore, G.T.I. is key to green growth in emerging economies. It helps them decouple economic growth from natural capital depletion, thus promoting G.G. and E.S.
The findings of this study support modern growth theories that suggest technological innovation positively influences G.G. (Acemoglu et al., Citation2016). Besides, these results are congruent with the results of Sohag et al. (Citation2021), Meiling et al. (Citation2020), Ahmad et al. (Citation2020), Erdoğan et al. (Citation2020) and Churchill et al. (Citation2019) that provide evidence of positive impacts of G.T.I. on progress toward G.G. Also, it could directly reduce pollutant emissions, thus meeting the requirements of E.S. In this regards, the findings are inline with the findings of Liguo et al. (Citation2022), Su et al. (Citation2022), Khattak and Ahmad (Citation2022a), Xin et al. (Citation2021) and Ahmad and Zheng (Citation2021) that found a negative relationship between CO2 emissions and green innovation. However, the results contradict the findings of Santra’s (Citation2017) claim that G.T.I. negatively affects G.G. and E.S. by increasing carbon emissions and will contribute to the depletion of ecological resources.
On the other hand, energy intensity has a significant negative effect on G.G. and E.S., implying that an increase in energy intensity adversely affects G.G. and E.S. in emerging economies. These findings are expected and in line with our hypothesis as the mix of energy sources is diverse across emerging economies, but fossil fuels generally dominate (Capozza & Samson, Citation2019). Also, the findings are congruent with the results of Sharma et al. (Citation2020). Besides, the findings imply that the adverse impact of energy intensity on G.G. and E.S. is weaker after we control for moderating role of G.T.I. on the impacts of energy intensity on G.G. and E.S., providing evidence that economies that promote environmental policies related to G.T.I. reduce the adverse impact of energy intensity via energy efficiency. In other words, policy actions and strategies promoting G.T.I. by developing new technologies and economic models that positively affect the technological advancements in energy efficiency help reduce energy intensity in emerging markets and contribute to G.G. and E.S. These findings, therefore, confirm that promoting G.T.I. improves G.G. and E.S. by moderating the effects of energy intensity on G.G. and E.S.; therefore, there is no energy rebound effect in emerging economies.
These findings are significant for emerging economies because energy efficiency is a critical strategy to speed up the green revolution. In these economies, energy efficiency investment often competes with other economic priorities (Haack et al., Citation2016) though it can offer an immense low-cost energy resource. Thus, G.T.I. can unlock its potential in emerging economies because energy savings can counterbalance two-thirds of energy requirements due to G.T.I. improvements (Tandon & Ahmed, Citation2016). For example, technological progress plays a positive role in improving energy efficiency in China (Chen et al., 2019), which other emerging economies replicate.
Our findings also support the neoclassical growth theory postulating that technological innovation can enhance energy efficiency. Therefore, improving energy efficiency through improving G.T.I. is the key measure emerging economies can take for energy conservation and emission reduction to improve E.S. and facilitate G.G.
Moreover, the effects of F.D.I. on G.G. and E.S. are negative and statistically significant, confirming the pollution haven hypothesis in emerging economies. This result can be loosely explained by the fact that competition among emerging economies to attract F.D.I. may relax environmental standards for foreign firms, thus encouraging firms in developed countries to move their pollution-intensive production to developing countries. It also can be argued that emerging economies’ growth benefits from globalization are attained at the cost of the environment because the economies adopt looser environmental standards, which is common in most emerging economies (Pao & Tsai, Citation2011). Thus, economic gains from F.D.I. could be offset by the adverse ecological effect of F.D.I. because it could easily be ignored because of the growth-promoting tendency of F.D.I. (Pao & Tsai, Citation2011).
Theoretically, our results support the negative of F.D.I., in the sense that increased F.D.I. inflows could lead to increased emissions (Shahbaz et al., Citation2015) because increased FDI may promote increased production and consumption by exploiting the environment and depleting natural resources. For example, China is frequently cited as an example of the connection between F.D.I. inflow and emissions (Demena & Afesorgbor, Citation2020). increase in F.D.I. and the subsequent high economic growth in China were accompanied by high industrial emissions, forcing China to develop green investment incentives to support firms investing in green assets. Lastly, the effects of the interaction term of G.T.I. and F.D.I. on G.G. and E.S. are positive and statistically significant, indicating that the negative effect of F.D.I. on G.G. and E.S. is decreasing subject to G.T.I., indicating that countries investing in G.T.I. minimize the pollution haven effects of F.D.I.
Therefore, this study will have several practical contributions to policymakers and governments in emerging economies. First, this study calls for a shift in the policy paradigm in emerging economies to more investment in G.T.I. to promote G.G. and E.S. Though most emerging economies have emphasised overall innovation as part of development strategies, G.T.I. has not been the primary focus and remains small (Capozza & Samson, Citation2019). Therefore, emerging economies should develop policies promoting G.T.I. to speed up the green revolution.
Second, energy efficiency is a fundamentally unexploited opportunity in emerging economies to promote G.G. and E.S. Therefore, emerging economies should emphasise improving energy efficiency through promoting G.T.I. and eco-friendly technologies. They should also implement energy efficiency regulations and promotion schemes. Thus, encouraging demand for energy efficiency technologies through public procurement policies which some emerging economies (for example, Turkey) have been implementing, is also worthwhile to speed up the pathway of the green revolution in emerging economies. Third, emerging economies need to support consumers to use energy-efficient products to control the negative effects of energy intensity on G.G. and E.S. Fourth, emerging economies should subsidise foreign firms investing in G.T.I. to mitigate the adverse effects of F.D.I. on G.G. and E.S. Besides, well-targeted policies should be formulated to attract F.D.I. that can contribute to G.G. and E.S. in emerging economies.
Finally, this study has some limitations. The findings of this study are based on the periods 1990–2018 because the latest updated year for ecological footprint is 2018 in the latest edition of G.F.N. Even though the period is sufficient to provide concrete findings, future works should include recent data during a volatile period which was and has been affected by COVID-19 and Russia-Ukraine war-induced geopolitical uncertainty. It is, also, worthwhile to investigate the impacts of G.T.I. on G.G. and E.S. using firm-level data.
Ethical statement
This manuscript does not contain any studies with human subject participation or animals engagements by any authors.
Data availability statement
The data used in this study are available from the corresponding author whenever requested.
Disclosure statement
No potential conflict of interest was reported by the author(s).
Additional information
Funding
Notes
1 List of countries: Argentina, Brazil, Bulgaria, Chile, China, Colombia, Egypt, Hungary, India, Indonesia, Iran, Malaysia, Mexico, Morocco, Pakistan, Peru, Philippines, Poland, Romania, Russia, Saudi Arabia, South Africa, Thailand, Turkey and Ukraine
References
- Acemoglu, D., Ufuk, A., Douglas, H., & Kerr, W. (2016). The transition to clean technology. Journal of Political Economy, 124(1), 52–104. https://doi.org/10.1086/684511
- Adebayo, T. S., Onifade, S. T., Alola, A. A., & Muoneke, O. B. (2022). Does it take international integration of natural resources to ascend the ladder of environmental quality in the newly industrialized countries? Resources Policy, 76, 102616. https://doi.org/10.1016/j.resourpol.2022.102616
- Ahmad, M., Jiang, P., Majeed, A., Umar, M., Khan, Z., & Muhammad, S. (2020). The dynamic impact of natural resources, technological innovations and economic growth on ecological footprint: An advanced panel data estimation. Resources Policy, 69, 101817. https://doi.org/10.1016/j.resourpol.2020.101817
- Ahmad, M., & Zheng, J. (2021). Do innovation in environmental-related technologies cyclically and asymmetrically affect environmental sustainability in BRICS nations? Technology in Society, 67, 101746. https://doi.org/10.1016/j.techsoc.2021.101746
- Anwar, A., Siddique, M., Dogan, E., & Sharif, A. (2021). The moderating role of renewable and non-renewable energy in environment-income nexus for ASEAN countries: Evidence from method of moments quantile regression. Renewable Energy. 164, 956–967. https://doi.org/10.1016/j.renene.2020.09.128
- Awan, U., Arnold, M. G., & Gölgeci, I. (2021). Enhancing green product and process innovation: Towards an integrative framework of knowledge acquisition and environmental investment. Business Strategy and the Environment, 30(2), 1283–1295. https://doi.org/10.1002/bse.2684
- Bilgen, S. (2014). Structure and environmental impact of global energy consumption. Renewable and Sustainable Energy Reviews, 38, 890–902. https://doi.org/10.1016/j.rser.2014.07.004
- Capozza, I., & Samson, R. (2019). Towards green growth in Emerging market economies: Evidence from environmental performance reviews (O.E.C.D. Green growth Papers No. 2019-01). O.E.C.D. Publishing.
- Chen, W., Huang, X., Liu, Y., Luan, X., & Song, Y. (2019). The impact of high-tech industry agglomeration on green economy efficiency-evidence from the Yangtze River economic belt. Sustainability, 11, 5189. https://doi.org/10.3390/su11195189
- Churchill, S. A., Inekwe, J., Smyth, R., & Zhang, X. (2019). R&D intensity and carbon emissions in the G7: 1870–2014. Energy Economics, 80, 30–37. https://doi.org/10.1016/j.eneco.2018.12.020
- Cole, M. (2004). Trade, the pollution haven hypothesis and the environmental Kuznets curve: Examining the linkages. Ecological Economics, 48(1), 71–81. https://doi.org/10.1016/j.ecolecon.2003.09.007
- Demena, B. A., & Afesorgbor, S. K. (2020). The effect of FDI on environmental emissions: Evidence from a meta-analysis. Energy Policy, 138, 111192. https://doi.org/10.1016/j.enpol.2019.111192
- Demiral, M., & Demiral, O. (2021). Where is the gray side of green growth? Theoretical insights, policy directions, and evidence from a multidimensional approach. Environmental Science and Pollution Research International, 28(45), 63905–63930. https://doi.org/10.1007/s11356-021-13127-x
- Ding, Q., Khattak, S. I., & Ahmad, M. (2021). Towards sustainable production and consumption: Assessing the impact of energy productivity and eco-innovation on consumption-based carbon dioxide emissions (CCO2) in G-7 nations. Sustainable Production and Consumption, 27, 254–268. https://doi.org/10.1016/j.spc.2020.11.004
- Erdoğan, S., Yıldırım, S., Yıldırım, D. C., & Gedikli, A. (2020). The effects of innovation on sectoral carbon emissions: Evidence from G20 countries. Journal of Environmental Management, 267, 110637. https://doi.org/10.1016/j.jenvman.2020.110637
- Fernandes, C. I., Veiga, P. M., Ferreira, J. J. M., & Hughes, M. (2021). Green growth versus economic growth: Do sustainable technology transfer and innovations lead to an imperfect choice? Business Strategy and the Environment, 30(4), 2021–2037. https://doi.org/10.1002/bse.2730
- Fisher-Vanden, K., Jefferson, G. H., Jingkui, M., & Jianyi, X. (2006). Technology development and energy productivity in China. Energy Economics, 28(5–6), 690–705. https://doi.org/10.1016/j.eneco.2006.05.006
- Fu, H., Huang, P., Xu, Y., & Zhang, Z. (2022). Digital trade and environmental sustainability: The role of financial development and ecological innovation for a greener revolution in China. Economic Research-Ekonomska Istraživanja. https://doi.org/10.1080/1331677X.2022.2125889
- Galeotti, M., Salini, S., & Verdolini, E. (2020). Measuring environmental policy stringency: Approaches, validity, and impact on environmental innovation and energy efficiency. Energy Policy, 136, 111052. https://doi.org/10.1016/j.enpol.2019.111052
- GFN. (2019). Ecological footprint. https://www.footprintnetwork.org/our-work/ecological-footprint/.
- Haack, C., Khan, H., & Khan, A. (2016). Getting attention for energy efficiency in Emerging markets. ACEEE. https://www.aceee.org/files/proceedings/2016/data/papers/4_321.pdf
- Huang, X., Huang, X., Chen, M., & Sohail, S. (2022). Fiscal spending and green economic growth: Fresh evidence from high polluted Asian economies. Economic Research-Ekonomska Istraživanja, 35(1), 5502–5513. https://doi.org/10.1080/1331677X.2022.2029714
- Huber, J. (2000). Towards industrial ecology: Sustainable development as a concept of ecological modernization. Journal of Environmental Policy & Planning, 2(4), 269–285. https://doi.org/10.1080/714038561
- Ibrahim, R. L., & Ajide, K. B. (2021). Non-renewable and renewable energy consumption, trade openness, and environmental quality in G-7 countries: The conditional role of technological progress. Environmental Science and Pollution Research, 28(33), 45212–45229.
- IEA. (2022). Energy efficiency in Emerging economies. https://www.iea.org/programmes/energy-efficiency-in-emerging-economies.
- Im, K. S., Pesaran, M. H., & Shin, Y. (2003). Testing for unit roots in heterogeneous panels. Journal of Econometrics, 115(1), 53–74. https://doi.org/10.1016/S0304-4076(03)00092-7
- Jian, X., & Afshan, S. (2022). Dynamic effect of green financing and green technology innovation on carbon neutrality in G10 countries: Fresh insights from CS-ARDL approach. Economic Research-Ekonomska Istraživanja. https://doi.org/10.1080/1331677X.2022.2130389
- Khattak, S. I., & Ahmad, M. (2022a). The cyclical impact of innovation in green and sustainable technologies on carbon dioxide emissions in OECD economies. Environmental Science and Pollution Research International, 29(22), 33809–33825. https://doi.org/10.1007/s11356-022-18577-5
- Khattak, S. I., & Ahmad, M. (2022b). The cyclical impact of green and sustainable technology research on carbon dioxide emissions in BRICS economies. Environmental Science and Pollution Research International, 29(15), 22687–22707. https://doi.org/10.1007/s11356-021-17368-8
- Khattak, S. I., Ahmad, M., Khan, Z. U., & Khan, A. (2020). Exploring the impact of innovation, renewable energy consumption, and income on CO2 emissions: New evidence from the BRICS economies. Environmental Science and Pollution Research International, 27(12), 13866–13881. https://doi.org/10.1007/s11356-020-07876-4
- Khattak, S. I., Ahmad, M., Ul Haq, Z., Shaofu, G., & Hang, J. (2022). On the goals of sustainable production and the conditions of environmental sustainability: Does cyclical innovation in green and sustainable technologies determine carbon dioxide emissions in G-7 economies? Sustainable Production and Consumption, 29, 406–420. https://doi.org/10.1016/j.spc.2021.10.022
- Liguo, X., Ahmad, M., & Khattak, S. I. (2022). Impact of innovation in marine energy generation, distribution, or transmission-related technologies on carbon dioxide emissions in the United States. Renewable and Sustainable Energy Reviews, 159, 112225. https://doi.org/10.1016/j.rser.2022.112225
- Lin, B., & Chen, Z. (2018). Does factor market distortion inhibit the green total factor productivity in China? Journal of Cleaner Production, 197, 25–33. https://doi.org/10.1016/j.jclepro.2018.06.094
- Lin, B., & Wang, S. (2019). From catch-up to transcend: The development of Emerging countries’ green economy. Mathematical Problems in Engineering, 2019, 1481946. https://doi.org/10.1155/2019/1481946
- Liu, Y. Q., Zhu, J. J., Li, E. Y., Meng, Z. Y., & Song, Y. (2020). Environmental regulation, green technological innovation, and eco-efficiency: The case of Yangtze river economic belt in China. Technological Forecasting and Social Change, 155, 119993. https://doi.org/10.1016/j.techfore.2020.119993
- Meiling, W., Silu, P., Ikram, H., Ilham, H., Cunfang, L., & Zhengxia, H. (2020). Towards sustainable development: How does technological innovation drive the increase in green total factor productivity? Sustainable Development, 29(1), 217–227. https://doi.org/10.1002/sd.2142
- Mol, A. P., & Sonnenfeld, D. A. (2000). Ecological modernization around the world: An introduction. Environmental Politics, 9(1), 1–14. https://doi.org/10.1080/09644010008414510
- Nosheen, M., Iqbal, J., & Abbasi, M. A. (2021). Do technological innovations promote green growth in the European Union? Environmental Science and Pollution Research International, 28(17), 21717–21729. https://doi.org/10.1007/s11356-020-11926-2
- OECD. (2017). Green growth indicators, OECD green growth studies. OECD Publishing. https://doi.org/10.1787/9789264268586-en
- Ozcan, B. (2013). The nexus between carbon emissions, energy consumption and economic growth in Middle East countries: A panel data analysis. Energy Policy, 62, 1138–1147. https://doi.org/10.1016/j.enpol.2013.07.016
- Ozturk, I., Aslan, A., & Altinoz, B. (2022). Investigating the nexus between CO2 emissions, economic growth, energy consumption and pilgrimage tourism in Saudi Arabia. Economic Research-Ekonomska Istraživanja, 35(1), 3083–3098. https://doi.org/10.1080/1331677X.2021.1985577
- Ozturk, I., & Uddin, G. S. (2012). Causality among carbon emissions, energy consumption and growth in India. Economic Research-Ekonomska Istraživanja, 25(3), 752–775. https://doi.org/10.1080/1331677X.2012.11517532
- Pao, H.-T., & Tsai, C.-M. (2011). Multivariate granger causality between CO2 emissions, energy consumption, FDI (foreign direct investment) and GDP (gross domestic product): Evidence from a panel of BRIC (Brazil, Russian Federation, India, and China) countries. Energy, 36(1), 685–693. https://doi.org/10.1016/j.energy.2010.09.041
- Pedroni, P. (2001). Purchasing power parity tests in co-integrated panels. Review of Economics and Statistics, 83(4), 727–731. https://doi.org/10.1162/003465301753237803
- Pesaran, M. H., Shin, Y., & Smith, R. P. (1999). Pooled mean group estimation of dynamic heterogeneous panels. Journal of the American Statistical Association, 94(446), 621–634. https://doi.org/10.1080/01621459.1999.10474156
- Popp, D. (2012). The role of technological change in green growth. The World Bank.
- Qin, M., Su, C.-W., Zhong, Y., Song, Y., & Lobonț, O.-R. (2022). Sustainable finance and renewable energy: Promoters of carbon neutrality in the United States. Journal of Environmental Management, 324, 116390. https://doi.org/10.1016/j.jenvman.2022.116390
- Santra, S. (2017). The effect of technological innovation on production based energy and CO2 emission productivity: Evidence from BRICS countries. African Journal of Science, Technology, Innovation and Development, 9(5), 503–512. https://doi.org/10.1080/20421338.2017.1308069
- Shahbaz, M., Nasreen, S., Abbas, F., & Anis, O. (2015). Does foreign direct investment impede environmental quality in high-, middle-, and low-income countries? Energy Economics, 51, 275–287. https://doi.org/10.1016/j.eneco.2015.06.014
- Sharma, R., Sinha, A., & Kautish, P. (2020). Does renewable energy consumption reduce ecological footprint? Evidence from eight developing countries of Asia. Journal of Cleaner Production, 285, 124867.
- Sohag, K., Husain, S., Hammoudeh, S., & Omar, N. (2021). Innovation, militarization, and renewable energy and green growth in O.E.C.D. countries. Environmental Science and Pollution Research International, 28(27), 36004–36017. https://doi.org/10.1007/s11356-021-13326-6
- Solow, R. M. (1974). The economics of resources or the resources of economics. American Economic Review, 64, 1–14.
- Su, C.-W., Li, W., Umar, M., & Lobonţ, O.-R. (2022). Can green credit reduce the emissions of pollutants? Economic Analysis and Policy, 74, 205–219. https://doi.org/10.1016/j.eap.2022.01.016
- Su, C.-W., Pang, L.-D., Tao, R., Shao, X., & Umar, M. (2022). Renewable energy and technological innovation: Which one is the winner in promoting net-zero emissions? Technological Forecasting and Social Change, 182, 121798. https://doi.org/10.1016/j.techfore.2022.121798
- Tandon, A., & Ahmed, S. (2016). Technological change and energy consumption in India: A decomposition analysis. Innovation and Development, 6(1), 141–159. https://doi.org/10.1080/2157930X.2015.1114565
- Tao, R., Su, C.-W., Naqvi, B., & Rizvi, S. K. A. (2022). Can Fintech development pave the way for a transition towards low-carbon economy: A global perspective. Technological Forecasting and Social Change, 174, 121278. https://doi.org/10.1016/j.techfore.2021.121278
- UNCTAD. (2022). How developing countries can seize ‘green windows of opportunity’ with innovative technologies. https://unctad.org/news/how-developing-countries-can-seize-green-windows-opportunity-innovative-technologies.
- Wackernagel, M., & Rees, W. E. (1996). Our ecological footprint: Reducing human impact on the earth. New Society Publishers.
- Wang, Q., Wang, L., & Li, R. (2022). Does the energy transition alleviate environmental degradation? Evidence from the high income, upper and lower middle income economies. Energy Strategy Reviews, 44, 100966. https://doi.org/10.1016/j.esr.2022.100966
- Wang, H., & Wei, W. (2020). Coordinating technological progress and environmental regulation in CO2 mitigation: The optimal levels for O.E.C.D. countries & emerging economies. Energy Economics, 87, 104510. https://doi.org/10.1016/j.eneco.2019.104510
- Wang, S., Zeng, J., & Liu, X. (2019). Examining the multiple impacts of technological progress on CO2 emissions in China: A panel quantile regression approach. Renewable and Sustainable Energy Reviews, 103, 140–150. https://doi.org/10.1016/j.rser.2018.12.046
- Waqih, M. A. I., Bhutto, N. A., Ghumro, N. H., Kumar, S., & Salam, M. A. (2019). Rising environmental degradation and impact of foreign direct investment: An empirical evidence from S.A.A.R.C. Journal of Environmental Management, 243, 472–480.
- Weimin, Z., Chishti, M. Z., Rehman, A., & Ahmad, M. (2022). A pathway toward future sustainability: Assessing the influence of innovation shocks on CO2 emissions in developing economies. Environment, Development and Sustainability, 24(4), 4786–4809. https://doi.org/10.1007/s10668-021-01634-3
- Westerlund, J. (2007). Testing for error correction in panel data. Oxford Bulletin of Economics and Statistics, 69(6), 709–748. https://doi.org/10.1111/j.1468-0084.2007.00477.x
- Wolf, M. J., Emerson, J. W., Esty, D. C., de Sherbinin, A., & Wendling, Z. A. (2022). 2022 Environmental performance index. Yale Center for Environmental Law & Policy.
- Xie, Q., & Sun, Q. (2020). Assessing the impact of FDI on PM2.5 concentrations: A nonlinear panel data analysis for emerging economies. Environmental Impact Assessment Review, 80, 106314. https://doi.org/10.1016/j.eiar.2019.106314
- Xin, D., Ahmad, M., Lei, H., & Khattak, S. I. (2021). Do innovation in environmental-related technologies asymmetrically affect carbon dioxide emissions in the United States? Technology in Society, 67, 101761. https://doi.org/10.1016/j.techsoc.2021.101761
- Xu, S., & Li, Z. (2021). The impact of innovation activities, foreign direct investment on improved green productivity: Evidence from developing countries. Frontiers in Environmental Science, 9, 635261. https://doi.org/10.3389/fenvs.2021.635261
- Yarimoglu, E., & Binboga, G. (2019). Understanding sustainable consumption in an emerging country: The antecedents and consequences of the ecologically conscious consumer behavior model. Business Strategy and the Environment, 28(4), 642–651. https://doi.org/10.1002/bse.2270
- Yilanci, V., Ozgur, O., & Sehid, M. (2019). The asymmetric effects of foreign direct investment on clean energy consumption in BRICS countries: A recently introduced hidden cointegration test. Journal of Cleaner Production, 237, 117786. https://doi.org/10.1016/j.jclepro.2019.117786
- You, C., Khattak, S. I., & Ahmad, M. (2022a). Impact of innovation in renewable energy generation, transmission, or distribution-related technologies on carbon dioxide emission in the U.S.A. Environmental Science and Pollution Research International, 29(20), 29756–29777. https://doi.org/10.1007/s11356-021-17938-w
- You, C., Khattak, S. I., & Ahmad, M. (2022b). Do international collaborations in environmental-related technology development in the U.S. pay off in combating carbon dioxide emissions? Role of domestic environmental innovation, renewable energy consumption, and trade openness. Environmental Science and Pollution Research International, 29(13), 19693–19713. https://doi.org/10.1007/s11356-021-17146-6
- Zhang, C., & Lin, Y. (2012). Panel estimation for urbanization, energy consumption and CO2 emissions: A regional analysis in China. Energy Policy, 49, 488–498. https://doi.org/10.1016/j.enpol.2012.06.048
Appendix A
Figure A1. Economic growth pattern. Source: Calculated by authors from W.D.I. indicators.
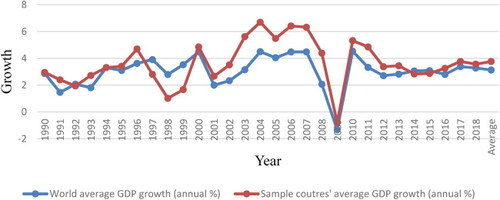
Figure A2. CO2 emissions. Source: Calculated by authors from W.D.I. indicators.
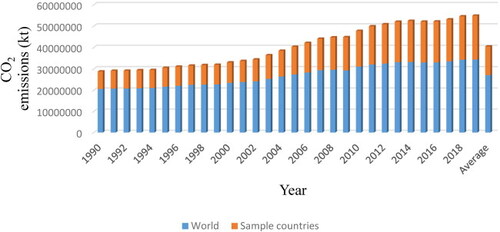
Figure A3. Ecological footprint. Source: Calculated by authors from G.F.N. data.
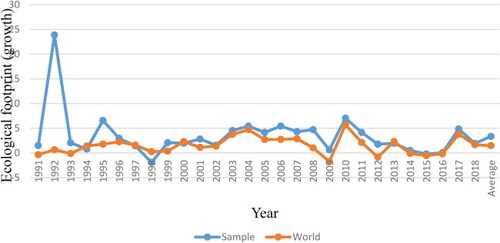
Figure A4. Renewable energy share growth. Source: Calculated by authors from W.D.I. indicators.
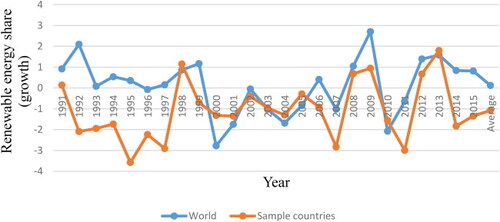
Figure A5. Net F.D.I. inflow. Source: Calculated by authors from W.D.I. indicator.
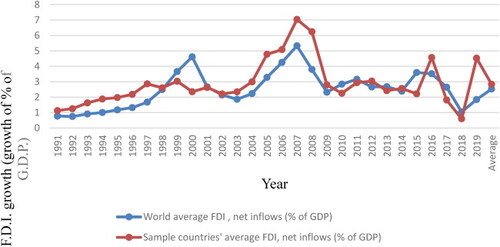
Figure A6. The growth rate of G.G. Source: Calculated by authors from O.E.C.D data.