
 ?Mathematical formulae have been encoded as MathML and are displayed in this HTML version using MathJax in order to improve their display. Uncheck the box to turn MathJax off. This feature requires Javascript. Click on a formula to zoom.
Abstract
In light of a scarcity of research on the spatial effects of urbanization on poverty reduction, this study uses panel data on 30 provinces in China from 2009 to 2019 to construct a system of indices to assess poverty that spans the four dimensions of the economy, education, health, and living. We use the spatial autocorrelation test and the spatial Durbin model (SDM) to analyze the spatial effects of urbanization on poverty reduction in these different dimensions. The main conclusions are as follows: (a) China’s urbanization has the characteristics of spatial aggregation and a spatial spillover effect. (b) Different dimensions of poverty had the attributes of spatial agglomeration, and Moran’s index of a reduction in economic poverty was the highest. Under the SDM, the different dimensions of poverty also showed a significant positive spatial correlation. (c) Urbanization has a significant effect on poverty reduction along the dimensions of the economy, education, and living, but has little effect on reducing health poverty. It has a spatial spillover effect on poverty reduction in economic and living contexts. (d) There were spatial differences in the effect of urbanization on relieving economic and living-related poverty.
1. Introduction
Urbanization and rural poverty are essential worldwide issues (Arouri et al., Citation2017; Ravallion et al., Citation2007). The modern history of humankind is not only one of urbanization but also the history of the continual struggle against poverty. After World War II, the global anti-poverty movement progressed under a United Nations-led cooperation framework. Although impressive progress has been made in reducing extreme poverty since then, 1.3 billion people still live in multidimensional poverty in 107 developing countries of the world (United Nations, Citation2015). The outbreak of the COVID-19 pandemic may have set back the world’s progress in tackling multidimensional poverty by 3 to 10 years. Reducing multidimensional poverty, therefore, remains a top priority in achieving the United Nations’ 2030 agenda for its Sustainable Development Goals (OPHI, Citation2020). Urbanization is speeding up globally, scale economies and agglomeration economies have been encouraged, leading to tremendous economic development and job prospects. Thus, urbanization has emerged as a significant factor in the fight against poverty (Awan et al., Citation2011; Shahbaz et al., Citation2010).
As the largest developing country in the world, China has undergone a process of urbanization that is unprecedented in human history. Implementing a sustainable policy of urbanization is essential to reduce poverty in China. The country’s rate of urbanization has risen from 17.92% in 1978 to 60.60% in 2019, an average annual growth rate of 1.04% which is much higher than the world average for the same period (Yu, Citation2021). Joseph Stiglitz, the Nobel Prize-winning economist, has argued that urbanization in China is one of the two key influences on human development in the 21st century (Bloomberg News, Citation2012). In the same period, the number of poor people in China decreased from 770 million in 1978 to 5.51 million in 2019. China’s absolute poverty was eliminated in 2020, achieving 10 years ahead of schedule the United Nations’ 2030 Agenda for Sustainable Development goal of reducing poverty. Thus, China has significantly contributed to global poverty reduction, human development, and progress (Xinhua News, Citation2021).
The Chinese government has long acknowledged the role of urbanization in poverty reduction. In 2011, the government issued the China Rural Poverty Alleviation and Development Program (2011–2020), which explicitly stated that poverty alleviation should be combined with urbanization. In 2014, the Chinese government formulated the National New-type Urbanization Plan (2014–2020), which recognized urbanization as a necessary step in addressing the problems of rural poverty, and claimed that the promotion of urban economic strength could enhance the ability to drive rural areas while promoting economic and social development in them. In 2018, the administration released guiding opinions on a three-year campaign to win the battle against poverty. It emphasized the vital role of the area of urban and rural construction land, allocation of educational resources, medical security, social welfare, and centralized population resettlement to reduce poverty. The 2021 Central Document No.1 emphasizes the role of small towns in connecting cities and rural areas.
China cannot get rid of poverty on time without a sustained and continuous urbanization policy. In addition, the trade-off between urbanization and reduce poverty quickly establishes an understanding of their relationship and prompts the following inquiries: (1) Does urbanization contribute to rural poverty reduction? (2) What is the impact of urbanization on rural poverty reduction? The first question has been extensively examined in the relevant research (Henderson, Citation2010; Yacob et al., Citation2017), but the second question has not been considered as thoroughly. Research on the spatial spillover effect of urbanization on poverty reduction is lacking in the literature. This study aims to fill this gap. This paper analyzes the effects of urbanization on multidimensional poverty reduction from the perspectives of the economy, education, health, and living and explores its corresponding mechanism of action, which reveals to a certain extent the characteristics and trends of urbanization on rural poverty reduction, can enrich the research in related fields, while taking rural China as the research object has strong practical significance, and can provide a basis for international governments to formulate relevant poverty alleviation policies. It plays a positive role in promoting the development of global poverty reduction.
The remainder of this article is organized as follows. Section 2 briefly reviews research on the relationship between urbanization and poverty reduction and notes the gaps in current research. Section 3 introduces the methods and data sources used in this study. In Section 4, we report the results of our empirical analysis. In Section 5, the results are discussed, the study’s conclusions are summarized, and policy suggestions are made.
2. Literature review
2.1. The multiple dimensions of poverty
Traditional poverty generally refers to material hardship whereby a person or family does not meet the minimum socially acceptable living standards. However, the international community has come to realize that poverty is not only about material deprivation but also about low levels of education, poor health, and vulnerability to external shocks. Since Sen (1981) first put forward the concept of ‘multidimensional poverty’, poverty has gained wider acceptance as a multidimensional notion (Betti et al., Citation2015; Bourguignon & Chakravarty, Citation1998). The Human Development Index, the Human Poverty Index, and the Multidimensional Poverty Index (MPI) published by the World Bank all reflect this idea by Sen (Citation1999). The United Nations Development Programme and the Oxford Poverty & Human Development Initiative (OPHI) have used the multidimensional poverty index to measure poverty in developing countries. Their reports have been published annually since 2010 (United Nations, 2010).
Hanandita et al. (2015), based on the poverty dimensions and evaluation indicators used by the United Nations Multidimensional Poverty Index, selected five indicators (such as per capita daily consumption, illness episode, and so on) from the three dimensions of Income, Health, and Education to represent the multidimensional poverty situation in Indonesia. Liu and Yong (Citation2016) used the sustainable livelihoods approach to measure multidimensional poverty by constructing an index system of poverty in five dimensions: financial capital, human capital, natural capital, physical capital, and social capital. Alkire (2017), according to the United Nations Multidimensional Poverty Index (MPI) of dimensions of poverty and evaluation indicators, selected ten indicators (such as Years of Schooling, Child Mortality, Nutrition, Improved Drinking Water, and so on) from three dimensions of education, health, living standards to measure the multidimensional poverty situation in Armenia, Bangladesh, and other 32 countries. Foster et al. (Citation1984) developed the Foster–Greer–Thorbecke (FGT) index to measure multidimensional poverty, and Alkire and Foster (Citation2011) designed the A-F method to measure multidimensional poverty that has since been widely used. Li et al. (Citation2019) used principal component analysis to explore the spatial and temporal patterns of multidimensional poverty in rural China. Liu et al. (Citation2021) used multiple linear regression and the stochastic forest model to figure out what causes poverty in China’s rural areas.
2.2. Impact of urbanization on poverty reduction
Urbanization is the process of gradually converging a region’s labor, physical, human, and technical capitals. The development of urbanization has a direct and far-reaching impact on rural poverty (Lewis, Citation1954). This paper analyzes the mechanism of the impact of urbanization on multidimensional poverty in rural areas from four aspects: economic poverty, educational poverty, health poverty, and living poverty (). From a financial point of view, urbanization promotes the non-agriculturalization of the rural economy. Urbanization can help create an industrial agglomeration economy, improve agricultural productivity, create a significant employment demand, lower production costs, and promote economic growth by facilitating the gradual transfer of production factors among the three major industries in the entire region. Additionally, the flow of population, economy, and information technology in the urbanization process will change the supply of agricultural products, thus disguising higher prices for agricultural products, higher income for farmers, and lower incidence of rural poverty (Kuznets, Citation1955).
Figure 1. Schematic diagram of the mechanism of multidimensional poverty reduction effect of Urbanization.
Source: drawn by authors.
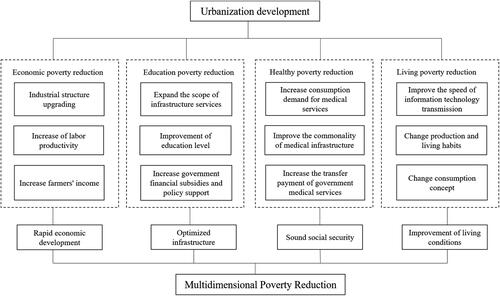
From the perspective of education, the development of urbanization can promote the expansion of regional education infrastructure services, while the corresponding policies formulated by the government improve the level of sharing of education infrastructure and help some farmers to access urban education, thus increasing the proportion of the rural population receiving advanced education, raising the standard of education, and helping urban workers to improve their income and escape from poverty at the root. In addition, if the government sets up the right technical schools, training centers, and hardware and software facilities, it can help workers improve their quality, increase their production skills, and get technical knowledge to help farmers who move to cities to work to get out of poverty (Ge et al., Citation2020; Lanjouw & Murgai, Citation2010).
From the perspective of health, as urbanization progresses, the optimization of industrial structure can promote rural economic development and the growth of farmers’ income level, which will increase farmers’ consumption demand for medical services, promote the development of a rural medical service market, and alleviate rural medical poverty. Likewise, as urban residents and enterprises continue to gather, the shared cost of urban inputs for production and consumption gradually decreases, and the shared nature of medical infrastructure construction not only improves the quality of life of residents working in the city but also significantly reduces the cost of production and living, thereby lowering the incidence of poverty among farmers. In addition, the development of the economic level can increase government revenue, and the government will also increase transfer payments to rural medical services, thus improving the level of rural medical services and promoting rural medical poverty reduction (Henderson, Citation2010).
From the perspective of life, the continuous promotion of urbanization will promote the transfer of cutting-edge knowledge and technology from cities to rural areas, subconsciously changing the production and living habits of rural areas and the consumption concepts of rural people. The improvement of rural roads, full network coverage, and other infrastructures will make rural areas have wider access to advanced urban technology and information, and rural areas will continue to optimize their industrial structure and improve labor productivity by taking the initiative to absorb all kinds of advanced knowledge and technology from cities. Modernized agricultural business concepts and urbanized rural consumption habits will attract the excellent human capital from cities, which will help modernize rural production and life and help rural people get out of poverty (Yacob et al., Citation2017).
However, many academics have claimed that urbanization has aggravated the imbalance in development between urban and rural areas: Urbanization leads to a loss of the factors of production, lack of development power, and imperfect supporting services and facilities in poor areas (Ge et al., Citation2016). Martinez-Vazquez et al. (Citation2009) identified a U-shaped relationship between urbanization and poverty: That is, the early stage of urbanization was conducive to poverty reduction, but its later stage enhances poverty. Long et al. (Citation2016) have argued that the outflow of rural human resources inevitably leads to the concentration of other elements of production and public resources in urban areas and inhibits the developmental ability of poor areas through polarization. At the same time, if the links between urban and rural economies are inadequate, the backward linkages of urbanization and its spillover effects on rural areas are negligible, and thus the transfer of rural labor and the impact of remittances on reducing rural poverty is limited (Azam & Gubert, Citation2006; Ge et al.,Citation2016).
As Tobler’s first law of geography states, ‘everything is related to everything else, but near things are more related to each other’ (Tobler, Citation1970). Incorrect results result from disregarding the spatial influence of key variables if they are spatially correlated (Anselin, Citation1988). Therefore, the impact of space has been highlighted in several studies on urbanization and poverty reduction. Ravallion et al. (Citation2007) found that urbanization has a positive effect on reducing absolute poverty but noted regional differences in the effect of poverty reduction. Cali and Menon (2013) found that urbanization has a positive spillover effect on rural poverty, including consumer linkages, rural-urban remittances, non-farming employment, and changing the rural land/labor ratio. Arouri et al. (Citation2017) investigated the link between urbanization and poverty in Vietnam. They found that urbanization had increased the income and spending of poor rural households and given them better access to public infrastructure like running water, healthcare, and electricity.
The majority of studies on the effects of urbanization on poverty reduction have utilized independent and homogeneous individuals as research units and have assumed that there is no spatial autocorrelation between the interfering items. However, poverty is multidimensional and impacted by a variety of factors, and its emergence often transcends regional boundaries. Simultaneously, spatial auto-correction also appears during urbanization (Nordhaus, Citation2006; Liu & Liu, Citation2019), implying that urbanization influences poverty reduction in surrounding regions and impacts rural poverty reduction in the given region. This is referred to as the spatial spillover effect. Because of this, we use provincial panel data on China, Moran’s I, and the SDM to explore the spatial characteristics and spatial spillover effects of urbanization on poverty reduction along different dimensions.
Source: Self drawn by the author.
3. Methods and data
3.1. Methods
3.1.1. Spatial autocorrelation
Spatial correlation is used to determine whether neighborhood regions variables with similar values. To verify the spatial characteristics of the rate of urbanization, economic poverty, educational poverty, health poverty, and living poverty among the provinces considered to determine whether there is a correlation among them, we use the global Moran’s I. Global autocorrelation estimates the statistical significance of a given index by calculating the values of I, Z, and P in Moran’s index. The range of values of I is −1 ∼ 1: The higher the absolute value is, the greater the spatial correlation is (Moran, Citation1950). The formula for it is as follows:
(1)
(1)
In this formula, is the weighted matrix that represents the spatial weights of I and j,
is the sample value at i, n is the observed value, and
is the sum of spatial weights.
The significance of the spatial autocorrelation of the global Moran’s I can be tested by using the normalized statistic Z(I):
(2)
(2)
is the theoretically expected value of Moran’s I and Var(I) is its theoretical variance.
3.1.2. The spatial panel model
The spatial panel model was proposed by Anselin et al. (Citation1997). It was developed further by researchers including Baltagi and Li (Citation2000). The general model for spatial measurements is as follows:
(3)
(3)
In this formula, represents different provinces,
represents time in years,
represents the variable representing the level of rural poverty,
is a constant,
represents the spatial lag term of the explanatory variable, ρ represents the coefficient of the lag term,
represents the explanatory variable,
represents the spatial lag of the explanatory variable,
represents the coefficient of spatial lag,
represents a spatial weight matrix,
represents the spatial lag in disturbance,
represents the coefficient of the lag in disturbance,
represents the regional fixed effect, and
represents the fixed effect of time.
(0, σ2).
The spatial Durbin model (SDM) is obtained when λ = 0. When λ = 0 and δ = 0, a spatial lag model (SLM) is obtained. This is mainly used to investigate the spatial interaction among explanatory variables in areas adjacent to a given area. When =0 and δ = 0, the spatial error model (SEM) is obtained. It reflects the spatial correlation between neighboring regions through an error perturbation term. Because the SDM combines the characteristics of the spatial autoregressive model (SAM) and the spatial error model (SEM), it not only makes the treatment of spatial heterogeneity and uncertainty more effective but also reflects the spatial spillover effect of the explanatory variables (Elhorst, Citation2014). We use the SDM as an empirical model because of how well it works with spatial data.
3.1.3. Decomposition of spatial effect
According to Lesage and Pace (Citation2009), it is inaccurate to measure the influence of the explanatory variables (on the explained variables) only by using the estimation coefficient of the former due to the effects of spatial spillover effect and time following the introduction of the dynamic spatial panel model to the lag term. It is necessary to decompose impacts into direct and indirect effects. This can be done by partial differential decomposition. Its main steps are shown in (Liu & Liu, Citation2019; Liu et al., Citation2019).
3.1.4. Setting spatial weights
Before spatial econometric analysis, it is necessary to design a spatial weight matrix to define the adjacency of spatial objects. The design of the spatial weight matrix is a vital and challenging task in spatial economics. The 0-1 adjacency weight matrix constructed by Moran (Citation1948) reflects the spatial correlation between regions. If there is a common boundary between regions, its value is one and is otherwise zero, and the diagonal elements of the matrix are all zero. However, the weight matrix cannot reflect the economic and social relations among provinces. In this paper, we construct a weight matrix of economic distances and a nested matrix for each province according to work by Hao et al. (Citation2021) and Xue et al. (Citation2021). The nested spatial weight matrix is obtained by multiplying the adjacency matrix with the weight matrix for economic distance. The nested matrix can reflect the spatial characteristics of neighboring provinces as well as the degree of economic interdependence among provinces. The matrix wij is derived as shown in and is standardized.
Table 1. Description of the weight matrix.
3.2. Description of variables and data sources
3.2.1. Variables
The variables used in this paper can be divided into three parts: explained variables, core explanatory variables, and control variables.
(1) The explained variables
The UNDP has proposed a global system of indices to assess poverty that includes three dimensions: health, education, and living standard (Alkire & Foster, Citation2011). Combined with the general goal of ‘Two Guarantee, Three Ensuring’ put forward in the Outline of China’s Rural Poverty Alleviation and Development 2011–2020, which describes poverty in China’s poor areas in light of the relevant data (Zhang et al., Citation2020), this study chose the four dimensions of the poverty of economy, education, health, and living (). Economic poverty can be represented by the per capita disposable income of rural residents (X1), per capita expenditure on consumption (X2), and the rural Engel’s coefficient (X3), which is a negative indicator (Dong et al., Citation2021; Liu et al., Citation2021; Zhu et al., Citation2019). Dong et al. (Citation2021), Yao et al. (Citation2021), and WanG et al. (Citation2020) have claimed that educational poverty can be represented by three indicators: the illiteracy rate (X4), expenditure on education (X5), and the cultural quality of the labor force (X6). We use these indicators as well. Of them, the illiteracy rate is a negative indicator. Health poverty reflects the state of medical and health-related conditions of the people. Following Dong et al. (Citation2021), Gao and Sun (Citation2020), Liu et al. (Citation2019), Chen et al. (Citation2017), and He et al. (Citation2019), we use the number of beds per 1,000 people in medical and health institutions (X7), per capita expenditure on public health (X8), the total social dependency ratio (X9), and the minimum living standard (X10) to represent health poverty. All these indicators are positive. Living in poverty reflects the quality of life. We combine the poverty reduction indices proposed by Liu et al. (Citation2021), Ambel et al. (Citation2020), and WanG et al. (Citation2020) with the situation in rural China to use the rural per capita electricity consumption (X11), motorcycle ownership per 100 households (X12), rural residential investment (X13), the proportion of farmers using tap water (X14), toilet penetration rate (X15), and the comprehensive population coverage of rural radio programs (X16) to measure living poverty.
Table 2. System of indices to assess multidimensional poverty alleviation.
The entropy method is an objective method of assignment used to determine weights by comparing the correlation coefficients or the different degrees of the given indices. It can reduce the subjective influence in determining the weight. The rate of change in the sample data is reflected by calculating the informational entropy, and the consequences are determined according to each index’s degree of order of information. This is used to calculate a total score. The steps of calculation are as follows:
① Standardize the data:
(4)
(4)
(5)
(5)
where Xij is the initial value and X'ij is the standardized value.
is the value of index j of the given province in the above formula. For convenience, it is still recorded as
=
② Calculate the proportion of province i in index j:
(6)
(6)
③ Calculate the entropy of index j:
(7)
(7)
④ Calculate the difference coefficient of index j (Liu et al., Citation2021):
(8)
(8)
⑤ Calculate the weight:
(9)
(9)
⑥ Calculate the total score:
(10)
(10)
(2) The core variable.
The core explanatory variable used in this paper is the level of urbanization (Urban), which is measured by the ratio of the urban population to the total population of each region, that is, the rate of urbanization (Zhou et al., Citation2020). The rate of urbanization of the population can reflect the aggregation of labor-related factors that impact the economic, educational, health, and living-related aspects of everyday life. Therefore, the index of population flow can appropriately reflect the level of urbanization.
(3) The control variables.
Based on previous research, we also control other variables (included in the set X of variables in the model) that may affect rural poverty (). These variables include the following: Economic development (d1) is measured by the per capita GDP of each province. The industrial structure (d2) is expressed by the ratio of the value added by the tertiary industry to the GDP. The level of infrastructure (d3) is measured by the investment in rural fixed assets per capita. The income gap between urban and rural areas (d4) is calculated by the ratio of the per capita income of urban and rural residents. The level of rural marketization (d5) is expressed by the rural retail sales of per capita social consumer goods. The level of rural technology (d6) is measured by the total power of agricultural machinery of a unit output value for farming, forestry, animal husbandry, side-line production, and fishery. The degree of government interference (d7) is measured by the ratio of the total fiscal expenditure to all agricultural-related expenditures. The level of cultural undertakings (d8) is expressed by the per capita cultural career funds.
Table 3. The meanings and descriptions of the variables.
3.2.2. Data sources and statistical description
The sample data in this paper covered 30 provinces (municipalities and autonomous regions) in China. Due to their lack of data, Tibet, Hong Kong, Macao, and Taiwan were not considered. The data on each province in the sample data were taken from the China Environmental Statistical Yearbook (2010–2020), China Rural Statistical Yearbook (2010–2020), China Rural Poverty Monitoring Report (2010–2020), China Population and Employment Statistical Yearbook, and China Statistical Yearbook (2010–2020). These data were combined to obtain panel data on 30 provinces in China from 2009 to 2019, a total of 330 observational samples were collected. The definitions and descriptive statistics of each variable are shown in .
Table 4. Descriptive statistics.
4. Empirical results
4.1. Spatial auto-correlation test
According to , the rate of urbanization and the dimensions of poverty reduction of Moran’s I in all provinces of China were primarily positive from 2009 to 2019. They all passed the significance test and had Z values higher than the critical value of 1.96, which indicates a significant spatial agglomeration effect between urbanization and multidimensional poverty reduction in all provinces of China (Cheng et al., Citation2014). Moran’s I for urbanization was above 0.3 and was significant at the 1% level; its Z value was above 3.8 and was stable in the study period.
Table 5. Moran’s I for urbanization and poverty in China.
According to the results, Moran’s I index of economic poverty was the highest; its value gradually increased and then decreased over time, showing an inverted ‘U-shaped’ trend. This indicates that economic poverty in China increased spatially clustering from 2009 to 2014 but subsequently halted. Moran’s I for educational poverty showed a fluctuating upward trend that passed the significance test at 1%. Moran’s I for living poverty showed a rising trend and passed the significance test at least above 10%, indicating a trend of strengthening spatial agglomeration. China has introduced a series of anti-poverty measures that include breaking geographical boundaries and speeding up the cross-regional flow of population and resources to boost the agglomeration effect of poverty reduction. Moran’s I for health poverty passed the 1% significant test in 2010–2017, indicating the existence of a spatial agglomeration effect. Moran’s I changed from positive to negative from 2018 to 2019, and its absolute value increased yearly. This demonstrates that health poverty has significantly reduced in the country.
4.2. Estimating spatial panel regression model
4.2.1. Checking the model and identification
We incorporated the tests proposed by Elhorst (Citation2014) and Anselin et al. (Citation1996) to select the specific form of the spatial panel metrology model (). First, four Lagrange multiplier (LM) based diagnostics tests (including LM lag, robust LM spatial lag, LM error, and robust LM error) were used to determine whether to apply the SLM or the SEM. According to the P-value of the LM test, the original hypothesis—that there was no spatial lag or spatial error—was rejected. As a result, the spatial metrology model was chosen. Second, a Hausman test was used to determine whether the selection effects were fixed or random. The findings demonstrate that the original hypothesis was rejected at a 1% significance level, and the fixed-effects model was chosen. Finally, the SDM was constructed, and the Wald and LR statistics were calculated to verify whether it could be simplified to the SLM or the SEM. The results all passed the significance test, and the original hypothesis was thus rejected. The SDM could not be reduced to the SLM or the SEM, and it was necessary to use it to fit the sample data. In addition, each model could be controlled according to space-fixed effects, time-fixed effects, and double-fixed effects. The space-fixed effect was chosen as the best model by comparing the models in terms of the goodness-of-fit, R2.
Table 6. Results of tests of the spatial metrology model.
4.2.2. Analysis of results of spatial panel regression
By using the SDM, the following empirical results were obtained ():
Table 7. Results of SDM for different dimensions of poverty.
(1) With accelerating urbanization, the rural labor force has continually transferred to cities and towns, which has helped reduce the poor rural population. The labor force engaged in cities receives wages in addition to farming revenue. Furthermore, urbanization has provided a large market for rural economic development and increased rural consumption. The spatial coefficient ρ of economic poverty was larger than zero and passed the 1% significance test. This demonstrates that economic poverty had significant characteristics of positive spatial correlation, that is, economic poverty reduction demonstrated regional agglomeration. The result is consistent with Section 4.1 (spatial autocorrelation test). The regression and spatial lag coefficient of urbanization were −1.225 and −5.085, respectively (less than zero), and they passed the significance test. This also demonstrates that urbanization during the study period alleviated economic poverty in the given province and had positive spatial spillover effects on economic poverty in other provinces. Simultaneously, the absolute values of the regression coefficient and the spatial lag coefficient of urbanization were higher than those of the other three aspects when it came to reducing economic poverty. This shows that urbanization had the biggest effect on reducing economic poverty.
Among the control variables, the industrial structure, rural technological progress, and government involvement significantly contributed to economic poverty reduction. This is because these variables promoted the development of the tertiary sector of the economy, especially the service industry, which in turn increased employment among the rural labor force. A large amount of local government expenditure has been dedicated to rural infrastructure projects, reducing economic poverty among rural residents (Abbasi et al., Citation2021). At the same time, only the industrial structure passed the significance test, which shows that it had direct and spatial spillover benefits for reducing economic poverty.
(2)Urbanization and educational development had interactive effects and promoted and supported each other. Urbanization has fueled and supported improved education, while higher education has expedited urbanization by supplying talent and labor. Poverty reduction in education exhibited an apparent positive spatial correlation and spatial agglomeration. The regression coefficient of urbanization was − 0.797 and passed the significance test at the level of 1%, indicating that urbanization had mitigated local educational poverty. But the coefficient of urbanization for the spatial lag in educational poverty was −0.150 and did not pass the significant test. This means that it had no spatial spillover effect.
The regression coefficients of economic development, industrial structure, and government intervention were all negative and passed the significance test. Education is a public good because economic development and financial expenditure improve local education. Economic development and industrial structure’s spatial lag coefficients passed the significance test, which shows that both, for a particular province, could have a restraining effect on educational poverty in neighboring provinces. This might have occurred due to the transfer of the rural labor force to economically developed areas, resulting in a lack of local labor force and talent. Infrastructure may generally reduce multidimensional poverty, but these findings were not statistically significant. This could be because people are more likely to invest in projects that are better for GDP growth than in rural public goods.
(3)The spatial coefficient of health poverty ρ was larger than zero and had significant characteristics of spatial agglomeration. However, the regression results show that urbanization did not directly or indirectly affect reducing health poverty in a given province or neighboring provinces, possibly owing to the weak response of health poverty to population mobility. Economic development, infrastructure, rural technology, and government involvement were all important factors in reducing health poverty. With the further development of urbanization, a large number of surplus laborers in rural areas have moved to cities and towns, promoting the further development of the urban economy, but a relatively small percentage of these people are engaged in individual and private enterprise activities and have higher income, they can rely on high income to obtain urban hukou and pursue a higher level of lifestyle, thus promoting the development of urbanization, while those migrant workers with lower education and skill levels and poorer are more often working in cities and hukou in rural areas. Because of this, the difference in income between cities and rural areas is growing, so the effect of the difference in income between cities and rural areas on reducing health poverty was small.
The regression coefficients of economic development and government intervention were −0.178 and-0.107, respectively, which shows that health poverty decreased by 0.178% and 0.107% with an increase in economic development and government intervention. This was because improvements in these control factors reflected developments in rural public services, especially in access to medical services and social security.
(4)Urbanization has increased the effectiveness of economic activity by aggregating production-related elements and ensuring the best use of resources. Therefore, urbanization has boosted farmers’ income, enhanced their standard of living, reduced poverty by optimizing the income structure, and improved human capital, infrastructure, and social security. The results show a significant positive spatial correlation for poverty reduction, which also exhibited spatial agglomeration. Urbanization had a considerable beneficial impact on poverty reduction, as shown by the regression coefficient of urbanization, which was −0.678 and passed the 5% significance level. The spatial spillover effect of urbanization on living poverty passed the significant test. This demonstrates that urbanization can reduce living poverty in local areas and neighbouring areas. The majority of the control variables had adverse effects on poverty reduction and passed the significance test. Economic development, industrial structure, marketization, and government intervention also had significant spatial spillover effects because urbanization promotes the concentration of population to cities and changes the distributions of income and expenditure of residents through employment. At the same time, economic development, industrial structure, and government involvement improved production-related and living facilities in local and neighboring areas, ensured the supply of necessities for the poor, and improved residents’ living standards.
4.2.3. Analysis of direct effects and spatial spillover effects
Compared with the SEM and the SLM, the SDM adds a spatial lag term to expand the correlation structure between the observed values. Its empirical results can explain the direct and indirect effects of the independent and controlled variables, where direct effects refer to the impact of urbanization on poverty in a given province, and indirect effects refer to its spatial spillover effect on poverty in neighboring provinces. The direct, indirect, and total effects of urbanization on poverty in each dimension were obtained by using the SDM, as shown in . They demonstrate that urbanization had direct and indirect effects on reducing economic and living poverty. It had a direct effect on reducing education poverty, but its indirect effect was not significant, whereas neither its direct nor indirect effects were significant in reducing health poverty. Despite the fact that the spatial lag for health poverty was not significant but was negative, its direction remained consistent. The direct effect of urbanization on poverty alleviation was −2.098, meaning that for every 1% increase in urbanization, the poverty of the local economy was reduced by 2.098%. Because the former contained a ‘feedback effect’ wherein changes in local explanatory variables influenced those in local values by affecting changes in the corresponding regional values, the direct effect’s absolute value (-2.098) was bigger than the regression coefficient’s (-1.225) (WanG et al., Citation2020).
Table 8. Direct, indirect, and total effects of urbanization on different dimensions of poverty.
The value of the indirect effect of urbanization on economic poverty alleviation was −12.463, meaning that for every 1% increase in urbanization in a given province, the total economic poverty alleviation in other provinces was-12.463%. Similar to this, for every 1% increase in urbanization, local poverty was reduced by 1.433%, and poverty in other provinces was reduced by −15.663% in total. In general, poverty reduction had a spatial correlation effect among provinces. Urbanization aided in the reduction of local living poverty, the development of surrounding areas, and the reduction of inter-regional poverty.
4.2.4. Analysis on a sub-regional basis
As there are significant differences in economic and social development among the provinces in China, we used the China Statistical Yearbook to divide the provinces into eastern, central, and western regions to examine the spatial heterogeneity of the effects of urbanization on multidimensional poverty reduction. The eastern provinces included Beijing, Tianjin, Hebei, Liaoning, Shanghai, Jiangsu, Zhejiang, Fujian, Shandong, Guangdong, and Hainan. The central provinces included Jilin, Heilongjiang, Shanxi, Jiangxi, Anhui, Henan, Hunan, and Hubei. The western provinces included Inner Mongolia, Guangxi, Shaanxi, Gansu, Sichuan, Chongqing, Guizhou, Yunnan, Qinghai, Ningxia, and Xinjiang. As the spatial spillover effect of urbanization on reducing education and health poverty in various provinces and regions was not prominent, it is not discussed here.
presents the outcomes. The spatial coefficients ρ of economic poverty in the eastern, central, and western regions were all more than zero and passed the significant test. Therefore, there was a significant positive spatial correlation between the reduction of economic poverty in these three areas. The coefficients of regression and spatial lag of urbanization in these regions were all less than zero, but the eastern region failed the significance test. This may be owing to the higher level of urbanization in this region as a whole and the lower marginal effect of poverty reduction due to urbanization. In the central and western regions, urbanization had a significant positive effect on poverty reduction, indicating that urbanization in underdeveloped areas is more conducive to reducing economic poverty. In terms of the absolute values of the coefficients of regression and spatial lag, the eastern, central, and western provinces show a trend of gradual decrease. This indicates that the spatial spillover effect of urbanization on economic poverty reduction decreased gradually. Possible reasons for this are as follows: First, comprehensive urbanization in the eastern regions was more substantial than that in the central and the western regions. Second, compared with the central and the western regions, the eastern region has more labor talent, higher degrees of information, better infrastructure, and greater economic cooperation with other areas. Third, despite the rapid urbanization in the central and western regions in recent years, many negative effects of it, such as the brain drain and rural dilapidation, might have been more intense in underdeveloped regions (Ge et al., Citation2018, Citation2020; Xie, Citation2020).
Table 9. Examination of multidimensional poverty in different regions.
Values of the spatial coefficient ρ of poverty in the eastern, central, and western regions were all more than zero and passed the significance test. This verifies that poverty had a significant positive spatial correlation and spatial agglomeration. The eastern region had a positive regression coefficient, whereas the central and western regions were negative, suggesting that the middle and western regions’ urbanization had a greater impact on poverty reduction. The western region had the highest absolute value of the coefficient, meaning that for every 1% increase in urbanization, local living poverty was reduced by 1.418%. This also shows that the more economically underdeveloped an area was, the greater the extent to which urbanization could reduce poverty in it. The 14 contiguous regions of extreme poverty in China are concentrated in the central and western regions. Urbanization can significantly improve the infrastructure and service facilities for production and living in the poverty-stricken regions of the middle and the west and the quality of living of community residents (Abbasi et al., Citation2021; Zhang et al., Citation2022). The rate of urbanization in the eastern regions was higher than in the central and western regions. As the quality of living of rural residents, ecological environment, and related infrastructure were superior, the role of urbanization in reducing living was minor. Regarding the coefficient of spatial lag of urbanization, the eastern and western regions passed the significance test for living poverty while the central regions failed it. In addition, the effect of urbanization on poverty reduction in provinces neighboring a given one exhibited the characteristics of the smallest in the central regions, middling in the eastern regions, and the largest in the western regions.
4.2.5. Robustness test
All of the sample data were analyzed using the nested matrix. The economic distance matrix was used to re-estimate the data to test the robustness of the results. After conducting the Hausman, LR, LM, and Wald tests, the SDM was selected to estimate the parameters. As shown in , the spatial coefficients ρ of the dimensions of economy, education, health, and living poverty were all positive and passed the significant test. This verifies that there were substantial positive spatial correlations among the dimensions of poverty and that they had a spatial agglomeration effect. The coefficient of spatial lag of living poverty was −1.326 and passed the significance test at the level of 1%, indicates that urbanization mitigated the living poverty of any given province and neighboring provinces. Whether it was the regression coefficient or lag, the total value of the economic dimension of poverty was the largest in absolute terms, consistent with the above conclusions. A comparison showed that the results based on the economic distance matrix were consistent with those based on the nested matrix. This shows that the conclusions of this study are strong and reliable.
Table 10. Results of regression of the SDM based on the economic distance matrix.
5. Discussion and conclusions
5.1. Discussion
From a global perspective, the increasingly complex international situation and the slowdown in global economic growth have cast a shadow on achievements in poverty reduction with respect to the schedule outlined by the United Nations. Particularly, the COVID-19 pandemic has hindered the economic growth of countries throughout the globe. The risk of a global economic downturn has increased, and relatively poor populations have started to slide into absolute poverty. According to a report released by the World Bank, COVID-19 may cause 150 million people to fall into extreme poverty. However, China has gone against the trend and achieved significant success in poverty reduction. In 2020, the Chinese government announced that nearly 99 million poor people in rural areas had been lifted out of extreme poverty under current standards. In terms of economic poverty, rural residents’ per capita disposable income in poor areas increased from $939.02 in 2013 to $1,944.46 in 2020. In the context of education poverty, the opportunities for poor people to receive education have increased significantly, and the rate of consolidation of nine-year compulsory education was 94.8% in 2020. In the context of health poverty, the Chinese government provides all poor people with basic medical insurance, insurance against serious illnesses, and medical assistance systems. More than 99.9% of the poor participate in basic medical insurance. To address living poverty, the tap water penetration rate in impoverished areas increased from 70% in 2015 to 83% in 2020. Meanwhile, since 2013, nearly 25.7 million poor people have been living in safe housing. For more information, the interested reader can refer to (Xinhua News, Citation2021).
The UN Secretary-General Antonio Guterres has claimed that China’s reduction of poverty has made an essential contribution to a better and prosperous world, as described in the 2030 Agenda for Sustainable Development (Xinhua Net, Citation2021). We can draw lessons from this research to guide the future global poverty reduction goal.
First, we must promote the new urbanization strategy (Zhou et al., Citation2020). The results demonstrated that urbanization helps alleviate multidimensional poverty and has a spatial spillover effect in many areas. Urbanization is conducive to reducing poverty in a given region and may also help reduce it in surrounding areas through spatial spillover. Therefore, urbanization should continue to be encouraged among the rural population. It raises farmers’ incomes and makes rural work more productive, both of which are important for getting people out of poverty.
Second, we should pay attention to poverty alleviation along a single dimension. China’s urbanization has had the strongest effect on alleviating economic poverty but has had weaker influences on reducing health and educational poverty. This is a warning that while promoting poverty alleviation, we tend to attend more to economic poverty and ignore poverty in education, health, and other areas. Alleviation of poverty only along a single dimension cannot be regarded as poverty alleviation in the real sense.
Third, urbanization seems to have a greater effect on reducing poverty in underdeveloped regions. In China’s central and western regions, new urbanization has reduced poverty to a greater extent than in the developed regions of the east. This leads us to another hypothesis: urbanization has a greater impact on reducing poverty in a region (country) with a lower rate of urbanization. This claim needs to be verified in future research.
5.2. Conclusions
This study used panel data on 30 Chinese provinces from 2009 to 2019 to construct a system of indices to assess multidimensional poverty consisting of the four dimensions of economy, education, health, and living. Through the spatial autocorrelation test and the SDM, we obtained the spatial distribution of poverty in each dimension as well as the spatial spillover effect of urbanization on poverty reduction. In contrast to previous research, we examined the spatial effect of urbanization on poverty reduction from a multidimensional perspective of poverty. The main conclusions are as follows:
During the study period, Moran’s I index for China’s rate of urbanization was positive. The results of significance tests reflected characteristics of spatial agglomeration in China’s urbanization, which is consistent with the results reported by Li et al. (Citation2018), Liu and Liu (Citation2019), and Xing et al. (Citation2021). Values of Moran’s I for reductions in economic, educational, health-related, and living poverty were mostly positive and passed the significant test. This demonstrates there were spatial agglomeration characteristics in different dimensions of poverty reduction. Moran’s I for economic poverty reduction was the highest in value. In the SDM, the different dimensions of poverty showed significant positive spatial correlations with spatial agglomeration.
The results of spatial econometrics with spatial lag revealed that urbanization had a significant effect on poverty reduction in three dimensions—economic, educational, and living—but its effect in reducing health poverty failed the significant test. At the same time, urbanization had a spatial spillover effect on poverty reduction in the economic and living dimensions. Values of its direct effects on economic and living poverty were -2.098 and -1.433, and those of its indirect effects were -12.463 and -14.231, respectively. The direct and spatial spillover effects of urbanization on health poverty also failed the significant test, as did the direct spillover effect on educational poverty.
From the perspective of spatial heterogeneity, the spatial spillover effects of urbanization on reducing economic and living poverty were significantly different in the east, the middle, and the west. Urbanization was more effective at poverty reduction in the economic and living dimensions in the middle and the west.
By studying the correlation and spatial spillover effects of urbanization on poverty alleviation in the four dimensions of economy, education, health and life, this paper has preliminarily explored the basic characteristics of multidimensional poverty reduction by urbanization. However, there is still need for improvement in the relevant mechanisms and theoretical analyses of urbanization and multidimensional poverty measurement, as well as further research into the methods for classifying multidimensional poverty. At the same time, because of the limitation of data acquisition and reserve, the sample data only involves the province and city levels. In the future, with the continuous improvement of the statistical system of the county-level data, the poor rural areas at the county level in China should be included in the study further to test the generality of the conclusion of this study.
Disclosure statement
No potential conflict of interest was reported by the authors.
Additional information
Funding
References
- Abbasi, K. R., Abbas, J., & Tufail, M. (2021). Revisiting electricity consumption, price, and real GDP: A modified sectoral level analysis from Pakistan. Energy Policy, 149, 112087. https://doi.org/10.1016/j.enpol.2020.112087
- Abbasi, K. R., Shahbaz, M., Jiao, Z., & Tufail, M. (2021). How energy consumption, industrial growth, urbanization, and CO2 emissions affect economic growth in Pakistan? A novel dynamic ARDL simulations approach. Energy, 221, 119793. https://doi.org/10.1016/j.energy.2021.119793
- Alkire, S., & Foster, J. (2011). Counting and multidimensional poverty measurement. Journal of Public Economics, 95(7–8), 476–487. https://doi.org/10.1016/j.jpubeco.2010.11.006
- Alkire, S., Roche, J. M., & Vaz, A. (2015). Changes over time in multidimensional poverty: Methodology and results for 34 countries. OPHI Working Papers, 94(76) https://doi.org/10.1016/j.worlddev.2017.01.011
- Ambel, A. A., Mugera, H. K., & Bain, R. (2020). Accounting for drinking water quality in measuring multidimensional poverty in Ethiopia. PloS one, 15(12), e0243921. https://doi.org/10.1371/journal.pone.0243921
- Anselin, L. (1988). Spatial econometrics: Methods and models. Kluwer. https://doi.org/10.1007/978-94-015-7799-1
- Anselin, L., Bera, A. K., Florax, R., & Yoon, M. J. (1996). Simple diagnostic tests for spatial dependence. Regional Science and Urban Economics, 26(1), 77–104. https://doi.org/10.1016/0166-0462(95)02111-6
- Anselin, L., Varga, A., & Acs, Z. (1997). Local geographic spillovers between university research and high technology innovations. Journal of Urban Economics, 42(3), 422–448. https://doi.org/10.1006/juec.1997.2032
- Arouri, M., Youssef, A. B., & Nguyen, C. (2017). Does urbanization reduce rural poverty? Evidence from VietNam. Economic Modelling, 60, 253–270. https://doi.org/10.1016/j.econmod.2016.09.022
- Awan, M. S., Malik, N., Sarwar, H., & Waqas, M. (2011). Impact of education on poverty reduction. International Journal of Academic Research, 3(1), 660–666. https://mpra.ub.uni-muenchen.de/id/eprint/31826
- Azam, J. P., & Gubert, F. (2006). Migrants’ remittances and the household in Africa: A review of evidence. Journal of African Economies, 15(Supplement 2), 426–462. https://doi.org/10.1093/jae/ejl030
- Baltagi, B., & Li, D. (2000). Prediction in the panel data model with spatial correlation. Verlag Press. https://doi.org/10.1007/978-3-662-05617-2_13
- Betti, G., Gagliardi, F., Lemmi, A., & Verma, V. (2015). Comparative measures of multidimensional deprivation in the European Union. Empirical Economics, 49(3), 1071–1100. https://doi.org/10.1007/s00181-014-0904-9
- Bloomberg News. (2012, January 17). China’s urban population exceeds the countryside for the first time. https://www.bloomberg.com/news/articles/2012‐01‐17/china‐urban‐population‐exceeds‐rural
- Bourguignon, F., & Chakravarty, S. R. (1998). The measurement of multidimensional poverty. Delta Working Papers, 1(1), 25–49. https://doi.org/10.1023/A:1023913831342
- Chen, Y., Wang, Y., & Zhao, W. (2017). Contributing factors and classification of poor villages in China. Acta Geographica Sinica, 72(10), 1827–1844. https://doi.org/10.11821/dlxb201710008
- Cheng, Y., Wang, Z., Ye, X., & Wei, Y. (2014). Spatio-temporal dynamics of carbon intensity from energy consumption in China. Journal of Geographical Sciences, 24(4), 631–650. https://doi.org/10.1007/s11442-014-1110-6
- Dong, Y., Jin, G., Deng, X., & Wu, F. (2021). Multidimensional measurement of poverty and its Spatio-temporal dynamics in china from the perspective of development geography. Journal of Geographical Sciences, 31(1), 130–148. https://doi.org/10.1007/s11442-021-1836-x
- Ekeocha, D. O. (2021). Urbanization, inequality, economic development, and ecological footprint: Searching for turning points and regional homogeneity in Africa. Journal of Cleaner Production, 291, 125–244. https://doi.org/10.1016/j.jclepro.2020.125244
- Elhorst, J. P. (2014). Spatial econometrics: From cross-sectional data to spatial panels. Verlag Press. https://doi.org/10.1007/978-3-642-40340-8
- Foster, J. E., Greer, J., & Thorbecke, E. (1984). A class of decomposable poverty indices. Econometrica, 52(3), 761–766. https://doi.org/10.2307/1913475
- Gao, S., & Sun, K. (2020). Poverty measure based on hesitant fuzzy decision algorithm under social network media. Symmetry, 12(3), 384. https://doi.org/10.3390/sym12030384
- Ge, D., Long, H., Qiao, W., Wang, Z., Sun, D., & Yang, R. (2020). Effects of rural–urban migration on agricultural transformation: A case of yucheng city, china. Journal of Rural Studies, 76, 85–95. https://doi.org/10.1016/j.jrurstud.2020.04.010
- Ge, D., Long, H., Tu, S., & Li, Y. (2016). The development and Prospect of new urbanization and poverty alleviation development. Journal of Economic Geography, 36(04), 22–28. https://doi.org/10.15957/j.cnki.jjdl.2016.04.004
- Ge, D., Long, H., Zhang, Y., Li, M., & Li, T. (2018). Farmland transition and its influences on grain production in china. Land Use Policy, 70, 94–105. https://doi.org/10.1016/j.landusepol.2017.10.010
- Ge, D., Zhou, G., Qiao, W., & Yang, M. (2020). Land use transition and rural spatial governance: Mechanism, framework and perspectives. Journal of Geographical Sciences, 30(8), 1325–1340. https://doi.org/10.1007/s11442-020-1784-x
- Hanandita, W., & Tampubolon, G. (2016). Multidimensional poverty in Indonesia: Trend over the last decade (2003–2013). Social indicators Research, 128(2), 559–587. https://doi.org/10.1007/s11205-015-1044-0
- Hao, Y., Gai, Z., Yan, G., Wu, H., & Irfan, M. (2021). The spatial spillover effect and nonlinear relationship analysis between environmental decentralization, government corruption, and air pollution: Evidence from China. The Science of the Total Environment, 763(11), 144183. https://doi.org/10.1016/j.scitotenv.2020.144183
- He, J., Wang, X., Liu, D., Sun, X., & Duan, Z. (2019). The decoupling relationship between tourism development and multidimensional poverty in national-level poor counties: A case study of Southwest China. Geographical Research, 38(5), 1189–1207. https://doi.org/10.11821/dlyj020171246
- Henderson, J. V. (2010). Cities and development. Journal of Regional Science, 50(1), 515–540. https://doi.org/10.1111/j.1467-9787.2009.00636.x
- Huo, T., Cao, R., Du, H., Zhang, J., Cai, W., & Liu, B. (2021). Nonlinear influence of urbanization on china’s urban residential building carbon emissions: New evidence from panel threshold model. The Science of the Total Environment, 772(2), 145058. https://doi.org/10.1016/j.scitotenv.2021.145058
- Jiang, L., Wen, H., & Qi, W. (2020). Sizing up transport poverty alleviation: A structural equation modeling empirical analysis. Journal of Advanced Transportation, 2020(5), 1–13. https://doi.org/10.1155/2020/8835514
- Kuznets, S. (1955). Economic growth and income inequality. American Economic Review, 45, 25–37. https://doi.org/10.4324/97804293112084
- Lanjouw, P., & Murgai, R. (2010). Poverty decline, agricultural wages, and non-farm employment in rural India: 1983–2004. Agricultural Economics, 40(2), 242–263. https://doi.org/10.1111/j.1574-0862.2009.00373.x
- Lesage, J., & Pace, R. K. (2009). Introduction to spatial econometrics. Chapman & Hall/CRC Press.
- Lewis, W. A. (1954). Economic development with unlimited supplies of labour. The Manchester School, 22(2), 139–191. https://doi.org/10.1111/j.14679957.1954.tb00021.x
- Li, G., Cai, Z., Liu, J., Liu, X., Su, S., Huang, X., & Li, B. (2019). Multidimensional Poverty in Rural China: Indicators, Spatiotemporal Patterns, and Applications. Social Indicators Research, 7, 1–36. https://doi.org/10.1007/s11205-019-02072-5
- Li, M., Li, C., & Zhang, M. (2018). Exploring the spatial spillover effects of industrialization and urbanization factors on pollutants emissions in China’s Huang-Huai-Hai region. Journal of Cleaner Production, 195, 154–162. https://doi.org/10.1016/j.jclepro.2018.05.186
- Li, Q., Wu, X., Zhang, Y., & Wang, Y. (2020). The effect of agricultural environmental total factor productivity on urban-rural income gap: An integrated view from china. Sustainability, 12(8), 3327. https://doi.org/10.3390/su12083327
- Liu, F. Y., & Liu, C. Z. (2019). Regional disparity, spatial spillover effects of urbanisation and carbon emissions in China. Journal of Cleaner Production, 241, 118226. https://doi.org/10.1016/j.jclepro.2019.118226
- Liu, M., Hu, S., Ge, Y., Heuvelink, G. B., Ren, Z., & Huang, X. (2021). Using multiple linear regression and random forests to identify spatial poverty determinants in rural China. Spatial Statistics, 42, 100461. https://doi.org/10.1016/j.spasta.2020.100461
- Liu, W., Zhao, M., Cai, Y., Wang, R., & Lu, W. (2019). Synergetic relationship between urban and rural water poverty: Evidence from northwest china. International Journal of Environmental Research and Public Health, 16(9), 1647. https://doi.org/10.3390/ijerph16091647
- Liu, X., Sun, T., & Feng, Q. (2019). Dynamic spatial spillover effect of urbanization on environmental pollution in China considering the inertia characteristics of environmental pollution. Sustainable Cities and Society, 53, 101–103. https://doi.org/10.1016/j.scs.2019.101903
- Liu, Y. H., & Yong, X. (2016). Geographic identification of multidimensional poverty in rural China under the framework of sustainable livelihoods analysis. Applied Geography, 73, 62–76. https://doi.org/10.1016/j.apgeog.2016.06.004
- Liu, Y. L., Zhu, K., Chen, Q. Y., Li, J., Cai, J., He, T., & Liao, H. P. (2021). Impact of the covid-19 pandemic on-farm households’ vulnerability to multidimensional poverty in rural China. Sustainability, 13(4), 1842. https://doi.org/10.3390/su13041842
- Long, H., Tu, S., & Ge, D. (2016). Effects of new-type urbanization on poverty alleviation and development and corresponding countermeasures. Bulletin of Chinese Academy of Sciences, 31(03), 309–319. https://doi.org/10.16418/j.issn.1000-3045.2016.03.006
- Martinez-Vazquez, J., Panudulkitti, P., & Timofeev, A. (2009). Urbanization and the poverty level. Revista De Estudios Regionales, 100, 19–46. https://www.redalyc.org/articulo.oa?id=75533716001
- Moran, P. (1948). The interpretation of statistical maps. Journal of the Royal Statistical Society, 10, 243–251. https://doi.org/10.1111/(ISSN)1467-9868
- Moran, P. A. P. (1950). Notes on continuous stochastic phenomena. Biometrika, 37(1–2), 17–23. https://doi.org/10.2307/2332142
- Nordhaus, W. (2006). Geography and macroeconomics: New data and new findings. Proceedings of the National Academy of Sciences of the United States of America, 103(10), 3510–3517. https://doi.org/10.1073/pnas.0509842103
- OPHI. (2020). Global MPI 2020. https://ophi.org.uk/multidimensional-poverty-index/global-mpi-2020/
- Ravallion, M., Chen, S., & Sangraula, P. (2007). New evidence on the urbanization of global poverty. Population and Development Review, 33(4), 667–701. https://doi.org/10.1111/j.1728-4457.2007.00193.x
- Sen, A. (1999). Development as freedom. Oxford University Press.
- Shahbaz, M., Aamir, N., & Shabbir, M. S. (2010). Urbanization and poverty reduction: A case study of Pakistan. Social Science Electronic Publishing, 8(4), 23–37.
- Tobler, W. R. (1970). A computer movie simulating urban growth in the Detroit region. Economic Geography, 46(2), 234–240. https://doi.org/10.2307/143141
- United Nations. (2015). The millennium development goals report 2015. https://www.cn.undp.org/content/china/zh/home/library/mdg/mdg-report-2015.html
- WanG, S., He, Z., Guo, Y., & Guo, A. (2020). Does tourism poverty alleviation have spatial spillover effect? Business Management Journal, 42(05), 103–119. https://doi.org/10.19616/j.cnki.bmj.2020.05.007
- Wang, W., Yu, C., Zeng, X., & Li, C. (2020). Evolution characteristics and driving factors of county poverty degree in China’s southeast coastal areas: A case study of Fujian Province. Progress in Geography, 39(11), 1860–1873.
- Xie, E. (2020). Urbanization and poverty reduction in rural China. Economic Science, 2020(03), 5–16. https://doi.org/Cnki:sun:jjkx.0.2020-03-002
- Xing, L., Zhu, Y., & Wang, J. (2021). Spatial spillover effects of urbanization on ecosystem services value in Chinese cities. Ecological Indicators, 121, 107028. https://doi.org/10.1016/j.ecolind.2020.107028
- Xinhua Net. (2021, March 9). UN Secretary-General Guterres wrote to Xi Jinping to congratulate China on its historic achievements in tackling poverty. http://www.xinhuanet.com/2021-03/09/c_1127191001.htm
- Xinhua News. (2021, April 6). White paper on China’s practice of human poverty reduction. http://www.gov.cn/zhengce/2021-04/06/content_5597952.htm
- Xue, Z., Li, N., Mu, H., Zhang, M., & Pang, J. (2021). Convergence analysis of regional marginal abatement cost of carbon dioxide in China based on spatial panel data models. Environmental Science and Pollution Research, 2021, 1–18. https://doi.org/10.1007/s11356-021-13288-9
- Yacob, A. Z., Weldensie, T. E., Francis, T., & Vincent, A. (2017). Implications of non-farm work to vulnerability to food poverty-recent evidence from northern Ghana. World Development, 91, 113–124. https://doi.org/10.1016/j.worlddev.2016.10.015
- Yao, X., Zhu, M., & Ji, L. (2021). Measurement of rural relative poverty and comparison of its regional differences in China. Statistics and Decision, 37(05), 10–15. https://doi.org/10.13546/j.cnki.tjyjc.2021.05.002
- Yu, B. (2021). Ecological effects of new-type urbanization in China. Renewable and Sustainable Energy Reviews, 135, 110239. https://doi.org/10.1016/j.rser.2020.110239
- Zhang, B., & Yang, Z. (2020). Rural poverty reduction and its spatial spillover effects of Chinese urbanization: Based on the analysis of the spatial econometric model with provincial panel data. Geographical Research, 39(7), 1592–1608. https://doi.org/10.11821/dlyj020190775
- Zhang, J., Abbasi, K. R., Hussain, K., Akram, S., Alvarado, R., & Almulhim, A. I. (2022). Another perspective towards energy consumption factors in Pakistan: Fresh policy insights from novel methodological framework. Energy, 249, 123758. https://doi.org/10.1016/j.energy.2022.123758
- Zhang, J., Lin, D., Zhou, X., Yu, Z., Song, W., & Cheng, Y. (2020). Spatial difference of multidimensional poverty and its influencing factors in the rural areas of Hainan Province. Progress in Geography, 39(6), 1013–1023. https://doi.org/10.18306/dlkxjz.2020.06.011
- Zhou, L., Dang, X., Mu, H., Wang, B., & Wang, S. (2020). Cities are going uphill: Slope gradient analysis of urban expansion and its driving factors in china. Science of the Total Environment, 709, 1–16. https://doi.org/10.1016/j.scitotenv.2021.145836
- Zhou, L., Dang, X., Sun, Q., & Wang, S. (2020). Multi-scenario simulation of urban land change in shanghai by random forest and ca-markov model. Sustainable Cities and Society, 55, 102045–102010. https://doi.org/10.1016/j.scs.2020.102045
- Zhu, D., Yang, X., & Sun, H. (2019). Empirical analysis of multidimensional poverty reduction effect of urbanization development. Statistics and Decision, 37(05), 88–92. https://doi.org/10.13546/j.cnki.tjyjc.2019.21.020