
 ?Mathematical formulae have been encoded as MathML and are displayed in this HTML version using MathJax in order to improve their display. Uncheck the box to turn MathJax off. This feature requires Javascript. Click on a formula to zoom.
Abstract
This study’s objective is to analyze ecological footprints that exist among China’s economic growth, energy consumption, carbon dioxide emissions, and the revenue that is generated from tourism in other countries. The years 1995 through 2020 are the focus of this particular research endeavor. The relationship between tourism and carbon emissions has been discovered by a large number of researchers; nevertheless, the findings have been inconsistent and do not give a clear picture of the situation. We can only hope that the results of the study will improve the existing body of knowledge on tourism and the quality of the surrounding environment. Throughout the whole of this investigation, the autoregressive distributed lagged (ARDL) model was used to explore both long-run and short-run estimations. A dynamic ordinary least squares (DOLS) model was used in the study to arrive at long-term estimations that could be relied upon. Even though money from tourism does not have a substantial influence on the quality of the environment in China, growth and increasing energy usage are primary donors to carbon emissions in the nation. ARDL model’s long-term projections were shown to be correct by the DOLS approach, which offered this validation. The results of the research provide fresh insights into the body of knowledge that has been accumulated on the subject of the linkage between tourism and the natural environment. Because the receipts from tourism do not have any significant negative exteriority toward the environment, energy usage is an important element of environmental degradation and policymakers should prioritize the development of the tourism sector over energy-focused manufacturing activities to maintain the growth of the nation in the upper quartiles. This is because tourism does not have any significant negative externalities on the environment. Sustainable tourism minimizes environmental and cultural damage while boosting profits. Developing the appropriate technology, physical infrastructure, and human capital requires money, time, and effort.
1. Introduction
Tourism is one of the world’s greatest industries; its significance to the global economy cannot be denied. Tourism produces jobs, boosts exports, and represents immense cultural, environmental, and heritage value. In 2016, worldwide tourism provided 10.2% of the Gross Domestic Product (GDP), generated 292 million employment, and accounted for 7.6% of total world exports. Tourism is a global engine of economic growth and employment creation, despite rising socioeconomic inequalities and environmental consequences (World Travel & Tourism Council, Citation2017). United Nations has declared 2021 as International Year for Sustainable Tourism for Development, making it an opportune opportunity to evaluate the consequences of tourism and support policies that will make tourism a significant contributor to the Sustainable Development Goals of the Unite global tourist industry has risen tremendously in the last 50 years. With its function in promoting economic growth, creating employment, and lowering poverty and inflation, this helps GDP accumulation over the world (Arslanturk et al., Citation2011). As a result, tourism has become a crucial source of income for many areas and countries. Improves the nation’s infrastructure, decreases unemployment, boosts private sector contributions by expanding commercial operations, boosts foreign investment, and therefore, improves the economic state of the nation and the living standards of its citizens (Jalil et al., Citation2013; Tang & Abosedra, Citation2014).
Domestic tourism is more common in underdeveloped countries than foreign tourism. Domestic tourism in China accounted for 93.2% of all visitors in 2017, growing to $7 bn in 2019 and is forecast to reach $15 bn in 2030, an increase of 6.1% per year (UNWTO, Citation2018). According to a report by World Travel and Tourism Council, tourism in China contributed directly to a GDP of US$9000 million in 2018, grew by 6.5 percent in 2020, and is expected to grow by 5 percent from 2020 to US$17000 million in 2030, according to report (UNWTO, Citation2018). This represents 3% of GDP. Additionally, in 2018, the entire GDP contribution of tourism was $23,000 million, which was 6.8 percent of the whole GDP, however in 2020, it has risen to $40,000 million, which is 5.5 percent of the GDP, and in 2030 it will be 6.9 percent of the total GDP. The transportation industry is a crucial component of the tourism sector; therefore, the travel of visitors might contribute to increased energy-led CO2 emissions in the nation. This may raise energy usage and CO2 emissions (UNWTO, Citation2018).
It is believed that the expansion of the tourist industry affects the destination nations in 2 ways: economically, it is beneficial for the economy, but environmentally, it is a major contributor to environmental contamination (Lukashina et al., Citation1996). The objective of sustainable tourism is to achieve balance among these two impacts to improve destination nations’ environment and quality of life (Butler, Citation2000; Yazdi et al., Citation2014). Similarly, a pioneering body of work asserts that tourism and environmental quality have a sustainable connection (Hunter & Green, Citation1995; Walmsley et al., Citation1983). On other hand, it is believed that tourism may impact environmental quality in variety of ways, including infrastructure growth, which is the source of land change and greenhouse gas (GHG) emissions (Gössling, Citation2002). Similarly, the transportation division, an important sector in the tourism industry, is also accountable for carbon dioxide emissions caused by the traveling of visitors. It is suggested that if tourism might stimulate economic growth, its negative impact on environmental quality would also be reflected in the economy. Tourism has contributed greatly to economic growth; however, the environmental harm caused by these activities is endured by the local community (Beeton, Citation2006). In addition to the bond between tourism and environmental quality, the association between carbon emissions and global tourism, in which carbon emissions are measured as a significant component in tourism demand (Beeton, Citation2006; Holden, Citation2016).As energy usage leads to greenhouse gas emissions, it is regarded as the most significant linkage between environmental quality & tourism. On the other end, the rising number of tourist arrivals is beneficial to the economy, but on the other, it increases the need for energy usage in the nation. World Summit recognizes this feature of the tourist sector by classifying it as among the most energy-consuming areas of the economy (Holden, Citation2016).
Tourism, GDP growth, energy use, and carbon dioxide emissions in China are all topics that will be investigated in this study. Literature suggests that experts have not given enough thought to the rising issue of the interplay between energy, natural resource depletion, and international tourism. The present government of China has made boosting the country’s tourist industry a top priority, making this study all the more important. Thus, it is crucial to immediately evaluate the tourism industry’s long-term viability. To make educated decisions, policymakers and regulatory authorities can use the results of the current study to get a clearer picture of the tourism industry in the country from an environmental perspective. The relationship between China’s tourist industry, economic growth, energy consumption, and carbon dioxide emissions will be the primary focus of this investigation. Evidence indicates that global tourism is a booming field that has not received scholarly focus on its merits. The second section of this research involves a literature review. Following that, the approach will be explained in the third section, the results and discussion will be presented in the fourth portion, followed by the conclusions in the fifth section.
2. Literature review
For decades, researchers in the fields of energy and environmental economics have focused their attention on the correlation that exists between overall energy usage and CO2 emissions. This information may be broken down into two primary categories. The first part of the article focuses on analyzing both the development of the economy and the emissions of CO2. Numerous studies have shown favorable relationships between the two categories of literature, and each of these categories has its advocates. For any civilization’s productive activities to be able to keep up with the rate of global economic expansion in the agricultural, industrial, and service sectors of the economy, it is necessary to have access to resources for energy production. Several energy sources in our world are not renewable, produce a significant amount of pollution, and release greenhouse gases. These energy sources pose a risk to both the environment and human life. It has been shown that a higher GDP leads to an increase in energy usage, that in turn causes damage to the environment over the long term. (Zhang & Cheng, Citation2009).According to the study, the Asian region is developing rapidly in consideration of the tourism sector. Findings reveal that tourism promotes environmental degradation which can only be lowered by developing sustainable energy (Wangzhou et al., Citation2022). Another research was conducted for Mexico regarding renewable energy and globalization for a sustainable environment. QARDL test was conducted and findings revealed that renewable energy and globalization both hurt the environment in higher quantiles (Jahanger et al., Citation2022). Some researchers studied the relationship between sustainable tourism, economic growth, and innovations. They performed a QARDL test to verify the results and findings reveal that new technological innovations and sustainable goals help reduce carbon emissions in China in long run (Lv et al., Citation2022). A recent study was done relating tourism, ecological footprint, and economic growth in Saudi Arabia. FOLMS test was conducted to verify the results and findings revealing that tourist arrivals and energy usage have a positive impact on carbon emissions while economic growth harms carbon emissions in Saudi Arabia (Ozturk et al., Citation2022).
In an analysis of Asia-Pacific areas, a study concluded that carbon emissions, energy usage, and economic development are in long-term equilibrium (Meng & Niu, Citation2011). Similarly, another study discovered a bidirectional link between energy consumption in carbon emissions from transport, road transport sector, and economic development based on a survey of 25 OECD nations (Saboori & Sulaiman, Citation2013). Using autoregressive distribution lag and Granger causality technique in VECM on panel data of Asian nations, it was determined that there is a substantial positive association between carbon emissions and energy usage in both the long & short-run (Saboori & Sulaiman, Citation2013). Moreover, UAE time series data provided in a study revealed a positive correlation between energy usage and economic development and a negative correlation between carbon emissions and energy demand (Sbia et al., Citation2014). In the instance of Nigeria, researchers found that economic expansion is one of primary drivers of upsurge in carbon emissions due to an increase in energy usage (Akpan & Akpan, Citation2012). In addition, a study examined the Environmental Kuznets Curve (EKC) for Malaysia and determined that energy usage and economic development are among the most important indicators of carbon emissions (Ali et al., Citation2017b). Research also identified a bidirectional causal link between carbon emissions and energy usage, but economic development and other factors influence CO2 emissions in a unidirectional Granger fashion (Ali et al., Citation2017b). In addition, a study found that long-term carbon emissions are inelastic concerning production, although energy usage looks elastic (Pao & Tsai, Citation2010). The result also demonstrates the existence of bidirectional causation.
It is generally accepted that natural beauty and exciting outdoor activities, as well as an atmosphere that is both healthful and mentally invigorating, are key factors in luring visitors from other countries. According to the thesis presented, there is a link that may be considered long-term between international tourism and environmental quality (Hunter & Green, Citation1995; Lukashina et al., Citation1996). In today’s world, tourism necessitates the existence of several kinds of transportation infrastructures, such as airports, highways, and cruise ships, all of which are reliant on the availability of certain types of energy resources. Because of this, it is not possible to assert that there is a sustained connection between foreign tourism and the condition of the environment. Researchers have argued, in support of this assertion, that transportation is accountable for 94 percent of global warming (Gössling, Citation2002). Another study analyzed the association between tourist arrivals and pollution and determined that the transportation industry is responsible for the majority of pollution (Butler, Citation2000). However, some researchers determined that international tourism and air travel are the leading causes of air pollution (Peeters et al., Citation2007). According to estimates by UNWTO, more than 70% of tourism sector carbon emissions are created by transportation (specifically 39% air transport, 28% vehicle transport, and 3% other transit), whereas 19% and 5% of that are produced by lodging and tourist activities, respectively. In addition, a study discovered that cruise ship travel is more polluting than air travel (Howitt et al., Citation2010). Other research painted a more ominous picture of the possibility for tourism-related high CO2 emissions (Scott et al., Citation2010). They projected that, in the near future, the tourist industry might be the major worldwide emitter of greenhouse emissions. They stated that considerable policy implications and changes in air travel practices would be required to achieve emission reductions (Scott et al., Citation2010). Another study examined the association among carbon emissions, economic development, renewable energy, and the influx of visitors (Aïssa et al., Citation2014). Using panel data from 1995 to 2012, the econometric analysis revealed that renewable energy and tourist arrivals hurt carbon emissions. It indicated that the entrance of visitors leads to long-term carbon reduction (Aïssa et al., Citation2014). In addition, some researchers investigated the long-term association among carbon emissions and tourist arrivals in Malaysia, as well as other macroeconomic factors (Solarin, Citation2014). Using Mauritius time series data from 1978 to 2011, a study revealed positive correlation among carbon emissions and tourist arrivals (Durbarry & Seetanah, Citation2014; Solarin, Citation2014).
Also, some researchers stated that the tourist industry is responsible for five to fifty percent of the nation’s carbon emissions. Also, tourism is an energy-intensive industry that directly or indirectly consumes fuel, electricity, coal, and petroleum while emitting GHGs, particularly CO2 (Gössling, Citation2013). The findings of energy consumption for a single tourist journey found that a single tourist excursion generates between 0.2 and 300 kg of carbon emissions every night. However, 1.2 Gt carbon emissions have been produced worldwide from the 20th century till 2010. Numerous researches have shown the econometric measurements of the influence of tourism-related factors on CO2 emission (Gössling, Citation2013; Gössling & Peeters, Citation2015). A study identified Turkey as a tourism destination visited by 30 million people annually. It included energy usage as a third variable alongside tourism and CO2 emissions (Katircioglu, Citation2014). Long-term, a one percent shift in number of tourists results in 0.10 percent increase in carbon emissions, according to the study (Katircioglu, Citation2014). Similar research in Cyprus indicated that a 1% increase in tourist arrivals results in a 0.04 percent rise in CO2 emissions (Katircioglu, Citation2014). Another study examined 27 European Union member states. Their results indicated co-integration among variables under consideration. In addition, analysis revealed long equilibrium/negative relationship between carbon emissions and tourism. The study uncovered the influence of relevant factors on the economic expansion (Lee & Brahmasrene, Citation2013).
Using a bottom-up methodology, a study determined, carbon emissions from China’s tourist industry in 2012 were nearly nine times greater than in 1980. In addition, tourist-related transportation accounted for the majority of the tourism industry’s CO2 emissions (Tang & Abosedra, Citation2014). Some researchers investigated the association betweenCO2, economic development, renewable energy, and the arrival of visitors. Using panel data from 1990 to 2010, the econometric analysis revealed that renewable energy and tourist arrivals hurt carbon emissions. It indicated that the entrance of visitors leads to long-term carbon reduction (Aïssa et al., Citation2014).
3. Methods
3.1. Model specification
This study explores the impact of global tourism, energy usage, and per capita GDP on carbon emissions. This study’s approach is founded on a modified Cobb-Douglas production function with constant return and cumulative output function with time t, as given below (Ali et al., Citation2017a, Citation2017b).
(1)
(1)
(2)
(2)
This study also covers international tourism, energy consumption, and per capita GDP to account for the fact that a wide variety of human activities are believed to have contributed to the observed increase in atmospheric CO2 levels. The model’s recent theoretical foundations are based on prior work for Pakistan, the United States, and Turkey (Halicioglu, Citation2009; Raza et al., Citation2015; Sharif et al., Citation2017).
Where Xt represents economic development, Ct represents capital, and ELt represents productive labor. Here represents the period,
represents error distribution and Ln represents the natural log with respective variables.
3.2. Data for the model
The statistics from each year between 1995 and 2020 are used to analyze China’s energy usage, tourism receipts, economic growth, and carbon emissions. We are working with three independent variables here: tourist arrivals (TR), gross domestic product (GDP), which stands for economic expansion, and energy use (EC).All of the information is obtained from the World Bank’s official website, titled World Development Indicators (WorldBank, Citation2022).
(3)
(3)
Examining the long-run connection among variables of research necessitated utilizing autoregressive distributed lagged (ARDL) bounds testing technique to cointegration developed (Pesaran et al., Citation2001).ARDL method offers several advantages over alternative cointegration tests. The cointegration test is applicable regardless of the stationarity levels of variables if they are I (0), I (1), or both (Pesaran et al., Citation2001). Small sample properties have been computed using the ARDL technique (Haug, Citation2002).
(4)
(4)
By collecting a satisfactory number of lags of independent variables and one lag of dependent variables to correct autocorrelation, the ARDL method captures the process of data generation. The ARDL method combines short-term modifications with a long-term equilibrium by determining an error-correcting mechanism. Autoregressive Distribution lag outperformed Johansen and Juselius’s method due to its small sample characteristics (Pesaran & Shin, Citation1995). The ARDL method has no endogeneity issues and is devoid of residual correlation for the selection of an appropriate lag. The autoregressive Distribution lag approach facilitated the separation of dependent and independent variables. It is suggested; the Autoregressive Distribution lag method can’t be applied to I(2) variables since obtained F-statistics values in the table will be incorrect for I(2) variables (Ouattara, Citation2004). To establish that there is no I (2) variable, the current study did a unit root test. To determine the presence of long-term links, the study used the ARDL approach to estimate the following Equationequation (4)(4)
(4) .
4. Results and discussion
Research offered data for aspects that were of interest. The data from JarqueBera indicate that there is a pattern of regular distribution between the series of CO2 emissions, tourist revenue, energy usage, and economic development. Findings of normal distribution according to the JarqueBera values have been validated by the fact that the SD values of each variable are low. These low standard deviation values imply that data is scattered around the mean and is not overly dispersed. In addition, research concentrated on Augmented Dickey-Fuller and PP unit root tests to determine the order of integration of the study’s variables. As to establish if variables are stationary at the level I(0) or initial difference, several tests are carried out (1). According to the results of ADF and PP, all variables, except carbon emissions, are stationary at 1st difference. The only exception is the variable representing carbon emissions. Resulting in the progression of variables indicates an authentic link in the long term ().
Figure 1. PP unit root test results.
Source: Authors.
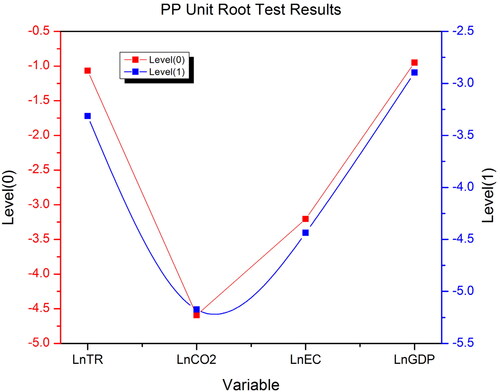
Figure 2. ADF unit root test results.
Source: Authors.
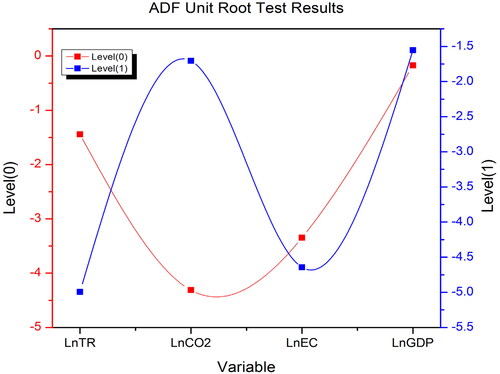
Figure 3. ARDL short run test results.
Source: Authors.
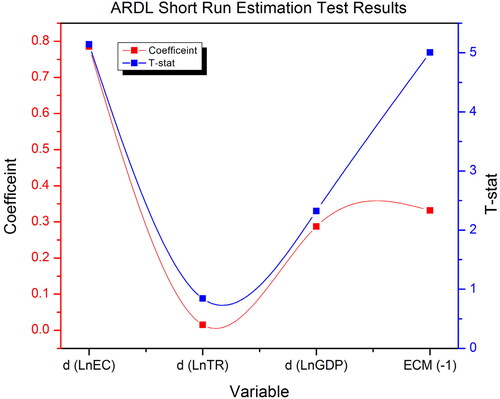
Figure 4. ARDL long run test results.
Source: Authors.
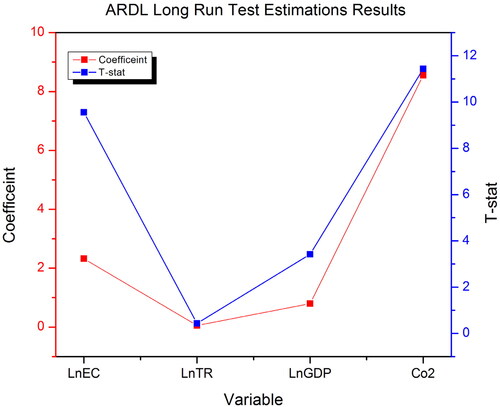
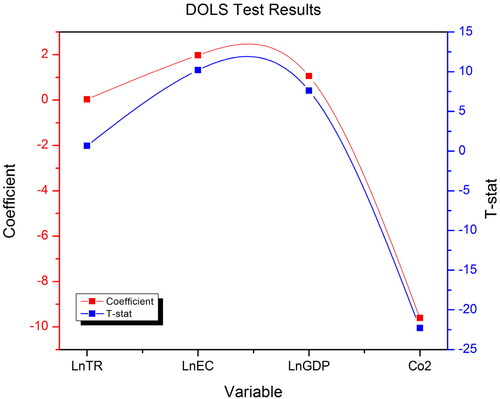
Figure 5. DOLS test results.
Source: Authors.
As the order of integration is a mix of I(0) and I(1), the only feasible cointegration test is the Autoregressive Distribution lag bound test and techniques. The cointegration methodology, on the other hand, is not applicable in this scenario. In light of the findings of unit root tests, we are in a position to analyze the long-term connection between the series by using the ARDL limits test of cointegration since the variables in question are shown to be stationary at 1st difference ().
Table 1. Cointegration test results.
4.1. Autoregressive distribution lag short run test results
There is a strong relationship between the results in the short run and those in the long run. The fact that tourism does not hurt China’s carbon emissions, at least in the near term, demonstrates that this industry in China is environmentally beneficial and does not pollute the surrounding area in any way. Research has shown that the link between tourism and the environment will last for a long time. This is because activities associated with tourism do not have a significant impact on the ecosystem. According to discoveries of research, there is a long-run link between tourism and the environment that is mutually beneficial. When more energy is consumed, there is a dramatic drop in the number of carbon emissions produced. According to the conclusions of recent research, a one percent increase in China’s overall energy consumption will lead to a 0.73 percent rise in the country’s carbon emissions in not too distant future (Jalil et al., Citation2013). The effect is significant since the growth of China’s economy is heavily dependent on the use of energy sources that do not replenish themselves naturally. As a direct consequence of this, China’s total energy emissions have increased over time (Ali et al., Citation2017b). Emissions of carbon dioxide are influenced by the expansion of the economy as well, and it is projected that a rise of 3 percent in GDP per capita would result in a rise of 3 percent in emissions of carbon dioxide. The findings of this study are in line with those of past research. displays the outcomes of short runs and accompanying diagnostic tests.
Table 2. ARDL short run estimations results.
4.2. Autoregressive distribution lag long run test results
After determining that cointegration exists among variables. It is important to determine their short- and long-run coefficients. The autoregressive distribution lag model may concurrently calculate short-run and long-run estimations of variables. Long-term results indicate that tourist reception has a favorable but small effect on carbon emissions. This study’s findings indicate that international tourism in China does not considerably contribute to the atmospheric concentration of CO2 emissions. Tourism-related activities, particularly transportation, rely heavily on the use of fuels that generate a significant quantity of greenhouse gases into the environment. Similarly, infrastructure development is regarded as one of the most influential factors of carbon emissions in many nations. In the case of China, these industries also contribute to environmental pollution, although tourism-related transportation and infrastructure operations do not contribute nearly as much to carbon emissions in the nation. Thus, the outcomes of the research indicate that tourism-related activities in China are somewhat sustainable since they do not significantly contribute to environmental damage. Similarly, a consequence of long-term energy usage has a positive and large effect on carbon emissions, indicating that a rise in the usage of energy resources will result in a substantial rise in atmospheric CO2 concentrations (Durbarry & Seetanah, Citation2014; Jalil et al., Citation2013). Long-term, a 1% rise in energy usage will raise carbon emissions by 3.14%, according to the study. The link between energy usage and carbon emissions is positive and significant; for ASEAN nations (Ali et al., Citation2017b; Saboori & Sulaiman, Citation2013). As a result of the fact that the usage of energy is one of most major contributors to global warming, which happens when large volumes of greenhouse gases (GHGs) are released into the atmosphere, this result is entirely rational and might have been anticipated. provides the results of long-run estimations as followed.
Table 3. ARDL long run estimations test results.
In addition, the study revealed a significant (+ve) correlation between economic development and carbon emissions, indicating that economic expansion in China occurs at the expense of environmental norms. Findings indicate that a one percent rise in economic development may lead to a 0.66 percent rise in carbon emissions in China, which is quite much, and we may conclude; economic growth in the nation is highly polluting. This result supports the second body of literature, which asserts that economic expansion is one of the primary causes of environmental degradation. In the case of China, this result is reasonable and obvious, as the country’s economic activities are highly dependent on the use of energy resources due to its extensive manufacturing and industrial operations.
4.3. Dynamic ordinary least square test
In the present investigation, the DOLS model was used to evaluate how reliable the long-term estimates generated by the ARDL approach were. Concerning the DOLS method, it is possible to use it with a large number of cointegrated variables, and the analysis may be carried out using a mixed order of integration. This test evaluates regresses I (1) factors against other I (1) variables by implementing leads (p) and lags of first difference (-p), while other variables in this study contain integration order of I (0) with a constant term. This method is recommended above others because of its ability to deal with very small samples and its capacity to overcome possible endogeneity problems. The dynamic ordinary least square method analyzed effective cointegrating vectors and estimated findings consistent with the ARDL method’s long-run projections. According to the study, estimates are statistically significant and signs of coefficient correspond to those long-run estimations. All coefficients of variables become more important, although their values remain relatively the same ().
Table 4. Dynamic ordinary least square test results.
5. Conclusions
Researchers conducted their studies between the years 1995 and 2020, focusing on the link between China’s economic growth, international tourist profits, energy usage, and carbon dioxide emissions. ARDL limits test revealed that China’s CO2 emissions and the factors that determine them have a link over the long run. The ARDL research conducted for this study concluded that tourist-related activities in China do not negatively impact the local ecosystem. The findings of the research indicate that traveling to China on vacations from other countries does not negatively impact the local ecosystem. The outcome of this research is noteworthy from three different vantage points. To begin, it is of the utmost importance that those in positions of power in China’s government and regulatory agencies strive toward the adoption of regulations that will encourage the expansion of the country’s tourism sector. Second, the significance of this finding cannot be overstated given the efforts now being made by the Chinese government to increase the number of tourists coming from other countries to kickstart the country’s slowing economy. In addition, this discovery is essential for attracting visitors from all over the globe, who are more inclined to look for eco-friendly places to vacation. The outcome also helps to maintain the rate of economic development in upper quartiles by raising investment possibilities, producing employment, developing infrastructure, and presenting a good image of the country abroad to entice persons who like nature and adventure to move there. According to the findings of the ARDL, the majority of China’s energy resources, such as coal, oil, and natural gas, are nonrenewable and the use of these resources contributes to the upsurge in CO2 emissions in the environment. It is the case even though these resources are being utilized. This finding from the research suggests that an improved approach to the use of energy has to be taken into account to reduce the number of energy resources that are used while simultaneously raising the level of output in the economy. Because energy conservation may stifle the growth of the nation’s economy, the government should place a higher emphasis on developing technologies that use less energy and on restructuring industrial processes to use energy more efficiently. According to the findings of the paper, a rise in economic development has a detrimental effect on the environment. This is because the majority of economic activities in the nation need a significant amount of energy, which in turn leads to an upsurge in pollution.
In light of the findings of the study, which suggest that a healthy economy is likely one of the most significant factors in luring visitors from other countries, the government may decide to concentrate its efforts on growing the tourism industry of the nation to take advantage of the fact that a healthy economy is likely one of the most significant factors in luring visitors from other countries. The robustness test conducted by DOLS found that tourism-related activities in China do not harm the surrounding environment. The findings of this research provide credence to the proposition that the service sector of the economy should get a larger priority as a method of reducing energy consumption and limiting bad impacts on the environment. The outcome of this study gives credibility to the findings of ARDL's long-run analysis, and it leads one to the conclusion that decision-makers and regulatory bodies need to focus their attention on promoting the expansion of the tourism industry to expedite the process of economic development. Governments in these regions must prioritize regulations to prevent further environmental damage brought on by the tourism industry. Carbon emissions from the tourism industry should be regulated to prevent excessive pollution. Moreover, ecotourism has to be prioritized. To have a minimal effect on the ecology and the culture of a destination while still creating long-term jobs for locals is the goal of sustainable tourism. Sustainable tourism seeks to minimize damage to natural environments and cultural traditions while maximizing financial returns. The 2030 Agenda places sustainable tourism in a central role. The commitment of money, time, and effort to developing the necessary technological know-how, physical facilities, and human capital are essential if this goal is to be realized.
Disclosure statement
No potential conflict of interest was reported by the authors.
Additional information
Funding
References
- Aïssa, M. S. B., Jebli, M. B., & Youssef, S. B. (2014). Output, renewable energy consumption, and trade in Africa. Energy Policy, 66, 11–18.
- Akpan, G. E., & Akpan, U. F. (2012). Electricity consumption, carbon emissions, and economic growth in Nigeria. International Journal of Energy Economics and Policy, 2(4), 292–306.
- Ali, W., Abdullah, A., & Azam, M. (2017a). The dynamic relationship between structural change and CO2 emissions in Malaysia: A cointegrating approach. Environmental Science and Pollution Research International, 24(14), 12723–12739. https://doi.org/10.1007/s11356-017-8888-6
- Ali, W., Abdullah, A., & Azam, M. (2017b). Re-visiting the environmental Kuznets curve hypothesis for Malaysia: Fresh evidence from ARDL bounds testing approach. Renewable and Sustainable Energy Reviews, 77, 990–1000. https://doi.org/10.1016/j.rser.2016.11.236
- Arslanturk, Y., Balcilar, M., & Ozdemir, Z. A. (2011). Time-varying linkages between tourism receipts and economic growth in a small open economy. Economic Modelling, 28(1–2), 664–671.
- Beeton, S. (2006). Community development through tourism. Landlinks Press.
- Butler, R. W. (2000). Tourism and the environment: A geographical perspective. Tourism Geographies, 2(3), 337–358. https://doi.org/10.1080/14616680050082553
- Durbarry, R., & Seetanah, B. (2014). Assessing the impact of tourism and travel on climate change. Journal of Hospitality Marketing & Management, 24(4), 401–410.
- Gössling, S. (2002). Global environmental consequences of tourism. Global Environmental Change, 12(4), 283–302. https://doi.org/10.1016/S0959-3780(02)00044-4
- Gössling, S. (2013). National emissions from tourism: An overlooked policy challenge? Energy Policy, 59, 433–442.
- Gössling, S., & Peeters, P. (2015). Assessing tourism’s global environmental impact 1900–2050. Journal of Sustainable Tourism, 23(5), 639–659.
- Halicioglu, F. (2009). An econometric study of CO2 emissions, energy consumption, income and foreign trade in Turkey. Energy Policy, 37(3), 1156–1164.
- Haug, A. A. (2002). Temporal aggregation and the power of cointegration tests: A Monte Carlo study. Oxford Bulletin of Economics and Statistics, 64(4), 399–412.
- Holden, A. (2016). An introduction to tourism–environment relationships. In Ecotourism and environmental sustainability (pp. 35–48). Routledge.
- Howitt, O. J., Revol, V. G., Smith, I. J., & Rodger, C. J. (2010). Carbon emissions from international cruise ship passengers’ travel to and from New Zealand. Energy Policy, 38(5), 2552–2560.
- Hunter, C., & Green, H. (1995). Tourism and the environment: A sustainable relationship? Routledge.
- Jahanger, A., Chishti, M. Z., Onwe, J. C., & Awan, A. (2022). How far renewable energy and globalization are useful to mitigate the environment in Mexico? Application of QARDL and spectral causality analysis. Renewable Energy, 201, 514–525.
- Jalil, A., Mahmood, T., & Idrees, M. (2013). Tourism–growth nexus in Pakistan: Evidence from ARDL bounds tests. Economic Modelling, 35, 185–191.
- Katircioglu, S. T. (2014). International tourism, energy consumption, and environmental pollution: The case of Turkey. Renewable and Sustainable Energy Reviews, 36, 180–187.
- Lee, J. W., & Brahmasrene, T. (2013). Investigating the influence of tourism on economic growth and carbon emissions: Evidence from panel analysis of the European Union. Tourism Management, 38, 69–76.
- Lukashina, N. S., Amirkhanov, M. M., Anisimov, V. I., & Trunev, A. (1996). Tourism and environmental degradation in Sochi, Russia. Annals of Tourism Research, 23(3), 654–665.
- Lv, J., Wang, N., Ju, H., & Cui, X. (2022). Influence of green technology, tourism, and inclusive financial development on ecological sustainability: Exploring the path toward green revolution. Economic Research-Ekonomska Istraživanja, 1–23.
- Meng, M., & Niu, D. (2011). Modeling CO2 emissions from fossil fuel combustion using the logistic equation. Energy, 36(5), 3355–3359.
- Ouattara, B. (2004). Modelling the long run determinants of private investment in Senegal (No. 04/05). Credit Research Paper.
- Ozturk, I., Aslan, A., & Altinoz, B. (2022). Investigating the nexus between CO2 emissions, economic growth, energy consumption and pilgrimage tourism in Saudi Arabia. Economic Research-Ekonomska Istraživanja, 35(1), 3083–3098.
- Pao, H.-T., & Tsai, C.-M. (2010). CO2 emissions, energy consumption and economic growth in BRIC countries. Energy Policy, 38(12), 7850–7860.
- Peeters, P., Szimba, E., & Duijnisveld, M. (2007). Major environmental impacts of European tourist transport. Journal of Transport Geography, 15(2), 83–93.
- Pesaran, M. H., & Shin, Y. (1995). An autoregressive distributed lag modelling approach to cointegration analysis. https://doi.org/10.1017/CCOL0521633230.011
- Pesaran, M. H., Shin, Y., & Smith, R. J. (2001). Bounds testing approaches to the analysis of level relationships. Journal of Applied Econometrics, 16(3), 289–326.
- Raza, S. A., Shahbaz, M., & Nguyen, D. K. (2015). Energy conservation policies, growth and trade performance: Evidence of feedback hypothesis in Pakistan. Energy Policy, 80, 1–10.
- Saboori, B., & Sulaiman, J. (2013). Environmental degradation, economic growth and energy consumption: Evidence of the environmental Kuznets curve in Malaysia. Energy Policy, 60, 892–905.
- Sbia, R., Shahbaz, M., & Hamdi, H. (2014). A contribution of foreign direct investment, clean energy, trade openness, carbon emissions and economic growth to energy demand in UAE. Economic Modelling, 36, 191–197.
- Scott, D., Peeters, P., & Gössling, S. (2010). Can tourism deliver its “aspirational” greenhouse gas emission reduction targets? Journal of Sustainable Tourism, 18(3), 393–408.
- Sharif, A., Afshan, S., & Nisha, N. (2017). Impact of tourism on CO2 emission: Evidence from Pakistan. Asia Pacific Journal of Tourism Research, 22(4), 408–421.
- Solarin, S. A. (2014). Tourist arrivals and macroeconomic determinants of CO2 emissions in Malaysia. Anatolia, 25(2), 228–241.
- Tang, C. F., & Abosedra, S. (2014). Small sample evidence on the tourism-led growth hypothesis in Lebanon. Current Issues in Tourism, 17(3), 234–246.
- UNWTO. (2018). International tourism trends 2017. https://www.e-unwto.org/doi/pdf/10.18111/9789284419876
- Walmsley, D. J., Boskovic, R. M., & Pigram, J. J. (1983). Tourism and crime: An Australian perspective. Journal of Leisure Research, 15(2), 136–155.
- Wangzhou, K., Wen, J. J., Wang, Z., Wang, H., Hao, C., & Andlib, Z. (2022). Revealing the nexus between tourism development and CO2 emissions in Asia: Does asymmetry matter? Environmental Science and Pollution Research International, 29(52), 79016–79024.
- World Travel & Tourism Council. (2017). Travel & tourism: Economic impact 2017 India. World Travel & Tourism Council.
- WorldBank. (2022). Online database for variables regarding China. https://databank.worldbank.org/source/world-development-indicators
- Yazdi, S. K., Shakouri, B., & Khanalizadeh, B. (2014). The granger causality among tourist arrival, economic growth and CO2 emissions in Iran. Advances in Environmental Biology, 8(13), 632–637.
- Zhang, X.-P., & Cheng, X.-M. (2009). Energy consumption, carbon emissions, and economic growth in China. Ecological Economics, 68(10), 2706–2712.