
 ?Mathematical formulae have been encoded as MathML and are displayed in this HTML version using MathJax in order to improve their display. Uncheck the box to turn MathJax off. This feature requires Javascript. Click on a formula to zoom.
Abstract
Decarbonising the energy industry is an essential aim due to recent environmental disasters and the continued impacts of global warming. Energy technology (E.T.), research and development, and technical innovation are critical to successfully transitioning from fossil fuels to renewables. The current study investigates the role of E.T., renewable electricity output (R.E.T.), R&D expenditures (R.A.D.), technological innovation (T.E.I.) and gross domestic product (G.D.P.) in mitigating territorial-based carbon emissions (CO2) for the five leading emerging economies from 1991 to 2021. The movement quantile regression (M.M.Q.R.) approach demonstrates that E.T., R.A.D., R.E.T. and T.E.I. cut CO2 emissions, whereas G.D.P. increases emissions in targeted nations. E.T. is the fundamental driving force behind decarburisation and the move to greener energy generation and use. The findings are significant because the economies considered are anticipated to benefit from an energy transition to renewables enabled by energy efficiency and environmental technology breakthroughs. In the last section, the study provides relevant policy implications to enrich the literature on the importance of technology and its role in achieving carbon neutrality targets of emerging economies.
JEL CODES:
Introduction
As time has progressed, the prominence of energy technology (E.T.) or energy saving in achieving goals like energy security and carbon emissions has become widely acknowledged (Guo, Liang, et al., Citation2022; Le & Nguyen, Citation2019). There is a lot of evidence to suggest that carbon emissions in both developing and developed economies are significantly impacted by deviations from energy efficiency goals (Javid & Khan, Citation2020; Li et al., Citation2022). To combat the worsening problem of CO2 emissions, energy efficiency has become widely recognised as a feasible low-cost strategy (Guo, Huang, et al., Citation2022; Khan et al., Citation2022; Mahapatra & Irfan, Citation2021). Recent years have seen substantial investments and initiatives undertaken to stimulate energy efficiency improvements, making the effect of energy efficiency on reducing CO2 emissions an important topic for policymakers in both developed and developing economies (Muhammad et al., Citation2022; Özbuğday & Erbas, Citation2015; Vieira et al., Citation2018).
Even though increasing energy efficiency significantly influences the economy and the environment, progress has been slow. The global trend of improving energy efficiency has been declining since 2015, with 2018 recording the slowest rate of improvement in a decade. Because of the COVID-19 pandemic, progress on energy efficiency, which was already slow, has slowed even more. There was a 40% savings in fuel input to power generation due to the decrease in electricity demand. In addition, efficiency improvements have prevented the need for about 10% more coal and 10% more natural gas worldwide. In the face of climate change and environmental pollution, an immediate global switch to renewable energy sources is required (Su, Khan, et al., Citation2021; Umar et al., Citation2022). Despite the significance of the Paris agreement to the energy industry, its implications have not been adequately captured by the current energy scenario. The shift from fossil fuels to low-carbon energy sources is crucial because the energy sector is responsible for 2/3 of all greenhouse gas emissions (Pachauri & Meyer, Citation2014; Su, Li, et al., Citation2022). Technologies, especially those related to renewable energy, will undergo radical change, paving the way for the energy transition (Su, Li, et al., Citation2022). A quarter of the world’s electricity came from renewable sources in 2017, and the transition is not happening fast enough because CO2 emissions remained stable between 2014 and 2016 and increased by 1.4% in 2017 (Renner et al., Citation2018). The Environmental Kuznets Curve hypothesis (E.K.C.) states that G.D.P. contributes to environmental pollution at lower income levels but has the opposite effect once households reach a certain income threshold. From an E.K.C. perspective, it makes sense to point out that advanced economies are reducing their impact on global warming by adopting renewable energy sources and cutting their energy consumption through the use of cutting-edge technology. Growing economies expanded industrial output capability requires massive amounts of energy to sustain domestic markets, much of which is derived from coal and oil. So, most energy-related environmental degradation can be blamed on emerging economies because of their lower incomes and industrial production primarily fueled by fossil fuels. Reducing environmental pollution around the world requires significant efforts in energy-efficient, renewable energies, and technological advances. Progress in technology is expected to make it possible to reach the last level of the E.K.C. hypothesis (Bibi et al., Citation2021; Umar et al., Citation2020; Yin et al., Citation2015). Due to reduced income and energy poverty, developing economies have a harder time affording environment-related technology. The transition from carbon-intensive to renewable energy sources is simpler, cheaper, and quicker in industrialised and wealthy nations than in lower-income ones. Specifically, effective technological advancement in the power sector reduces the deterioration of the environment by boosting the proportion of renewable energy sources and improving energy efficiency (Liang et al., Citation2022; Lu et al., Citation2022; Vukina et al., Citation1999).
The primary objectives of this study is to investigate the empirical impact of E.T., renewable electricity output (R.E.T.), research and development expenditures (R.A.D.), technological innovation (T.E.I.) and gross domestic product (G.D.P.) on territorial-based carbon emission (CO2) for the five emerging economies that are leading the pack. Second, because previous research had not considered the relationship between renewable electricity generation, research and development expenditures, technical innovation, and CO2 emissions, we decided to incorporate these as control variables in our investigation. Third, this study employs a more advanced panel estimation method known as the movement quantile regression (M.M.Q.R.) technique. This method is used for modeling long-term relationships and includes tests for panel unit root and cointegration as well as residual cross-sectional dependency and slope heterogeneity. Quantile regression was the method that we utilised for the investigation of robustness. The following important questions are addressed in this research project: The significance of advances in E.T. in reducing carbon emissions that are regionally based. Which of the observable variables is most responsible for reducing carbon emissions at the territorial level? Are these countries ready to generate electricity from renewable resources? Additionally, are these countries (Brazil, China, India, South Korea, and Turkey) equipped to take advantage of energy efficiency and transformation due to their technological advancements? We answer these questions for a select group of five leading emerging nations from 1991 to 2021.
Following this introduction, the remaining document is provided in the following order. Section 2 elaborates on the most updated and relevant literature of the study. Section 3 deals with the theoretical framework. Section 4 explains Data sources and Model Specifications. Section 5 explains the econometric methodology. Section 6 elaborates on the results and discussion. The conclusion, as well as policy recommendations, are documented in Section 7.
2. Literature review
In recent decades, increasing energy efficiency or E.T. has been recognised as crucial to lowering carbon emissions and ensuring reliable access to energy in all regions of the world. It has been stated that improving energy efficiency has a major effect on carbon emissions in both industrialised and developing countries (Muhammad et al., Citation2022; Wang, Umar, et al., Citation2021). In recent years, energy efficiency has emerged as a viable, less expensive strategy for addressing the growing problem of carbon emissions (Su, Pang, Tao, et al., Citation2022; Ulucak & Khan, Citation2020; Yuan et al., Citation2022). Policymakers in developing and developed countries need to understand the impact of carbon emission mitigation on energy efficiency because of the large-scale efforts and investments launched in recent years to stimulate improvements in energy efficiency (Özbuğday & Erbas, Citation2015). Studying the unequal effects of carbon emissions is one of the most promising new developments in energy conservation. Aspects that affect energy efficiency give rise to the idea of the asymmetrical consequences of energy productivity on pollution and carbon emissions (Wu et al., Citation2022). Consumption patterns, economic expansion, the rebound effect, and the switching between energy types all change in asymmetrical ways throughout time. In the face of asymmetrical shocks in energy productivity, divergent reactions to carbon emissions become readily apparent (Wang, Harindintwali, et al., Citation2021). In the economic expansion phase, the E.K.C. theory predicts that rising energy efficiency will lead to lower CO2 emissions, consequently rising consumer demand for a clean, healthy environment (Shahbaz et al., Citation2020). Increasing renewable energy consumption can mitigate the negative effects of a decline in CO2 emissions, just as an expansion in negative energy consumption shocks leads to an increase in CO2 emissions. Energy consumption behavior is another important link demonstrating that a decrease in energy consumption results in a rise in energy efficiency over time due to energy conservation (Usman et al., Citation2020). Positive energy efficiency shocks are projected to lead to a proportional reduction in CO2 emissions, while negative energy efficiency shocks are predicted to result in a less proportional increase in carbon emissions (Akram et al., Citation2020). The economic and bounded influence has similar imperative consequences on producing asymmetric effects. Increases in energy efficiency, for instance, have rebound effects on the economy and lead to a smaller-than-anticipated decrease in carbon dioxide (CO2) emissions (Ghoddusi & Roy, Citation2017; Li & Wang, Citation2017). Research has shown that there may be no rebound effects from a rise in CO2 emissions caused by a rise in energy efficiency’s negative aspects (Gillingham et al., Citation2016). He et al. (Citation2021) recently applied a multi-objective optimisation model, and the industrial correlation model was used in China’s industrial sector (He et al., Citation2021). They found that, under the fast economic growth scenario, CO2 emissions may be decreased by 58.31% through increased energy efficiency. However, if growth rates were too slow to medium levels, then increased energy efficiency could reduce CO2 emissions by 55.88%. In addition, a recent study by Imran et al. (Citation2020) investigates the importance of energy efficiency in agriculture, and comparable studies have found the same thing for the construction industry (Kamal et al., Citation2019; Zhou et al., Citation2018), the port container terminal (Martínez-Moya et al., Citation2019) and the highly energy-intensive manufacturing sector (Li & Tao, Citation2017).
No economy can function without electricity, yet its use and production have substantial environmental implications that must be scrutinised. A country’s reliance on fossil fuels can be gauged partly by looking at the percentage of its overall electrical output sourced from such sources. (Rahman, Citation2020) analysed the effects of electricity use on CO2 emissions in the context of the top 10 energy-consuming nations while taking into account the effects of globalisation and rising incomes. Findings from the FMOLS and DOLS analyses revealed that increasing energy derived primarily from fossil fuels increased atmospheric carbon dioxide levels. Consistent with the findings of Saint Akadiri et al. (Citation2020) and Jiang et al. (Citation2021), they discovered that energy use raises CO2 emissions in China and Turkey. Numerous studies have highlighted the value of renewable electricity sources in cutting carbon dioxide emissions, even though overall electricity usage was shown to cause more emissions in most circumstances (Sinha & Shahbaz, Citation2018). Specifically, Bento and Moutinho (Citation2016) employed the A.R.D.L. model with annual data from 1960 to 2011 and discovered that an increase in the amount of renewable electricity production per capita corresponds to a decrease in the numbers of Italy’s CO2 emissions. The authors concluded that renewable electricity generation is crucial in proving the E.K.C. hypothesis in the Italian setting. Balsalobre-Lorente et al. (Citation2018) looked at the situation in five E.U. member states and found that using renewable electricity consumption helped reduce CO2 emissions. Furthermore, hydroelectricity consumption in Malaysia is used as a proxy for renewable electricity consumption, Bello et al. (Citation2018) concluded that while using electricity generated from fossil fuels increases CO2 emissions and other environmental harms, using hydroelectricity as a proxy for renewable electricity consumption is more accurate.
Most econometric studies conclude that investing in research and development has a negative effect on CO2 emissions, although this conclusion is based on the flawed use of outdated methods. Unit root and cointegration tests have been used in studies of time series samples Shahbaz et al. (Citation2018) even though these tests have low statistical power for shorter time series in particular. In contrast to time series analysis, panel data analysis considers both the data’s longitudinal and cross-sectional aspects. However, two studies that examine this connection in a more general setting deserve special attention. While Churchill et al. (Citation2019) and Li and Wang (Citation2022) both look at the effect of research and development expenditures on carbon emissions, they do so from different vantage points. According to Churchill et al. (Citation2019), the findings are contradictory, with a negative influence over roughly three-quarters of the period covered by the study and a positive influence over the remaining period. A detrimental impact on total CO2 emissions was noted by Li and Wang (Citation2017). Both the size effect and the emission intensity effect contribute to the paradoxical effect of research and development on CO2 emissions. Churchill et al. (Citation2019) achieved success on two fronts. The authors began with the assumption that the correlation between R&D spending and carbon dioxide emissions is long-lasting. Thus, they estimated their regression models using long-time window data. Using a non-parametric estimator that considered both cross-sectional and longitudinal data trends and coefficient functions was also a major step forward in this study’s methodology.
T.E.I., one of the main factors in reducing environmental emissions, has been reviewed by many scholars. For instance, from 1990 to 2014, Mensah et al. (Citation2018) looked at the relationship between T.E.I. and CO2 emissions in 28 Organization for Economic Co-operation and Development (O.E.C.D.) countries. The research results corroborate the idea that cutting-edge technology helps lessen the impact of the world’s carbon footprint. Each member country of the O.E.C.D. group has a slightly different channel due to its unique access to various other channels. The findings, however, could not establish that the E.K.C. exists for the selected countries. Energy intensity in 14 distinct industries across 17 O.E.C.D. nations was evaluated by Wurlod and Noailly (Citation2018) between 1975 and 2005. Results show that green innovation helps these countries cut down on energy use. Conversely, between 1955 and 2016, Shahbaz et al. (Citation2018) investigated the link between foreign direct investment (F.D.I.), economic growth, and power technology innovation in France. While F.D.I. contributes to higher carbon emissions, technological advances in the energy and financial sectors help reduce these emissions. Alvarez-Herranz et al. (Citation2017) examined the same relationship between G.H.G. emissions and energy innovation in 28 O.E.C.D. countries between 1990 and 2014. The outcomes show that energy innovation can aid in reducing carbon emissions; nevertheless, proper timing is essential for realising the full potential of such technologies.
As explained earlier, the mechanism between the variables in the literature review section is noted that an increasing proportion of E.T. in most countries reduced carbon emissions. Similarly, research and development expenditure boosted the green economics system, reducing territorial-based carbon emissions. Furthermore, it has been noticed from the previous literature that those countries that adopt renewable energy consumption and accept T.E.I. will lead the country in the right direction and create a green economy that ultimately reduces emissions.
3. Theoretical framework
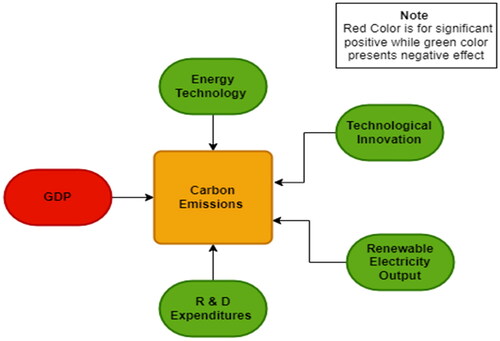
Non-renewable energy consumption and production degrade air, water, and land in many ways. It seems to reason that reducing wasteful energy production will improve environmental conditions. By using technology to replace gas-powered cars with electric or hybrid ones, we can cut back on energy use and pollution. Similarly, the amount of energy needed to create and the number of emissions emitted can be lowered by increasing the efficiency with which electricity is generated and used with the help of technical progress and renewables. Consequently, we anticipate that E.T. will have a negative effect on territorial-based carbon emissions in the targeted economies, i.e.,
By reducing the risk effects in R&D activities, the theoretical connection between R&D spending and the green environment set by a government provides an incentive effect and contributes to the innovation process. Incorporating this method into production aids in creating green technology consumers use at home. Additionally, these funds are used to subsidies and incentivise the use of green technologies by various businesses (Du et al., Citation2016; Kwon et al., Citation2017; Su, Rizvi, Naqvi, et al., Citation2022; Zhao et al., Citation2019). Hence, it is expected that research and development expenditures will have a negative effect on territorial-based carbon emissions, i.e.,
Moreover, the primary energy resource used to create electricity can impact CO2 emissions. Examples include the assumption that countries with higher reliance on energy generation from fossil fuels are more polluting than those with lower reliance. Thus, it is widely accepted that switching from conventional to renewable sources of electricity generation can help reduce carbon dioxide emissions. Additionally, renewable electricity generation is cited as a viable tool for disentangling economic expansion from CO2 emissions (York & McGee, Citation2017). Positive environmental effects of increasing the proportion of R.E.T. shares and further boosting a green economic system and reducing territory-based carbon emissions i.e.,
The territorial-based carbon emissions can be lowered by T.E.I., particularly by replacing outdated methods with newer, greener ones. These technical advancements can potentially increase demand for products and production methods that use less energy, mitigating carbon dioxide emissions’ negative effects. As a result, if T.E.I. is eco-friendly i.e., it will be met with hopes of lesser carbon emissions.
In addition to putting billions of lives in constant danger, the environment is also seriously threatened by the world’s rapid rise in output. Constant growth in G.D.P. has increased the need for energy, which in turn has increased carbon emissions (Destek & Sarkodie, Citation2019; Zhang et al., Citation2016). Increasing productivity also has a negative effect on the environment because of the uncontrolled use of resources. As a result, an increase in G.D.P. should lead to higher carbon emissions, i.e., ().
Figure 1. Conceptual framework of this study.
Source: Authors.
4. Data and model specification
This research aims to examine the effect of E.T. on territorial-based carbon emission along with other control variables such as research and development expenditures, R.E.T., T.E.I., and G.D.P. in five leading emerging economies from 1991 to 2021. Panel data provides a rich and dynamic way to analyse problems and underlying components (Tufail, Song, Ali, et al., Citation2022). It broadens the writer’s argument, improves the results, and helps draw clear, logical inferences. The data for the territorial-based carbon emission is collected from the global carbon atlas, while the other mentioned variables are obtained from World Bank (Citation2021). The general specification of the model is given below.
(1)
(1)
In EquationEquation (1)(1)
(1) , the cross-sections are denoted
i.e., Turkey, South Korea, India, China and Brazil.
Is for a time period from 1991 to 2021. The basic regression from EquationEquation (1)
(1)
(1) is given below.
(2)
(2)
where
denotes those emissions of carbon dioxide (CO2) emissions within a country’s borders (territorially-based emissions or production emissions), including exports but excluding imports.
Represents E.T. This is the purchasing power parity G.D.P. per kilo of oil equivalent energy use. The G.D.P. at current international purchasing power parity exchange rates for 2017 is called P.P.P. G.D.P. When converted to G.D.P., the value of a dollar anywhere in the world is the same as that of a dollar in the United States.
The buyer’s price is calculated as the sum of the gross value contributed by all domestic producers in the economy plus any applicable product taxes and minus any applicable subsidies.
Renewable electricity is the proportion of total electricity produced by all types of plants that renewable power plants generate.
Expresses business, government, higher education, and private non-profits are all represented, as are their respective capital and operating expenditures on R&D. Research and development (R&D) encompasses theoretical and practical endeavors. To be clear,
Patent applications are resident and nonresident applications for patents filed globally through the Patent Cooperation Treaty system. The
is cross-section error term and
is the error term ().
Table 1. Variables and sources’ nomenclature.
5. Econometric methodology
5.1. Residual cross-sectional dependence test
It is common for cross-section reliance to emerge due to regional and global interdependence among nations (C.D.). It’s crucial to keep an eye on C.D. since it can lead to inconsistent and unfair results when measuring progress if it’s not managed. Therefore, cross-section dependence automatically exists in the panel data (De Hoyos & Sarafidis, Citation2006). This is the Lagrange Multiplier (L.M.) cross-section dependence test developed by (Breusch):
(3)
(3)
In this case, represents asymptotic circulation for N fixed as
for all
where
denotes the correlation coefficients. Pesaran (Citation2004), however, claims that the L.M. test developed by (Breusch) does not allow for flexible N values. Based on his research, Pesaran (Citation2004) proposed the following description of the C.D. L.M. test:
(4)
(4)
Pesaran suggested, and then
so doing. In addition, Pesaran (Citation2004) provided alternative statistics derived from the pairwise average correlations coefficient
to compensate for the sizing distortion of
and
(5)
(5)
It is a normal and asymptotic standard for and
. To summarise what Pesaran said, for a large panel of data,
for all
and all
As a result, we utilise all of the C.D. tests in our empirical calculations.
5.2. Slope heterogeneity test
In addition, slope heterogeneity is another possible concern that is most certainly present in the panel data. This issue, together with cross-sectional dependence, has the potential to compromise the reliability and objectivity of the findings. For this reason, it is crucial to examine the panel data for evidence of slope heterogeneity. Following the method of Pesaran (Citation2021), we utilise the following test equations in this investigation. The basic general equation for the slope heterogeneity test is given below.
(6)
(6)
5.3. Unit root tests
The conventional unit root tests were once the standard method for investigating the reliability of a single time series at a time. On the other hand, testing for a unit root in a panel structure is a relatively recent approach with far more complex asymptotic features that depend strongly on the presumed structure of the data to be evaluated. To determine whether or whether our findings are applicable across a wide range of criteria and theoretical frameworks, we have conducted an extensive battery of experiments. Instead of conducting individual unit root tests for each sample (Levin et al., Citation2002), advise using a panel unit root test. This test is expected to yield more precise results. The null hypothesis asserts that not only must each time collection have a unit root, but also that each time collection must begin at a unit root (the alternative hypothesis). No changes have been made to the collection. The form of the structure to be tested resembles that of a panel-based framework subjected to the augmented Dickey-Fuller (A.D.F.) analysis. The formula is absurd.
(7)
(7)
It has been stated that the LLC test needs to be standardised. To test for an average unit root Im et al. (Citation2003) permits a heterogeneous coefficient on The calculated model can be obtained by solving the EquationEquation (1)
(1)
(1) . According to the null hypothesis
all panel series have unit roots.
which states that few series have unit roots while others are stationary. Below, we present the aggregate of
independent A.D.F. statistics, representing the I.P.S. t statistic.
(8)
(8)
Our analysis included not just the standard L.L.C. and I.P.S. tests but also three additional, more sophisticated panel root tests. Several problems with the previous tests were addressed in this round of testing. The Breitung (Citation2001) test outperforms the L.L.C. and I.P.S. tests in Monte Carlo simulations, and so do the A.D.F. Fisher chi-square test, the Pesaran I.P.S., and the P.P. fisher chi-square tests for the remainder of the panel’s unit root in each sample.
5.4. Panel cointegration tests
To determine whether the variables were truly cointegrated over the long term, we used a cointegration test (Kao, Citation1999). Four different D.F.-type panel cointegration tests, all based on O.L.S. residuals from the homogeneous panel regression, were designed by Kao. Kao tests the potential for cointegration in multiple panels using an A.D.F.-style panel cointegration test. In this beta version, we allow some parameter variation between iterations. The residuals are non-stationary under the null hypothesis that there is no cointegration but stationary under the alternative hypothesis (there is a cointegrating association between the variables). The research also makes use of another type of panel cointegration test, the Johansen-Fisher test. The authors provide a unique method for assessing cointegration in panel data, which takes cues from Fisher’s approach by merging tests from various cross-sections into a single test statistic for the full panel. The Fisher test (also known as the Johansen-Fisher test) is commonly used to conduct a panel version of the Johansen cointegration test. You can run the Johansen Fisher panel cointegration test if you have the trace statistic and the average p-values of the individual Johansen optimal eigenvalues. The absence of cointegration was taken as the null hypothesis, as in other residual cointegration experiments (Kao, Citation1999). However, the significant estimates may instead favor a model in which the variables are linked in the long run through a process known as cointegration.
5.5. Method of movement quantile regression
Due to limitations in prior evaluation methodologies, panel quantile regression is used across quantiles to investigate distributional and heterogeneity impacts (Sarkodie & Strezov, Citation2018). Panel quantile regression was developed in 1978 by Koenker and Bassett (Citation1978). Quantile regressions analyse the conditional mean of several dependent variables in light of explanatory variables. This is because, in contrast to least squares regression, it determines the conditional mean of the explanatory criterion. Quantile regression is more robust against outliers all through the estimation process. The optimal time to use this method is when the conditional procedures involving two variables are disorganised. Applying a fixed-impacts approach to the M.M.Q.R., we conducted the analysis shown here (Machado & Silva, Citation2019). However, unobserved panel diversity is a problem for quantile regression. By allowing the specific influence to affect the entire distribution, this method reflects the conditional heterogeneous covariance effects of the CO2 variable, as opposed to merely changing methods like Canay (Citation2011) and (Bayesian Computational Analysis of CO2 Emissions) Koenker (Citation2004). With this method, you may account for both private effects and endogenous variables. Since quantile regression produces non-crossing price quotations, it is simple to implement. Conditional quantile estimates for the location-scale alternative design are given in the following equation.
(9)
(9)
6. Results and discussion
Results from the econometric analysis are presented here, along with discussions of their interpretation and the estimates they yield. This section begins with an analysis of 's descriptive statistics. According to the obtained estimates, the average, median, and maximum values across the board are all on the bright side. It is further proof that the factors at play are progressive. Moreover, the study found that there was a consistent gap between the range values of the variables, suggesting a contradictory trend. Accordingly, the standard deviation value is assessed in this study, lending credence to the erratic trends observed in CO2, G.D.P., E.T., R.E.T., R.A.D., and T.E.I. over the interval under consideration.
Table 2. Descriptive statistics.
In addition, this research employs two fundamental tests, slope coefficient heterogeneity and cross-sectional dependency to isolate the panel data problems. In , we present the empirical estimates for these examinations. Both the raw delta and the delta adjusted are statistically significant at the 1% level, as indicated by the estimated results of the slope coefficient heterogeneity test. As a result, the slope coefficients are not homogeneous, as suggested by the Null hypothesis (Pesaran et al., Citation2008). Because of this, we can safely assume that the economies of the world vary in terms of their economies, politics, energies, capital, and so on. On the other hand, the estimated result of the C.D. test shows that the variables have statistically significant results. As a result, we might infer that the cross-sectional dependence holds for these five prominent emerging economies. The C.D. test’s significant estimates indicated that any kind of shock in one country could have a knock-on effect on the indicators of the other countries.
Table 3. The results of residual cross-section dependence and slope heterogeneity test.
Results from panel unit root tests based on the five methods test for all variables used in modeling the effect of E.T. on territorial-based carbon emissions are presented in . These variables include R&D expenditures, R.E.T., T.E.I., and G.D.P. in five emerging economies. The CO2, E.T., G.D.P., R.E.T., R.A.D., and T.E.I. are at the level of insignificance for accepting the null of a unit root, according to the Levin et al. (Citation2002) method test. Additionally, methods based on the A.D.F.-Fisher Chi-square test by Breitung (Citation2001), Choi (Citation2001), Im et al. (Citation2003) and Maddala and Wu (Citation1999), show that all the variables have a unit root. According to the panel unit root test findings, all of the variables employed in this model have unit roots. Thus, the panel unit root test findings based on five approaches are shown in . All variables should be taken first differing or taken second varying as well as after taking first differing in all variables. All five test results show that E.T., CO2, G.D.P., R.E.T., R.A.D. and T.E.I. become stationary at first difference.
Table 4. Panel unit root testing.
The outcomes of the panel Cointegration test for the impact of E.T. on territorial-based carbon emission and other control variables in five developing economies from 1991 to 2021 are shown in . Both the Kao Residual Cointegration test and the Johansen Fisher Panel Cointegration test have been utilised. Most of these methods were used to disprove the null hypothesis, which means that all of the model’s variables were statistically significant (no Cointegration). The empirical results show that most of the variables used in this article are linked in the long run.
Table 5.
M.M.Q.R. is used in this study to obtain statistical estimates at a given scale, location, and quantile after the long-term relationships between the variables have been determined. shows the predicted outcomes of the aforementioned method. Empirical evidence demonstrates that E.T. has a negative effect on CO2 concentrations throughout the board. The empirical results show that ET influences CO2 across all quantiles. Specifically, the E.T. increases the CO2 in all described quantiles, i.e., Q0.25, Q0.50, Q0.75 and Q0.90, which is significant at a 1% level, meaning that it has a negative effect on CO2 emission. In Q0.25, Q0.50, Q0.75 and Q0.90, a 1% increase in E.T. decreased by −0.063, −0.68, 0.73 and 0.76%, respectively. E.T. has the potential to improve energy security, make better use of available energy resources, boost industrial performance, and lower operating costs for five rapidly developing countries (India, Turkey, Brazil, China and South Korea). It is also possible that these countries’ production, construction, and transportation operations if they used less energy overall, would lead to lower CO2 emissions. These countries’ energy departments have launched various programs to improve energy efficiency and cut carbon dioxide output. In 2006, for instance, the Indian government mandated appliance standards and labeling systems, giving people the tools they needed to make energy-efficient purchasing decisions. The Energy Conservation Building Code (E.C.B.C.) was enacted that same year. Indian authorities unveiled their National Electric Mobility Mission Plan (N.E.M.M.P.) for 2020 that year. Its goal is to strengthen national energy security by promoting the adoption of hybrid and electric automobiles. Sales of hybrid and electric vehicles are projected to hit a lofty 6–7 million yearly by 2020 and beyond. India hopes to achieve its ‘net-zero’ carbon objective by 2070, and the government plans to provide financial and economic incentives to kick-start this emerging technology. Our outcomes are similar to the findings of Mirza et al. (Citation2022), Su, Song, et al. (Citation2021) and Tufail, Song, Umut, et al. (Citation2022).
Table 6.
In the case of R.E.T., it shows that there is a negative and significant relationship with territorial-based carbon emission in all quantiles. In the Q0.25, Q0.50, Q0.75 and Q0.90 a 1% increase in R.E.T. decreased −0.32, −0.33, −0.34 and −0.35%, respectively. These point to the possibility of reducing CO2 emissions by switching to renewable electricity and reducing the usage of fossil fuels in the power sectors of these five developing economies. Additionally, the significantly higher long-run elasticity values imply that progressively reducing the associated emissions while increasing the percentage of renewable electricity supply contributes to positive environmental effects. Our results are similar to the findings of Balsalobre-Lorente et al. (Citation2018), Bello et al. (Citation2018) and Qin et al. (Citation2022).
Moreover, the research and development expenditure case show a negative and significant relationship with territorial-based carbon emission in all quantiles. In Q0.25, Q0.50, Q0.75 and Q0.90, a 1% increase in research and development expenditures decrease by −0.78, −0.85, −0.91 and −0.95%, respectively. Spending on research and development appears to have a negative effect on emissions, indicating an inverted U-shaped relationship. Spending on R&D and greenhouse gas emissions may lend credence to the E.K.C. hypothesis. Regarding the validation of R&D E.K.C., the empirical results concur with those published by O.E.C.D. countries (Mensah et al., Citation2018). The findings imply that sustained spending on R&D and creative solutions can assist our five target emerging economies to achieve their net-zero emission targets (Su et al., Citation2019).
Furthermore, the targeted economies show a negative relationship between T.E.I. and carbon emissions that are based on territory. It is observed in that a 1% increase in research and development expenditures decreased by −0.10, −0.09, −0.08 and −0.07%, respectively. Technology innovation significantly reduces carbon emissions and improves the economy’s environmental performance, tremendously facilitating the transition to a more sustainable energy source. A nation can use policy R.F.s to promote innovation without placing significant taxes on businesses to enhance environmental performance and reduce carbon emissions. These outcomes lend credibility to the findings (Zhang, Citation2017).
Finally, the G.D.P. positively correlates with territorial-based carbon emission in overall quantiles. It is observed that a 1% increase in G.D.P. will increase by 1.42, 1.40, 1.39 and 1.38%, respectively. This can be explained by the rising temperatures caused by increased demand for fossil fuels and the enormous environmental stress that economic growth causes. As a result, these nations’ environmental quality deteriorates as they work to achieve rapid economic expansion. Carbon dioxide emissions might be considered an unavoidable side effect of industrialisation. These outcomes are similar to the findings of Khan et al. (Citation2020) and Tufail et al. (Citation2021).
This study also applied quantile regression to verify the empirical outcomes of the prior estimator and as a check on robustness. This research examined the impact of E.T. on carbon dioxide emissions in five selected leading emerging economies and reported the results of robustness testing. The outcomes of this study give empirical evidence that advances in E.T. have a detrimental effect on carbon emissions from the terrestrial environment. In addition, negative associations with economic performance are discovered at the 10%, 5% and 1% levels for R&D spending, T.E.I., and R.E.T., respectively. Nonetheless, all quantile results find that G.D.P. is both positive and significant. Consequently, the empirical results of the M.M.Q.R. method are supported by the results of the robustness test. To cut territorial-based carbon emissions in the five leading emerging economies, new and appropriate policies relating to E.T. are required ().
Table 7.
7. Conclusion and policies
This study contributes to the body of knowledge by examining the E.T. effects on CO2 emissions from territorial bases, taking into account important control variables that have been missed in previous research. This research is based on panel data analysis of five emerging economies from 1991 to 2021. The study includes R.E.T., R&D expenditures, T.E.I., G.D.P., and CO2 emissions. This study firstly examined the problem of residual cross-section dependence and slope homogeneity issue of each variable through different tests. Furthermore, to check the stationary issue, this study has applied five different unit root tests to observe the unit properties among the variables. The long-run cointegrating link among the variables has been examined through Kao Residual and Johansen Fisher panel cointegration tests, which shows that there is a long-run association among the targeted variables. The long-run results are estimated by using the M.M.Q.R. The overall outcomes show that E.T., R.E.T., R&D expenditures, and T.E.I. have a significant negative relationship with carbon emissions. However, the G.D.P. boosts territorial-based carbon emissions.
7.1. Policy recommendations
We outline the most significant and crucial policy recommendations based on our findings, which are. To achieve a consistent decrease in environmental pollution, the governments of these economies must first reform and execute energy and environmental policies and programs focused on green growth. For instance, monetary and fiscal reforms targeted toward green growth can be used to boost E.T. These economies can compensate for decreases in energy efficiency by promoting an immediate substitution effect between energy and other inputs. Promoting eco-friendly technologies would increase the effectiveness of these economies’ energy systems. The production of alternative energy sources requires additional investment from these economies. Governments should therefore increase their spending on research into alternate energy sources and energy efficiency. The nonlinear nature of energy efficiency and renewable energy utilisation should be considered in environmental and green growth initiatives. These nations’ governments ought to support energy efficiency initiatives with financial contributions. Manufacturers should be given low-interest loans from the government so they may integrate energy-saving technologies into their processes. The usage of energy-saving home devices should be promoted by the government as well.
7.2. Limitation and future direction
Finally, we will discuss our research’s limitations and offer suggestions for future studies. At first, it was thought that researchers would be interested in studying all the leading emerging nations. Due to space limitations, we could only include five nations in our final selections. The COVID-19 economic crisis, for example, is one of the most recent modifications. Thus, it would be wise to plan on conducting further studies in the future that does so. Another factor is that we mostly concentrated on leading rising economies. The findings of this study can be applied to future assemblies of nations with similar demographics, such as the B.R.I.C.S. and O.E.C.D. It is possible to consider the impact of energy poverty and financial inclusion in future research.
Disclosure statement
No potential conflict of interest was reported by the authors.
Additional information
Funding
References
- Akram, R., Chen, F., Khalid, F., Ye, Z., & Majeed, M. T. (2020). Heterogeneous effects of energy efficiency and renewable energy on carbon emissions: Evidence from developing countries. Journal of Cleaner Production, 247, 119122.
- Alvarez-Herranz, A., Balsalobre-Lorente, D., Shahbaz, M., & Cantos, J. M. (2017). Energy innovation and renewable energy consumption in the correction of air pollution levels. Energy Policy, 105, 386–397.
- Balsalobre-Lorente, D., Shahbaz, M., Roubaud, D., & Farhani, S. (2018). How economic growth, renewable electricity and natural resources contribute to CO2 emissions? Energy Policy, 113, 356–367.
- Bello, M. O., Solarin, S. A., & Yen, Y. Y. (2018). The impact of electricity consumption on CO2 emission, carbon footprint, water footprint and ecological footprint: The role of hydropower in an emerging economy. Journal of Environmental Management, 219, 218–230.
- Bento, J. P. C., & Moutinho, V. (2016). CO2 emissions, non-renewable and renewable electricity production, economic growth, and international trade in Italy. Renewable and Sustainable Energy Reviews, 55, 142–155.
- Bibi, A., Zhang, X., & Umar, M. (2021). The imperativeness of biomass energy consumption to the environmental sustainability of the United States revisited. Environmental and Ecological Statistics, 28(4), 1–21. https://doi.org/10.1007/s10651-021-00500-9
- Breitung, J. (2001). The local power of some unit root tests for panel data. In Nonstationary panels, panel cointegration, and dynamic panels (pp. 161–177). Emerald Group Publishing Limited.
- Canay, I. A. (2011). A simple approach to quantile regression for panel data. The Econometrics Journal, 14(3), 368–386.
- Choi, I. (2001). Unit root tests for panel data. Journal of International Money and Finance, 20(2), 249–272.
- Churchill, S. A., Inekwe, J., Smyth, R., & Zhang, X. (2019). R&D intensity and carbon emissions in the G7: 1870–2014. Energy Economics, 80, 30–37.
- De Hoyos, R. E., & Sarafidis, V. (2006). Testing for cross-sectional dependence in panel-data models. The Stata Journal, 6(4), 482–496.
- Destek, M. A., & Sarkodie, S. A. (2019). Investigation of environmental Kuznets curve for ecological footprint: The role of energy and financial development. The Science of the Total Environment, 650(Pt 2), 2483–2489. https://doi.org/10.1016/j.scitotenv.2018.10.017
- Du, H., Matisoff, D. C., Wang, Y., & Liu, X. (2016). Understanding drivers of energy efficiency changes in China. Applied Energy, 184, 1196–1206.
- Ghoddusi, H., & Roy, M. (2017). Supply elasticity matters for the rebound effect and its impact on policy comparisons. Energy Economics, 67, 111–120.
- Gillingham, K., Rapson, D., & Wagner, G. (2016). The rebound effect and energy efficiency policy. Review of Environmental Economics and Policy, 10, 1–22.
- Global Carbon Atlas. (2021). http://www.globalcarbonatlas.org/en/content/welcome-carbon-atlas.
- Guo, X., Huang, Y., Liang, C., & Umar, M. (2022). Forecasting volatility of EUA futures: New evidence. Energy Economics, 110, 106021. https://doi.org/10.1016/j.eneco.2022.106021
- Guo, X., Liang, C., Umar, M., & Mirza, N. (2022). The impact of fossil fuel divestments and energy transitions on mutual funds performance. Technological Forecasting and Social Change, 176, 121429. https://doi.org/10.1016/j.techfore.2021.121429
- He, Y., Liao, N., & Lin, K. (2021). Can China’s industrial sector achieve energy conservation and emission reduction goals dominated by energy efficiency enhancement? A multi-objective optimization approach. Energy Policy, 149, 112108.
- Im, K. S., Pesaran, M. H., & Shin, Y. (2003). Testing for unit roots in heterogeneous panels. Journal of Econometrics, 115(1), 53–74.
- Imran, M., Özçatalbaş, O., & Bashir, M. K. (2020). Estimation of energy efficiency and greenhouse gas emission of cotton crop in South Punjab, Pakistan. Journal of the Saudi Society of Agricultural Sciences, 19(3), 216–224.
- Javid, M., & Khan, M. (2020). Energy efficiency and underlying carbon emission trends. Environmental Science and Pollution Research International, 27(3), 3224–3236. https://doi.org/10.1007/s11356-019-07019-4
- Jiang, Q., Khattak, S. I., & Rahman, Z. U. (2021). Measuring the simultaneous effects of electricity consumption and production on carbon dioxide emissions (CO2e) in China: New evidence from an EKC-based assessment. Energy, 229, 120616.
- Kamal, A., Al-Ghamdi, S. G., & Koç, M. (2019). Role of energy efficiency policies on energy consumption and CO2 emissions for building stock in Qatar. Journal of Cleaner Production, 235, 1409–1424.
- Kao, C. (1999). Spurious regression and residual-based tests for cointegration in panel data. Journal of Econometrics, 90(1), 1–44.
- Khan, F. U., Murtaza, A. F., Sher, H. A., Al-Haddad, K., & Mustafa, F. (2020). Cabling constraints in PV array architecture: Design, mathematical model and cost analysis. IEEE Access, 8, 182742–182754.
- Khan, K., Su, C.-W., Khurshid, A., & Umar, M. (2022). COVID-19 impact on multifractality of energy prices: Asymmetric multifractality analysis. Energy, 256, 124607. https://doi.org/10.1016/j.energy.2022.124607
- Koenker, R. (2004). Quantile regression for longitudinal data. Journal of Multivariate Analysis, 91(1), 74–89.
- Koenker, R., & Bassett, G., Jr. (1978). Regression quantiles. Econometrica: Journal of the Economic Society, 46(1), 33–50.
- Kwon, D. S., Cho, J. H., & Sohn, S. Y. (2017). Comparison of technology efficiency for CO2 emissions reduction among European countries based on DEA with decomposed factors. Journal of Cleaner Production, 151, 109–120. https://doi.org/10.1016/j.jclepro.2017.03.065
- Le, T.-H., & Nguyen, C. P. (2019). Is energy security a driver for economic growth? Evidence from a global sample. Energy Policy, 129, 436–451. https://doi.org/10.1016/j.enpol.2019.02.038
- Levin, A., Lin, C.-F., & Chu, C.-S. J. (2002). Unit root tests in panel data: Asymptotic and finite-sample properties. Journal of Econometrics, 108(1), 1–24. https://doi.org/10.1016/S0304-4076(01)00098-7
- Li, M., & Wang, Q. (2017). Will technology advances alleviate climate change? Dual effects of technology change on aggregate carbon dioxide emissions. Energy for Sustainable Development, 41, 61–68. https://doi.org/10.1016/j.esd.2017.08.004
- Li, M.-J., & Tao, W.-Q. (2017). Review of methodologies and polices for evaluation of energy efficiency in high energy-consuming industry. Applied Energy, 187, 203–215. https://doi.org/10.1016/j.apenergy.2016.11.039
- Li, X., Li, Z., Su, C.-W., Umar, M., & Shao, X. (2022). Exploring the asymmetric impact of economic policy uncertainty on China’s carbon emissions trading market price: Do different types of uncertainty matter? Technological Forecasting and Social Change, 178, 121601. https://doi.org/10.1016/j.techfore.2022.121601
- Li, Z., & Wang, J. (2022). The dynamic impact of digital economy on carbon emission reduction: Evidence city-level empirical data in China. Journal of Cleaner Production, 351, 131570. https://doi.org/10.1016/j.jclepro.2022.131570
- Liang, C., Umar, M., Ma, F., & Huynh, T. L. (2022). Climate policy uncertainty and world renewable energy index volatility forecasting. Technological Forecasting and Social Change, 182, 121810. https://doi.org/10.1016/j.techfore.2022.121810
- Lu, Z., Gozgor, G., Mahalik, M. K., Padhan, H., & Yan, C. (2022). Welfare gains from international trade and renewable energy demand: Evidence from the OECD countries. Energy Economics, 112, 106153. https://doi.org/10.1016/j.eneco.2022.106153
- Machado, J. A., & Silva, J. S. (2019). Quantiles via moments. Journal of Econometrics, 213(1), 145–173. https://doi.org/10.1016/j.jeconom.2019.04.009
- Maddala, G. S., & Wu, S. (1999). A comparative study of unit root tests with panel data and a new simple test. Oxford Bulletin of Economics and Statistics, 61(S1), 631–652. https://doi.org/10.1111/1468-0084.0610s1631
- Mahapatra, B., & Irfan, M. (2021). Asymmetric impacts of energy efficiency on carbon emissions: A comparative analysis between developed and developing economies. Energy, 227, 120485. https://doi.org/10.1016/j.energy.2021.120485
- Martínez-Moya, J., Vazquez-Paja, B., & Maldonado, J. A. G. (2019). Energy efficiency and CO2 emissions of port container terminal equipment: Evidence from the Port of Valencia. Energy Policy, 131, 312–319. https://doi.org/10.1016/j.enpol.2019.04.044
- Mensah, C. N., Long, X., Boamah, K. B., Bediako, I. A., Dauda, L., & Salman, M. (2018). The effect of innovation on CO2 emissions of OCED countries from 1990 to 2014. Environmental Science and Pollution Research International, 25(29), 29678–29698.
- Mirza, N., Rizvi, S. K. A., Saba, I., Naqvi, B., & Yarovaya, L. (2022). The resilience of Islamic equity funds during COVID-19: Evidence from risk adjusted performance, investment styles and volatility timing. International Review of Economics & Finance, 77, 276–295. https://doi.org/10.1016/j.iref.2021.09.019
- Muhammad, S., Pan, Y., Agha, M. H., Umar, M., & Chen, S. (2022). Industrial structure, energy intensity and environmental efficiency across developed and developing economies: The intermediary role of primary, secondary and tertiary industry. Energy, 247, 123576. https://doi.org/10.1016/j.energy.2022.123576
- Özbuğday, F. C., & Erbas, B. C. (2015). How effective are energy efficiency and renewable energy in curbing CO2 emissions in the long run? A heterogeneous panel data analysis. Energy, 82, 734–745. https://doi.org/10.1016/j.energy.2015.01.084
- Pachauri, R. K., & Meyer, L. A. (2014). Climate change 2014: Synthesis report. Contribution of working groups I, II and III to the fifth assessment report of the Intergovernmental Panel on Climate Change. The World Meteorological Organization (WMO) and the United Nations Environment Programme (UNEP).
- Pesaran, M. H. (2004). General diagnostic tests for cross section dependence in panels. Mimeo, University of Cambridge.
- Pesaran, M. H. (2021). General diagnostic tests for cross-sectional dependence in panels. Empirical Economics, 60(1), 13–50. https://doi.org/10.1007/s00181-020-01875-7
- Pesaran, M. H., Ullah, A., & Yamagata, T. (2008). A bias-adjusted LM test of error cross-section independence. The Econometrics Journal, 11(1), 105–127.
- Qin, M., Su, C.-W., Zhong, Y., Song, Y., & Oana-Ramona, L. Ţ. (2022). Sustainable finance and renewable energy: Promoters of carbon neutrality in the United States. Journal of Environmental Management, 324, 116390.
- Rahman, M. M. (2020). Environmental degradation: The role of electricity consumption, economic growth and globalisation. Journal of Environmental Management, 253, 109742. https://doi.org/10.1016/j.jenvman.2019.109742
- Renner, M., Garcia-Banos, C., Nagpal, D., & Khalid, A. (2018). Renewable energy and jobs—Annual review 2018. International Renewable Energy Agency.
- Saint Akadiri, S., Alola, A. A., Olasehinde-Williams, G., & Etokakpan, M. U. (2020). The role of electricity consumption, globalization and economic growth in carbon dioxide emissions and its implications for environmental sustainability targets. The Science of the Total Environment, 708, 134653.
- Sarkodie, S. A., & Strezov, V. (2018). Empirical study of the environmental Kuznets curve and environmental sustainability curve hypothesis for Australia, China, Ghana and USA. Journal of Cleaner Production, 201, 98–110. https://doi.org/10.1016/j.jclepro.2018.08.039
- Shahbaz, M., Haouas, I., Sohag, K., & Ozturk, I. (2020). The financial development-environmental degradation nexus in the United Arab Emirates: The importance of growth, globalization and structural breaks. Environmental Science and Pollution Research International, 27(10), 10685–10699. https://doi.org/10.1007/s11356-019-07085-8
- Shahbaz, M., Lahiani, A., Abosedra, S., & Hammoudeh, S. (2018). The role of globalization in energy consumption: A quantile cointegrating regression approach. Energy Economics, 71, 161–170. https://doi.org/10.1016/j.eneco.2018.02.009
- Sinha, A., & Shahbaz, M. (2018). Estimation of environmental Kuznets curve for CO2 emission: Role of renewable energy generation in India. Renewable Energy, 119, 703–711. https://doi.org/10.1016/j.renene.2017.12.058
- Su, C. W., Chen, Y., Hu, J., Chang, T., & Umar, M. (2022). Can the green bond market enter a new era under the fluctuation of oil price? Economic Research-Ekonomska Istraživanja, 36(1), 536–561. https://doi.org/10.1080/1331677X.2022.2077794
- Su, C.-W., Khan, K., Umar, M., & Zhang, W. (2021). Does renewable energy redefine geopolitical risks? Energy Policy, 158, 112566. https://doi.org/10.1016/j.enpol.2021.112566
- Su, C.-W., Li, W., Umar, M., & Lobonţ, O.-R. (2022). Can green credit reduce the emissions of pollutants? Economic Analysis and Policy, 74, 205–219. https://doi.org/10.1016/j.eap.2022.01.016
- Su, C.-W., Pang, L., Umar, M., & Lobonţ, O.-R. (2019). Will gold always shine amid world uncertainty? Emerging Markets Finance and Trade, 55(5), 1–14. https://doi.org/10.1080/1540496X.2022.2050462
- Su, C.-W., Pang, L.-D., Tao, R., Shao, X., & Umar, M. (2022). Renewable energy and technological innovation: Which one is the winner in promoting net-zero emissions? Technological Forecasting and Social Change, 182, 121798. https://doi.org/10.1016/j.techfore.2022.121798
- Su, C.-W., Rizvi, S. K. A., Naqvi, B., Mirza, N., & Umar, M. (2022). COVID19: A blessing in disguise for European stock markets? Finance Research Letters, 49, 103135. https://doi.org/10.1016/j.frl.2022.103135
- Su, C.-W., Song, Y., & Umar, M. (2021). Financial aspects of marine economic growth: From the perspective of coastal provinces and regions in China. Ocean & Coastal Management, 204, 105550. https://doi.org/10.1016/j.ocecoaman.2021.105550
- Tufail, M., Song, L., Adebayo, T. S., Kirikkaleli, D., & Khan, S. (2021). Do fiscal decentralization and natural resources rent curb carbon emissions? Evidence from developed countries. Environmental Science and Pollution Research International, 28(35), 49179–49190. https://doi.org/10.1007/s11356-021-13865-y
- Tufail, M., Song, L., Ali, S., Wahab, S., & Hassan, T. (2022). Does more immigration lead to more violent and property crimes? A case study of 30 selected OECD countries. Economic Research-Ekonomska Istraživanja, 1–19. https://doi.org/10.1080/1331677X.2022.2094437
- Tufail, M., Song, L., Umut, A., Ismailova, N., & Kuldasheva, Z. (2022). Does financial inclusion promote a green economic system? Evaluating the role of energy efficiency. Economic Research-Ekonomska Istraživanja, 35(1), 1–21. https://doi.org/10.1080/1331677X.2022.2094437
- Ulucak, R., & Khan, S. U.-D. (2020). Determinants of the ecological footprint: Role of renewable energy, natural resources, and urbanization. Sustainable Cities and Society, 54, 101996.
- Umar, M., Ji, X., Kirikkaleli, D., & Xu, Q. (2020). COP21 roadmap: Do innovation, financial development, and transportation infrastructure matter for environmental sustainability in China? Journal of Environmental Management, 271, 111026. https://doi.org/10.1016/j.jenvman.2020.111026
- Umar, M., Mirza, N., Hasnaoui, J. A., & Rochoń, M. P. (2022). The nexus of carbon emissions, oil price volatility, and human capital efficiency. Resources Policy, 78, 102876. https://doi.org/10.1016/j.resourpol.2022.102876
- Usman, A., Ullah, S., Ozturk, I., Chishti, M. Z., & Zafar, S. M. (2020). Analysis of asymmetries in the nexus among clean energy and environmental quality in Pakistan. Environmental Science and Pollution Research International, 27(17), 20736–20747. https://doi.org/10.1007/s11356-020-08372-5
- Vieira, N. D. B., Nogueira, L. A. H., & Haddad, J. (2018). An assessment of CO2 emissions avoided by energy-efficiency programs: A general methodology and a case study in Brazil. Energy, 142, 702–715. https://doi.org/10.1016/j.energy.2017.10.072
- Vukina, T., Beghin, J. C., & Solakoglu, E. G. (1999). Transition to markets and the environment: Effects of the change in the composition of manufacturing output. Environment and Development Economics, 4(4), 582–598. https://doi.org/10.1017/S1355770X99000340
- Wang, F., Harindintwali, J. D., Yuan, Z., Wang, M., Wang, F., Li, S., Yin, Z., Huang, L., Fu, Y., Li, L., Chang, S. X., Zhang, L., Rinklebe, J., Yuan, Z., Zhu, Q., Xiang, L., Tsang, D. C. W., Xu, L., Jiang, X., … Chen, J. M. (2021). Technologies and perspectives for achieving carbon neutrality. Innovation, 2(4), 100180.
- Wang, K.-H., Umar, M., Akram, R., & Caglar, E. (2021). Is technological innovation making world “Greener”? An evidence from changing growth story of China. Technological Forecasting and Social Change, 165, 120516. https://doi.org/10.1016/j.techfore.2020.120516
- World Bank. (2021). World Development Indicators. Retrieved from https://databank.worldbank.org/source/world-development-indicators#.
- Wu, B., Fang, H., Jacoby, G., Li, G., & Wu, Z. (2022). Environmental regulations and innovation for sustainability? Moderating effect of political connections. Emerging Markets Review, 50, 100835. https://doi.org/10.1016/j.ememar.2021.100835
- Wurlod, J.-D., & Noailly, J. (2018). The impact of green innovation on energy intensity: An empirical analysis for 14 industrial sectors in OECD countries. Energy Economics, 71, 47–61. https://doi.org/10.1016/j.eneco.2017.12.012
- Yin, X., Chen, W., Eom, J., Clarke, L. E., Kim, S. H., Patel, P. L., Yu, S., & Kyle, G. P. (2015). China’s transportation energy consumption and CO2 emissions from a global perspective. Energy Policy, 82, 233–248. https://doi.org/10.1016/j.enpol.2015.03.021
- York, R., & McGee, J. A. (2017). Does renewable energy development decouple economic growth from CO2 emissions? Socius: Sociological Research for a Dynamic World, 3, 237802311668909. https://doi.org/10.1177/2378023116689098
- Yuan, X., Su, C.-W., Umar, M., Shao, X., & Lobonţ, O.-R. (2022). The race to zero emissions: Can renewable energy be the path to carbon neutrality? Journal of Environmental Management, 308, 114648. https://doi.org/10.1016/j.jenvman.2022.114648
- Zhang, D. (2017). Oil shocks and stock markets revisited: Measuring connectedness from a global perspective. Energy Economics, 62, 323–333. https://doi.org/10.1016/j.eneco.2017.01.009
- Zhang, J., Yang, L., & Xin, F. (2016). Did real estate hinder the innovation in China? An analysis on loan term structure of financial system. Management World, 5, 64–80.
- Zhao, S., Jiang, Y., & Wang, S. (2019). Innovation stages, knowledge spillover, and green economy development: Moderating role of absorptive capacity and environmental regulation. Environmental Science and Pollution Research International, 26(24), 25312–25325.
- Zhou, N., Khanna, N., Feng, W., Ke, J., & Levine, M. (2018). Scenarios of energy efficiency and CO2 emissions reduction potential in the buildings sector in China to year 2050. Nature Energy, 3(11), 978–984. https://doi.org/10.1038/s41560-018-0253-6