
 ?Mathematical formulae have been encoded as MathML and are displayed in this HTML version using MathJax in order to improve their display. Uncheck the box to turn MathJax off. This feature requires Javascript. Click on a formula to zoom.
Abstract
There are differences in economic level, population size, and technical level in different stages. At the same time, as a coal-dependent country, other regions have foreign dependence on coal. Then the primary factors and influence degrees of CO2 emissions in different stages and areas with different coal dependents will be various. This paper adds urbanization rate, industrial structure, and energy consumption structure to the traditional STIRPAT model. Based on the expanded STIRPAT model, the panel data of 30 regions in China from 2005 to 2019 are used to analyze the different stages and areas with foreign coal dependence. The main influencing factors and degree of influence of CO2 emissions. Regression finds that population size, energy consumption, and industrial structure will increase regional carbon dioxide emissions. There is an “inverted U-shaped” curve relationship between economic development, technological level, and carbon dioxide emissions. The improvement of the urbanization rate can reduce carbon dioxide emissions. Carbon dioxide emissions. An “inverted U-shaped” curve relationship between per capita GDP and CO2 emissions in three research periods from 2005 to 2010, 2011 to 2015, and 2016 to 2019. At the same time, the inhibition effect of the urbanization rate is constantly strengthened, and the promotion effect of the coal consumption ratio is decreasing year by year. The influence of population size, technical level, and industrial structure on carbon dioxide emissions in the whole country and areas with different coal dependents varies with the study period. To provide a theoretical basis for local conditions and regional management in the future direction of energy-saving and carbon reduction.
JEL CODES:
1. Introduction
1.1. Study background
Since China’s reform and opening up, China has continued to explore and advance, and the economy has grown by leaps and bounds, realizing globalization and industrialization. However, the consequent energy saving and carbon reduction problem has become a severe challenge in my country. At the same time, governments worldwide are facing the task of reducing greenhouse gas emissions (Hu et al., Citation2022; Qin et al., Citation2023; Qu & Luo, Citation2021). Coal combustion is one of the primary sources of carbon dioxide emissions. As a coal-dependent and developing country, my country has become a vital country affecting global carbon dioxide emissions. Reducing emissions is becoming increasingly urgent (X. Li et al., Citation2022; Lin & Liu, Citation2010; Su, Pang, et al., Citation2022). Facing the heavy emission reduction task, China has always maintained a responsible attitude. In April 2017, China proposed that the total primary energy consumption in 2030 be controlled within 6 billion tons of standard coal. Down 65%.In continuous development, various regions in my country will be different in terms of economic level, energy consumption, population changes, etc. Therefore, various regions’ influencing factors and degrees of CO2 emissions differ. It is worth exploring whether the influencing factors and degrees of carbon dioxide emissions are the same in the other areas of my country under foreign coal dependence. Therefore, this paper analyzes the main influencing factors and differences in the degree of carbon dioxide emissions in different regions from the country’s perspectives and other areas of coal dependence to provide a specific theoretical basis for my government to formulate regional carbon reduction policies.
1.2. Present literature and research gap
According to the research conclusions of the current literature, it can be known that factors such as population size, economic development, industrial structure, and urbanization level are the main factors affecting my country’s carbon dioxide emissions (Ma et al., Citation2013; Pan et al., Citation2017). With the proposal of my country’s “carbon peak,” the relationship between energy consumption and carbon emissions has attracted much attention. China is a vast country, and energy consumption in different regions is not the same. Therefore, this paper draws on the previous research results and adds the energy consumption structure into the model to explore the factors that affect carbon dioxide emissions and to compare and analyze their effects from the perspectives of different coal dependence and research periods.
The academic research on the influencing factors of carbon dioxide emissions is relatively comprehensive. For example, analyzing the influencing factors of industrial carbon emissions with the help of the Kaya identity (Zhang et al., Citation2019); another one examining the influencing factors of agricultural carbon emissions using the deformation of the Kaya identity (Lin & Liu, Citation2010). They combined the extended Kaya identity and LMDI models to explore the impact of economic, population, and industry factors on carbon emissions (Zhu et al., Citation2022). used the LMDI model to analyze the influencing factors of carbon emissions in the Beijing-Tianjin-Hebei region (Zhang et al., Citation2019); Used the LMDI model to study the influencing factors of carbon emissions in China and concluded that energy intensity is the main influencing factor for carbon emissions (Zhang et al., Citation2019). Used the LMDI model to study the influencing factors of carbon emissions in the process of urbanization and found that due to different urbanization rates, there are significant differences in carbon emissions in other regions (Lee et al., Citation2022); Analyzed the IPAT model. How to achieve sustainable development between economy and energy under different scenarios (Nie et al., Citation2010). Used the extended IPAT model to study the influencing factors of carbon emissions in ASEAN and other countries (Chontanawat, Citation2019); Selected the STIRPAT model to analyze the impact of different regions on CO2 emissions (Li & Li, Citation2010); Added space-time weighting to the STIRPAT model (Z. Chen et al., Citation2018); Found that there is a Kuznets curve relationship between economic level and CO2 emissions (Cole, Citation2003); Used the extended STIRPAT model to study the impact of low carbon emissions empirically (Sun et al., Citation2011). Factors of economic development and their degree of influence, it is concluded that per capita GDP, population size, carbon emission intensity, energy consumption structure, and other factors will significantly promote carbon emissions, while industrial design and urbanization rate have no significant impact on carbon emissions; Analyzed the influencing factors of CO2 emissions in cities above the prefecture-level through the extended STIRPAT model (Z. Chen et al., Citation2018).
After a comprehensive overview of the existing literature, this study concluded that most of the studies empirically validates the positive influence of population growth, economic growth, industrial structure, energy consumption, and technological innovation on environmental degradation and increasing level of CO2 emissions (Hussain et al., Citation2022; Lee et al., Citation2022; Mirza et al., Citation2023; Raihan & Tuspekova, Citation2022; Rehman et al., Citation2022; Rizvi et al., Citation2022; Škare & Porada-Rochoń, Citation2023; Su, Khan, et al., Citation2022; Su, Umar, et al., Citation2022; Umar, Ji, et al., Citation2022; Umar, Mirza, et al., Citation2022). These studies provide evidence by considering these variables as a significant factor of environmental degradation that enhances the level of carbon and greenhouse gas emissions. On the other hand, several studies have indicated that increased economic growth and technological innovation transform the positive growth of CO2 emissions into negative—validating the environmental Kuznets curve in various regions (Farooq et al., Citation2022; Massagony & Budiono, 2022; Onifade, Citation2022).
From the perspective of existing research methods, the widely used ones include the Kaya identity, LMDI factorization model, IPAT model, and the establishment of the STIRPAT model and extended STIRPAT model based on the IPAT model. However, the above research methods are mainstream. Method, but each method has certain constraints in research. The Kaya identity requires the analysis of each year or period, and at the same time, it must meet the limitations of the identity (Lin & Liu, Citation2010); The LMDI factorization model cannot realize the elastic analysis of the influencing factors, and the IPAT model must make the assumption of unit elasticity and does not have the Randomness (Dietz & Rosa, Citation1994; Wang et al., Citation2015); Compared with the above models, the STIRPAT model can satisfy the estimation of each coefficient as a parameter and has Randomness, but it cannot fully grasp other factors from the three aspects of population, economy and technical level. To make up for the insufficiency of the traditional STIRPAT model, an extended STIRPAT model is proposed and widely used (Shao et al., Citation2011; Wang et al., Citation2015); from the perspective of research objects, the existing literature includes the whole country and specific provinces and regions, and fresh STIRPAT models. Attributes group literature; from the standpoint of influencing factors, including essential factors economic level, population and technology level and expanding urbanization level, industrial structure, and energy.
1.3. Study objectives
Following the backdrop, this study observed that there are still problems that can be deeply analyzed in terms of the influencing factors of CO2 emissions in various provinces in China: (1) Different provinces in China have different degrees of dependence on coal. It is beneficial to formulate carbon emission reduction policies in other regions; (2) The difference in carbon dioxide emissions in the different areas of China will also lead to various influencing factors and degrees of influence, and clarifying the factors and degrees of impact of varying carbon dioxide emissions can provide a theoretical basis for regional governance; (3) According to China’s 11th, 12th, and 13th five-year planning stages, it can provide a theoretical basis for the formulation of planning policies in China by analyzing the factors and degrees of carbon dioxide impact at different locations. In this context, the CO2 emissions of 30 provinces, municipalities, and autonomous regions in China were measured, and an extended STIRPAT model was established. Using the provincial panel data from 2005 to 2019 in China, and based on the coal dependence of each region, calculated the 30 provinces and cities in China. The autonomous region is divided into areas with high, medium, and low reliance on coal. The fixed effect regression and quantile regression are used to investigate its impact on the overall and subregional carbon dioxide from the aspects of population size, economic level, technological progress, and urbanization rate; At the same time, it analyzes the influencing factors and degrees of carbon dioxide in different stages and puts forward possible policy suggestions through the conclusions drawn from the article.
2. Research methods and data
2.1. Construction of the measurement model
According to the basic form of the STIRPAT model (York et al., Citation2003):
(1)
(1)
Among them, I represents the environmental pressure, P represents the population, A represents the economic level, T represents the technical level and represents the coefficient, b, c, and d represent the elastic coefficients of P, A, and T, respectively, and e is the error term. In the current literature, I am directly expressing the carbon dioxide emissions when researching carbon dioxide (Li & Li, Citation2010).
A region’s population size can directly affect the area’s energy consumption. Under the current energy consumption structure dominated by fossil energy, the population size will also affect the CO2 emissions of the region (Ma et al., Citation2013). The area’s economic development will directly affect the energy consumption level of the residents in the region, which in turn affects the CO2 emissions (Tian et al., Citation2022). There are two main ways that technology level affects CO2 emissions. One is the direct effect of technology replacement and optimization, and the other is the indirect effect affecting the economic output (Wang et al., Citation2015).
At the same time, combined with the research results of the existing literature, a relatively consistent conclusion is obtained that the urbanization rate(U), energy consumption structure (SE), and industrial structure(IS) will also affect carbon emissions. Since my country’s coal energy consumption is relatively high, the ratio of coal consumption to total fossil energy consumption represents the energy consumption structure. Currently, my country’s industrial design is mainly manifested in that the secondary industry’s energy consumption and CO2 emissions are higher than those of the primary and tertiary sectors, and the ratio of the output value of the secondary industry to GDP is used to quantify the industrial structure.
The extended STIRPAT model expression is:
(2)
(2)
Among them, I represents CO2 emissions, P represents population size, A represents GDP per capita, T represents technology level, U represents urbanization rate, E represents energy consumption structure, a means coefficient, b, c, d, e, f, g Respectively represent the coefficients of population size, per capita GDP level, technological level, urbanization rate, energy consumption structure and industrial structure, and his the random error term.
Existing research results have mentioned an “inverted U-shaped” curve relationship between the economic level and CO2. At the same time, some research conclusions have said that technology level can reduce CO2 emissions or that there is a nonlinear relationship between technology level and CO2 emissions. To clarify the impact relationship of each impact on CO2 emissions, this paper adds the primary and quadratic terms of per capita GDP and technological progress to the research model to analyze the relationship between per capita GDP and technological progress on CO2 emissions to be able to carry out regression analysis. Take the logarithm of both sides of the following equation. Its expression is:
(3)
(3)
According to EquationEq (3)(3)
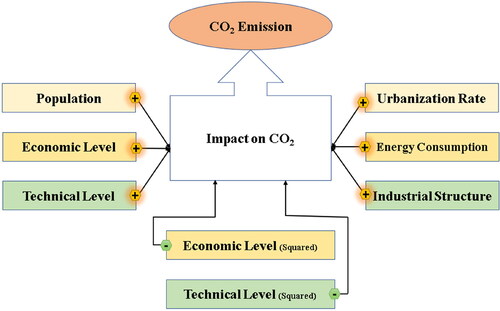
(3) , we will make the following estimates. We estimate that the expansion of the population size and the increase in the proportion of the output value of the secondary industry will promote the rise in energy consumption demand, and both of these factors will promote the emission of CO2. Therefore, the prediction
and
coefficient are optimistic; according to the current research results, per capita, there may be an “inverted U-shaped” curve relationship between GDP, technology level, and CO2 emissions. We predict
that the
coefficient is positive
and
negative; the impact of technological progress on CO2 emissions is an “inverted U-shaped" impact trend. Therefore
the coefficient is negative; the research on the effects of urbanization levels on CO2 emissions has not reached a consistent conclusion, and the symbol of the coefficient cannot be determined for the time being; the energy consumption structure in this paper is quantified by the ratio of coal consumption to total energy consumption, then energy The increase of consumption structure variables will directly promote the emission of CO2. Therefore, the estimated
coefficient is positive.
The influencing mechanism of the variables on CO2 emission is presented in .
Figure 1. Theoretical framework graphical depiction.
Source: Created by authors, represents the theoretical framework as discussed in Section 2.1.
2.2. Measurement of carbon dioxide emissions
The calculation of carbon dioxide emissions is based on the algorithm proposed in the inventoryFootnote1 and compilation guidelinesFootnote2 The CO2 emissions are obtained by multiplying the energy consumption by its corresponding carbon emission correlation coefficient.
Most of my country’s carbon dioxide emissions come from the combustion of fossil fuels. Therefore, this paper selects seven primary fossil energy sources, such as coal, coke, diesel, and gasoline, to calculate CO2 emissions. The specific formula is as follows:
(4)
(4)
Among them represents the province,
represents the type of energy;
represents
the consumption of the first energy (104t or 108 m3);
represents the
minimum average calorific value of the third energy (TJ/10,000 t),
represents the
carbon content of the third energy (C/TJ),
represents The carbon oxidation factor of the third
energy source is shown in the table below ().
Table 1. Correlation coefficient of CO2 emissions from fossil energy.
2.3. Coal dependency division
Coal is the primary energy source in our country, and economic development is relatively dependent on coal. Therefore, the idea of constructing the concept of China’s coal dependence is proposed. The difference in coal consumption in various regions is divided into low, medium, and high coal dependence, and the influencing factors and influence degrees of CO2 emissions in different coal-dependence regions are accurately analyzed—, which is conducive to the regional formulation of carbon emission reduction policies. Coal dependence is measured by the average value of coal consumption in each region from 2005 to 2019. The specific formula is as follows:
(5)
(5)
Among them, I represent the degree of coal dependence. Qci,j, and Qei,j represent the coal consumption and total energy consumption of region i in the jth year ().
Table 2. Coal dependency zones.
2.4. Data description and source
Taking 30 regions across the country as the research object (excluding Tibet, Hong Kong, Macau and Taiwan Province, and other regions), all essential data refer to the 2006-2020 “China Statistical Yearbook,” “China Energy Statistical Yearbook,” and the “Statistical Yearbook” of various regions. “Among them, the population size index in this study is measured by the regional population at the end of the year, the per capita GDP index is measured by the ratio between the regional GDP and the regional population at the end of the year, and the ratio between R&D investment and regional GDP measures the technical level index. The urbanization rate indicator is expressed by the ratio between the urban population and the regional population at the end of the year, the energy consumption structure is measured by the ratio between the regional coal consumption and the regional total energy consumption, and the regional secondary industry output value and regional GDP measure the industrial structure. The ratio between them is measured. Among them, the population-related data, economic-related data, and R&D expenditure data are from the “China Statistical Yearbook” (2006-2020), and the regional GDP and per capita GDP data are adjusted to the constant price in 2000 using the GDP index and the per capita GDP index respectively; The data on different types of energy consumption comes from the China Energy Statistical Yearbook from 2006 to 2020. See for details.
Table 3. Data statistics.
3. Empirical analysis
3.1. Analysis of the regression results of the fixed effect model
According to the assumption of individual-specific effects, this paper conducts a regression analysis of fixed and random effects on the empirical model, combined with the Hausman test method, to select them [30]. According to the analysis results, this study is more suitable for using fixed effects regression (). Therefore, based on the extended STIRPAT model, this paper first uses panel data to conduct a fixed-effect regression analysis for the whole country. Among them, the natural logarithm of carbon dioxide emissions is the explained variable, the population size, per capita GDP, technology level, urbanization rate, energy consumption structure, the natural logarithm of industrial design and the quadratic of the natural logarithm of per capita GDP and technology level terms are explanatory variables.
, the second column is the result of not incorporating the square term of the natural logarithm of per capita GDP and technological level into the regression analysis, and the third column is the result of combining the honest representation of the natural logarithm of per capita GDP and technical level into the regression analysis. Columns 4, 5, and 6 divide the 30 regions of the country into highly dependent parts, moderately dependent areas, and common dependent areas according to the degree of coal dependence.
Table 4. The fixed effect regression results of the influencing factors of CO2 in each province from 2005 to 2019.
From the regression results, the variable coefficients of per capita GDP and technical level are positive at the 1% significant level in the second column of the linear regression equation. In the fourth column of the nonlinear regression analysis, after adding the quadratic term, the per capita GDP, The coefficient of the quadratic term of the factor, and the technology level are negative at the 1% significant level, which can indicate that there is a nonlinear inverted “U"-shaped relationship between the two factors of per capita GDP and technology level and carbon dioxide emissions, that is, with the regional per capita GDP With the increase of GDP and the advancement of technology, regional CO2 emissions will first rise to a certain peak and then begin to decline. Other variables also passed the 1% significance level test. At the same time, the influence direction of the corresponding variables is also consistent with the prediction. Population size, energy consumption structure, and industrial structure are all related to CO2 emissions at 1%. There is a positive correlation in the level, and the positive changes of the above three factors will promote the emission of CO2; the coefficient of urbanization rate is significantly negative, which means that the emission of CO2 will be suppressed; the population size has the most significant promotion effect on the emission of CO2, every 1% increase in it will increase the CO2 emissions by 0.65%; every 1% increase in the energy consumption structure will lead to a 1.03% increase in CO2 emissions; every 1% increase in the industrial structure level will cause CO2 emissions 2 The emission will increase by 0.19%; while the urbanization level will restrain the national CO2 emissions, every 1% increase in the urbanization rate will reduce the CO2 emissions by 0.42%. Therefore, the above variables are the main factors influencing regional CO2 emission differences.
3.2. Analysis of the results of different coal dependence zones
As the largest coal-consuming country, my country has a relatively high dependence on coal. To clarify the influencing factors of carbon dioxide emissions in regions with different coal dependence degrees, this paper conducts a group regression analysis of various country areas with different coal dependence degrees.
According to the regression results (), the coefficients of CO2 emissions of per capita GDP and energy consumption structure variables are significant, indicating that the two are the main factors affecting regional CO2 emissions. From the perspective of population size, the population size elasticity of regions with medium coal dependence is the largest (0.95%), followed by areas with high support (0.54%) and regions with low dependence (0.40%). Regarding the impact of economic level on carbon dioxide emissions, the primary coefficient of per capita GDP in high, medium, and low coal-dependent regions is significantly positive. The quadratic coefficient is very harmful, indicating that there are still differences between per capita GDP and per capita GDP in the three types of regions after grouping—the nonlinear relationship between CO2 emissions. In terms of technology level, the quadratic coefficients of the technology level variables in the areas with high and low dependence are significantly negative, which can indicate that there is an “inverted U-shaped” curve relationship between technology level and CO2 emissions in such regions; but for There is no nonlinear curve relationship between technology level and CO2 emissions in areas with moderate dependence. The story of urbanization harmed CO2 emissions in high, medium, and low dependence regions, with the most significant regression coefficient (1.09%) in the medium region ().
Table 5. The fixed effect regression results of the influencing factors of CO2 in each province from 2005 to 2019.
In contrast, the inhibitory effect in the high region was less pronounced. The energy consumption structure variable coefficients in the three areas are positive at the 1% significance level. The CO2 emissions in regions with high dependence are most affected by it. The coefficients of industrial structure variables in the three types of areas are all significantly positive in terms of industrial structure. The low-level regions have the most significant elastic coefficient of the proportion of output value of the secondary industry to carbon dioxide emissions (0.31%), followed by high-level areas (0.20%). In areas with high and low dependence, the development of the secondary industry is inseparable from the consumption of coal, and it is still a high-coal-dependent industry.
3.3. Analysis of influence effects in different periods
According to the three five-year planning periods of the “Eleventh Five-Year Plan", “Twelfth Five-Year Plan,” and “Thirteenth Five-Year Plan” proposed by China, this study divides the sample period of 19 years from 2005 to 2019 into 2005-2010, 2011 -Three time periods from 2015 to 2016 to 2019, analyze whether the influencing factors and degree of influence of CO2 emissions in the country as a whole and in three different coal-dependent regions in different time periods are the same, and make a longitudinal comparison.
From the regression results of different periods, in the three different periods of 2005-2010, 2011-2015, and 2016-2019, there is always an “inverted U” curve relationship between per capita GDP and CO2 emissions; population In the three study periods, with the increase of the year, the influence of the scale on the whole country and the regions with medium coal dependence increased first and then decreased. The impact on the regions with high coal dependence increased continuously, and the influence on those with low coal dependence gradually decreased. From the perspective of technological progress, from 2006 to 2010, there was an “inverted U” curve relationship between technical level and carbon dioxide emissions in the whole country and the three types of regions with different coal dependents. -In the two periods of 2019, there is no longer a nonlinear relationship between the country and the regions with moderate coal dependence; in the three types of regions with different coal dependence, the inhibitory effect of urbanization on CO2 emissions continues to increase with each year, the promoting effect of energy consumption structure on carbon dioxide emissions is decreasing, indicating that China’s implementation of policies to improve urbanization level, energy constraints and the development and use of clean energy, the effect is prominent year by year; the promotion effect of industrial structure on carbon dioxide emissions is in addition to coal dependence. Except for areas with high coal dependence, all showed a significant increase trend during the “Twelfth Five-Year Plan” (2011-2015) and began to decrease after entering the “Thirteenth Five-Year Plan,” while areas with high coal dependence were affected by it. The year-to-year change is not noticeable. The possible reason is that during the 12th Five-Year Plan period, China’s economy continued to develop rapidly, with an average annual growth of regional GDP of 7.8%Footnote3, and the total economic volume ranked second in the world. Emissions. During the 13th Five-Year Plan period, China advocated a coordinated and sustainable growth model, which requires medium and high-speed economic developmentFootnote4. So the impact of industrial structure on CO2 is gradually becoming smaller.
3.4. Discussion on the empirical results
Environmental degradation is an issue that is faced by many countries all over the world. There are several factors that contribute to environmental degradation, and it can be difficult to identify and address all of them. In this study, we empirically discuss some of the most important factors contributing to environmental degradation.
As the world’s most populous country, China is under immense pressure to sustain its economic growth while reducing its environmental impact. Since the country began its economic reforms in 1978, China’s GDP has grown an astounding 9.5% per year on average, making it the second-largest economy in the world. However, this growth has come at a cost. China is now the world’s largest emitter of greenhouse gases, responsible for 27% of global emissions (World Bank Group, Citation2022). A number of factors have contributed to China’s high emissions, but the two main ones are the country’s large population and rapid economic development. China’s population is currently estimated at 1.4 billion people, about 18.47% of the world’s population.Footnote5 As the country’s population has grown, so has its energy demand. China has relied heavily on coal, a dirty energy source, to meet this demand. In fact, China currently gets about 80% of its energy from fossil fuels, compared to just 20% from renewable sources. The other major factor influencing China’s high emissions is its rapid economic development. As the country’s economy has grown, so has its energy demand, which has increased CO2 emissions. China’s high emissions are also because its manufacturing sector is very energy-intensive. In fact, the manufacturing sector accounts for about 30% of China’s total energy consumption. The positive influence of population growth on CO2 emission is also depicted in the recent studies of (H. Chen et al., Citation2022; Rehman et al., Citation2022; Weber & Sciubba, Citation2019), which is consistent with the present findings.
China, the world’s most populous country, has achieved remarkable economic growth since it began to reform its economy in 1978. In 2018, China’s GDP was US$13.6 trillion, making it the second-largest economy in the world after the United States. China is now the world’s largest trading nation, and its economy is expected to continue to grow rapidly in the coming years. This economic growth has come at a significant environmental cost. China is now the world’s largest emitter of greenhouse gases, and its air pollution levels are among the worst in the world.Footnote6 China’s environmental problems are largely a result of its heavy reliance on fossil fuels as an energy source. China is the world’s largest producer and consumer of coal, and coal accounts for 56.8 percent of China’s energy consumption (ChinaPower, Citation2016). The use of coal is a major contributor to air pollution and climate change. Burning coal releases a range of pollutants into the air, including carbon dioxide (CO2), sulfur dioxide (SO2), and nitrogen oxides (NO2). These pollutants can cause various health problems, including respiratory illnesses, heart disease, and cancer (Wei et al., Citation2022). In addition, CO2 emissions from coal-fired power plants are a major contributor to climate change. The estimated results of this study are in line with the results of (Adebayo et al., Citation2022; Kirikkaleli et al., Citation2022; Raihan & Tuspekova, Citation2022).
Technology is a major driver of China’s high emissions. The country’s heavy reliance on coal-fired power plants, for example, is a direct result of its lack of access to other energy sources. China also has a large and growing manufacturing sector, which consumes large amounts of energy and emits large amounts of carbon dioxide and other pollutants. China’s government has made some progress in recent years in reducing the country’s emissions. The government has implemented several policies to encourage the use of renewable energy, improve energy efficiency, and limit emissions from power plants and factories. However, these efforts have not been enough to offset the country’s growing emissions.
As China continues to urbanize and industrialize rapidly, its carbon emissions have increased dramatically. China has been industrializing at a breakneck pace. As more and more factories have been built in China, they have emitted more and more carbon dioxide and other pollutants into the atmosphere. Besides, China’s population is growing and urbanizing rapidly. As more and more people move into cities, they consume more energy and produce more waste. This also leads to higher carbon emissions. Apart from the initial rise in the urbanization level of China, it could still limit the emission level by efficiently utilizing technological innovation and economic growth. One of the most important reasons urbanizations can lead to more efficient land use. People living in densely populated areas have less need for transportation, which can help reduce emissions. In addition, urbanization can also lead to increased use of public transportation, which is often more efficient than private vehicles. And, as cities become denser, they often become more walkable, which can further reduce emissions. Overall, urbanization can be a powerful tool for reducing carbon emissions in China. By promoting more efficient land use and increasing public transportation, urbanization can help make a significant dent in China’s emissions. The empirical results of this study are consistent with the empirical results of (Anwar et al., Citation2022; Hussain et al., Citation2022; Lee et al., Citation2022).
Apart from the factors increasing the emissions level, economic growth and technological innovation could be used as remedial measures for tackling environmental degradation. For instance, China’s carbon dioxide emissions grew by an average of 4.5% per year between 2005 and 2015. However, between 2015 and 2016, emissions growth slowed to just 1.5 percent. This slowdown is largely due to China’s efforts to promote economic growth without increasing energy consumption. For instance, China has been investing heavily in renewable energy, which has decreased the country’s reliance on coal. In addition, China has been working to improve energy efficiency, which has also helped reduce emissions. Besides, the country has also been a leader in renewable energy and improving energy efficiency via advancement in technological innovation. As China’s economy has grown, so has its energy demand. However, the country has been able to improve its energy efficiency. The country has been investing in renewable energy as part of its goal to reduce its dependence on coal. In 2018, renewable energy accounted for 24% of China’s total power generation. This is up from just 3% in 2005. China has also been investing in energy efficiency. The country has set targets for energy efficiency improvements and has invested in initiatives such as the Top-1000 Enterprises Energy Conservation Program. These programs provide financial incentives to companies that improve their energy efficiency. The validity of the EKC in terms of economic growth and technological innovation is evident in the recent studies of (Farooq et al., Citation2022; Massagony & Budiono, 2022; Onifade, Citation2022), which are in line with the empirical findings of this study.
4. Concluding remarks
4.1. Conclusion
Using the relevant yearbook data of 30 areas in China, this paper analyzes the influencing factors of CO2 emissions in China through the extended STIRPAT model. The study results found that the influencing factors and degrees of carbon dioxide emissions were different in different coal-dependent regions and study periods. The main conclusions are as follows:
By summarizing the regression results of different coal dependencies, the following conclusions are drawn:
From the perspective of population size, the CO2 emissions of the medium-dependent regions are most affected by the population size, so the medium-dependent areas should pay attention to the negative impact of the increase in CO2 emissions due to the population size expansion. Dependent regions may have a synergistic effect on CO2 reduction in population control. Therefore, in policy formulation, the medium-dependent parts need to limit the urban scale and population size of the medium-dependent regions. By controlling the urban scale and population size, CO2 emission reduction in medium-dependent areas can be achieved.
“U-shaped” curve relationship between per capita GDP and CO2 emissions and between technological level and CO2emissions in the three types of regions with different coal dependents. It shows that the CO2 emissions in the three areas with low, medium, and high reliance on coal may have passed the highest point for the inflow of water from the level of economic development, realizing the trend of decreasing CO2 emissions with the increase of regional GDP. As for the technical level, the three types of regions may have passed the stage of diseconomies of scale and achieved technical emission reduction.
From other perspectives, the change in the percentage of the secondary industry’s output value significantly impacts CO2 emissions in different coal-dependent regions. Since my country is still a developing country, the increase in the output value of the secondary industry will still increase CO2 emissions. Areas with low coal dependence are most affected by it. Urbanization inhibits CO2 emissions in the three regions and has the most significant inhibitory effect on sites with moderate coal dependence. Regarding energy consumption structure, the CO2 emissions in areas with high coal dependence are most affected.
(4) From the perspective of different research periods, the “inverted U-shaped” curve relationship between per capita GDP and CO2 emissions has always been established in three different periods: 2005-2010, 2011-2015, and 2016-2019; The “inverted U-shaped” curve relationship between levels andCO2 emissions only existed during the “Eleventh Five-Year Plan” period; in the three types of regions across the country and with different levels of coal dependence, the impact of urbanization rates on carbon dioxide continued to increase with the increase of years. In areas with low coal dependence, the effect of population size on carbon dioxide gradually decreases with the increase of years. In contrast, in areas with high coal dependence, its effect increases. At the same time, judging from the comparison between the “12th Five-Year Plan” and the “11th Five-Year Plan” period, the promotion effect of population size on carbon dioxide in the country and the middle and high coal-dependent regions has increased; The effect of carbon dioxide increased in all three regions. Compared with the “13th Five-Year Plan” period and the “12th Five-Year Plan” period, the impact of population size on carbon dioxide in the country and regions with moderate coal dependence shows a decreasing trend; the effect of industrial structure on carbon dioxide in the country and three types of areas with different coal dependence somewhat reduced.
4.2. Policy implications
Following the empirical results, this study recommends policies that could help China reduce CO2 emissions and achieve the carbon neutrality target. Specifically, the medium-dependent regions must restrict their areas’ urban scale and population expansion. It is possible to reduce CO2 emissions in medium-dependent regions by regulating urban scale and population number. Further, this study observed that economic growth and technological innovation are the prominent emissions factors. Yet, as a result of the U-shaped association suggests further enhancement in economic growth and technological innovation. That is, using energy-efficient resources and industrial expansion may be effective for increased economic development, which also reduces emissions. On the other hand, the increased economic growth also contributes to the enhancement of technology-related research and development investment, which help in producing and utilizing renewable and energy-efficient resources and equipment. These steps will also lead to the reduction of traditional fossil fuel consumption, which consequently leads to reducing the level of pollution and promoting environmental sustainability.
4.3. Study limitations and future research direction
Nonetheless, this study covers several indicators of environmental degradation in China. Still, there are numerous economic, environmental, and financial instruments that could affect the level of CO2 emission, which are out of the scope of this study. Therefore, this study recommends that future researchers consider these economic (aggregate consumption, aggregate investment), financial (FDI, financial development), and environmental (renewable energy, energy efficiency) instruments in the empirical investigation. Besides, this study fixed effect and random effect, which provides effective results. Still, future researchers are directed to analyze such connections by applying ARDL for the short and long-run coefficient or quantile regression for the influence of variables at each specific quantile.
Disclosure statement
No potential conflict of interest was reported by the authors.
Notes
1 2006 IPCC Guidelines for Greenhouse Gas Inventories.
2 “Guidelines for Compiling Provincial Greenhouse Gas Inventories”.
3 “Outline of the Twelfth Five-Year Plan for National Economic and Social Development of the People's Republic of China”.
4 “Outline of the Thirteenth Five-Year Plan for National Economic and Social Development of the People's Republic of China”.
5 See China Population (2023) - Worldometer. (n.d.). Worldometers.Info. Retrieved January 17, 2023, from https://www.worldometers.info/world-population/china-population/
References
- Adebayo, T. S., Bekun, F. V., Rjoub, H., Agboola, M. O., Agyekum, E. B., & Gyamfi, B. A. (2022). Another look at the nexus between economic growth trajectory and emission within the context of developing country: Fresh insights from a nonparametric causality-in-quantiles test. Environment, Development and Sustainability, 1–23.
- Anwar, A., Sinha, A., Sharif, A., Siddique, M., Irshad, S., Anwar, W., & Malik, S. (2022). The nexus between urbanization, renewable energy consumption, financial development, and CO2 emissions: Evidence from selected Asian countries. Environment, Development and Sustainability, 24(5), 6556–6576. https://doi.org/10.1007/s10668-021-01716-2
- ChinaPower. (2016, February 15). How Is China’s Energy Footprint Changing? ChinaPower Project. https://chinapower.csis.org/energy-footprint/
- Chen, H., Tackie, E. A., Ahakwa, I., Musah, M., Salakpi, A., Alfred, M., & Atingabili, S. (2022). Does energy consumption, economic growth, urbanization, and population growth influence carbon emissions in the BRICS? Evidence from panel models robust to cross-sectional dependence and slope heterogeneity. Environmental Science and Pollution Research International, 29(25), 37598–37616. https://doi.org/10.1007/s11356-021-17671-4
- Chen, Z., Wu, S., Ma, W., Liu, X., Cai, B., Liu, J., Jia, X., Zhang, M., Chen, Y., & Xu, L. (2018). Driving forces of carbon dioxide emission for China’s cities: Empirical analysis based on extended STIRPAT Model. China Population, Resources and Environment, 28(10), 45–54.
- Chontanawat, J. (2019). Driving forces of energy-related CO2 emissions based on expanded IPAT decomposition analysis: Evidence from ASEAN and four selected countries. Energies, 12(4), 764. https://doi.org/10.3390/en12040764
- Cole, M. A. (2003). Development, trade, and the environment: How robust is the environmental kuznets curve? Environment and Development Economics, 8(4), 557–580. https://doi.org/10.1017/S1355770X0300305
- Dietz, T., & Rosa, E. A. (1994). Rethinking the environmental impacts of population, affluence and technology. Human Ecology Review, 1(2), 277–300.
- Farooq, S., Ozturk, I., Majeed, M. T., & Akram, R. (2022). Globalization and CO2 emissions in the presence of EKC: A global panel data analysis. Gondwana Research, 106, 367–378. https://doi.org/10.1016/j.gr.2022.02.002
- Hu, J., Wang, K.-H., Su, C. W., & Umar, M. (2022). Oil price, green innovation and institutional pressure: A China’s perspective. Resources Policy, 78, 102788. https://doi.org/10.1016/j.resourpol.2022.102788
- Hussain, M. N., Li, Z., & Sattar, A. (2022). Effects of urbanization and nonrenewable energy on carbon emission in Africa. Environmental Science and Pollution Research International, 29(17), 25078–25092. https://doi.org/10.1007/s11356-021-17738-2
- Kirikkaleli, D., Güngör, H., & Adebayo, T. S. (2022). Consumption‐based carbon emissions, renewable energy consumption, financial development and economic growth in Chile. Business Strategy and the Environment, 31(3), 1123–1137. https://doi.org/10.1002/bse.2945
- Lee, C.-C., Zhou, B., Yang, T.-Y., Yu, C.-H., & Zhao, J. (2022). The impact of urbanization on CO2 emissions in China: The key role of foreign direct investment. Emerging Markets Finance and Trade, 1–17. https://doi.org/10.1080/1540496X.2022.2153591
- Li, X., Li, Z., Su, C.-W., Umar, M., & Shao, X. (2022). Exploring the asymmetric impact of economic policy uncertainty on China’s carbon emissions trading market price: Do different types of uncertainty matter? Technological Forecasting and Social Change, 178, 121601. https://doi.org/10.1016/j.techfore.2022.121601
- Li, G., & Li, Z. (2010). Regional difference and influence factors of China’s carbon dioxide emissions. China Population Resources and Environment, 20, 22–27.
- Lin, B. Q., & Liu, X. Y. (2010). China’s carbon dioxide emissions under the urbanization process: Influence factors and abatement policies. Economic Research Journal, 8, 66–78.
- Massagony, A., & Budiono. (2023). Is the Environmental Kuznets Curve (EKC) hypothesis valid on CO2 emissions in Indonesia? International Journal of Environmental Studies, 1–18. https://doi.org/10.1080/00207233.2022.2099110
- Ma, X., Li, Q., & Guo, Y. (2013). The impact of population on carbon dioxide emissions in China: An analysis based on STIRPAT model [J]. Population & Economics, 1, 44–51.
- Mirza, N., Afzal, A., Umar, M., & Skare, M. (2023). The impact of green lending on banking performance: Evidence from SME credit portfolios in the BRIC. Economic Analysis and Policy, 77, 843–850. https://doi.org/10.1016/j.eap.2022.12.024
- Nie, R., Zhang, T. N., & Wang, D. (2010). The scenario analysis on energy consumption and carbon emissions based on environmental loads model. Journal of Natural Resources, 9, 1557–1564.
- Onifade, S. T. (2022). Retrospecting on resource abundance in leading oil-producing African countries: How valid is the environmental Kuznets curve (EKC) hypothesis in a sectoral composition framework? Environmental Science and Pollution Research, 29, 1–14.
- Pan, W. Q., Liu, T., & Wang, F. G. (2017). A study on factors of regional industrial carbon emission in China: Based on the perspective of different economic growth stages. Statistical Research, 34(3), 30–44.
- Qin, M., Su, C.-W., Umar, M., Lobonţ, O.-R., & Manta, A. G. (2023). Are climate and geopolitics the challenges to sustainable development? Novel evidence from the global supply chain. Economic Analysis and Policy, 77, 748–763. https://doi.org/10.1016/j.eap.2023.01.002
- Qu, X. E., & Luo, H. Y. (2021). Impact of China’s OFDI on carbon emissions and its transmission mechanism: An empirical analysis based on multiple mediation effect model. China Population Resources Environment, 31, 1–14.
- Raihan, A., & Tuspekova, A. (2022). Toward a sustainable environment: Nexus between economic growth, renewable energy use, forested area, and carbon emissions in Malaysia. Resources, Conservation & Recycling Advances, 15, 200096. https://doi.org/10.1016/j.rcradv.2022.200096
- Rehman, A., Ma, H., Ozturk, I., & Ulucak, R. (2022). Sustainable development and pollution: The effects of CO2 emission on population growth, food production, economic development, and energy consumption in Pakistan. Environmental Science and Pollution Research International, 29(12), 17319–17330. https://doi.org/10.1007/s11356-021-16998-2
- Rizvi, S. K. A., Naqvi, B., Mirza, N., & Umar, M. (2022). Safe haven properties of green, Islamic, and crypto assets and investor’s proclivity towards treasury and gold. Energy Economics, 115, 106396. https://doi.org/10.1016/j.eneco.2022.106396
- Shao, S., Yang, L., Yu, M., & Yu, M. (2011). Estimation, characteristics, and determinants of energy-related industrial CO2 emissions in Shanghai (China), 1994–2009. Energy Policy, 39(10), 6476–6494. https://doi.org/10.1016/j.enpol.2011.07.049
- Škare, M., & Porada-Rochoń, M. (2023). Are we making progress on decarbonization? A panel heterogeneous study of the long-run relationship in selected economies. Technological Forecasting and Social Change, 188, 122279. https://doi.org/10.1016/j.techfore.2022.122279
- Su, C.-W., Khan, K., Umar, M., & Chang, T. (2022). Renewable energy in prism of technological innovation and economic uncertainty. Renewable Energy, 189, 467–478. https://doi.org/10.1016/j.renene.2022.02.110
- Sun, J. S., Chen, Z. R., & Li, Z. J. (2011). A research on influencing factors of low-carbon economy development in China: An analysis based on the extended STIRPAT model. Journal of Audit & Economics, 26(4), 85–93.
- Su, C.-W., Pang, L.-D., Tao, R., Shao, X., & Umar, M. (2022). Renewable energy and technological innovation: Which one is the winner in promoting net-zero emissions? Technological Forecasting and Social Change, 182, 121798. https://doi.org/10.1016/j.techfore.2022.121798
- Su, C.-W., Umar, M., & Gao, R. (2022). Save the environment, get financing! How China is protecting the environment with green credit policies? Journal of Environmental Management, 323, 116178. https://doi.org/10.1016/j.jenvman.2022.116178
- Tian, Z., Qi, Z., Gan, W., Tian, M., & Gao, W. (2022). A novel negative carbon-emission, cooling, and power generation system based on combined LNG regasification and waste heat recovery: Energy, exergy, economic, environmental (4E) evaluations. Energy, 257, 124528.
- Umar, M., Ji, X., Mirza, N., & Li, H. (2022). Crypto swings and the performance of carbon-intensive equity funds in China. Resources Policy, 78, 102786. https://doi.org/10.1016/j.resourpol.2022.102786
- Umar, M., Mirza, N., Hasnaoui, J. A., & Rochoń, M. P. (2022). The nexus of carbon emissions, oil price volatility, and human capital efficiency. Resources Policy, 78, 102876. https://doi.org/10.1016/j.resourpol.2022.102876
- Wang, C., Zhang, X., Wang, F., Lei, J., & Zhang, L. (2015). Decomposition of energy-related carbon emissions in Xinjiang and relative mitigation policy recommendations. Frontiers of Earth Science, 9(1), 65–76. https://doi.org/10.1007/s11707-014-0442-y
- Weber, H., & Sciubba, J. D. (2019). The effect of population growth on the environment: Evidence from European regions. European Journal of Population = Revue Europeenne de Demographie, 35(2), 379–402. https://doi.org/10.1007/s10680-018-9486-0
- Wei, J., Rahim, S., & Wang, S. (2022). Role of environmental degradation, institutional quality and government health expenditures for human health: evidence from emerging seven countries. Frontiers in Public Health, 562.
- World Bank Group. (2022, October 12). China’s Transition to a Low-Carbon Economy and Climate Resilience Needs Shifts in Resources and Technologies. World Bank Group. https://www.worldbank.org/en/news/press-release/2022/10/12/china-s-transition-to-a-low-carbon-economy-and-climate-resilience-needs-shifts-in-resources-and-technologies
- York, R., Rosa, E. A., & Dietz, T. (2003). STIRPAT, IPAT and ImPACT: analytic tools for unpacking the driving forces of environmental impacts. Ecological Economics, 46(3), 351–365. https://doi.org/10.1016/S0921-8009(03)00188-5
- Zhang, C., Su, B., Zhou, K., & Yang, S. (2019). Decomposition analysis of China’s CO2 emissions (2000–2016) and scenario analysis of its carbon intensity targets in 2020 and 2030. The Science of the Total Environment, 668, 432–442.
- Zhu, C., Yang, S., & Liu, P. (2022). Study on the factors influencing on the carbon emissions of Shaanxi Province’s transportation industry in China. Sustainability, 14(14), 8610.