
 ?Mathematical formulae have been encoded as MathML and are displayed in this HTML version using MathJax in order to improve their display. Uncheck the box to turn MathJax off. This feature requires Javascript. Click on a formula to zoom.
Abstract
Taking the golden 20 years of the Chinese leather industry as an example, this paper adopts a spatial panel model to accurately portray the characteristics of spatial evolution and the trend of development of agglomeration of the leather industry. This paper further systematically identifies the key driving factors of leather industry agglomeration, taking into account the time effect, spatial effect, and spatio-temporal effect at the same time. The results show that China’s leather industry shows a shift from coastal areas to diffusion to inland areas. In terms of influencing factors, resource endowment and economic externality are the key force leading the agglomeration of leather industry. In addition, according to the results of group regression, it is found that innovation capacity and environmental regulation have become the main driving forces affecting the development of leather industry. Therefore, the government should carry out global planning according to the spatial pattern and transfer path of leather industry agglomeration. Based on the deep-level driving mechanism of industrial pattern evolution, specific industrial measures should be formulate to realize the development and promotion of leather industry in the new era.
1. Introduction
Leather industry is an important industrial sector in the emerging economies (Karuppiah et al., Citation2021). Since the economic reform in China, the leather industry has developed rapidly with the advantages of cheap labor and low-cost raw materials. Its development process is consistent with the migration of the global leather industry center (Moktadir et al., Citation2021). In 1990s, with the acceleration of global integration, the center of international leather industry gradually migrated to Asia (Dicken, Citation1998). After the participation of China in the WTO (World Trade Organization), a trend of absorbing high-quality foreign capital and improving industrial competitiveness has spread across China, which promoted the 'reemergence’ of the Chinese leather industry. Therefore, China changes from ‘a major leather country’ to ‘a world leather power’. The golden period of development of the China leather industry has begun since then.
Scott (Citation2006) showed that no matter what the level of development, agglomeration tends to be a pervasive feature of the leather industry. At present, the Chinese leather industry has become a global tannery power and has become one of the most active and promising markets in international leather trade around the world (Brautigam et al., Citation2018; Su et al., Citation2022; Wang et al., Citation2022). It can be further stated that China is not only the important producer of leather products, but is also a major importer and exporter of leather materials (Omoloso et al., Citation2021; Song et al., Citation2022; Yang et al., Citation2022). Meanwhile, the Chinese leather industry has entered a period of extensive adjustment. Under the increasing downward pressure on the domestic economy and the complex international economic situation, the golden period of the Chinese leather industry has been blocked and may face several challenges to maintain smooth operation and development (Tong et al., Citation2020). Based on this, from a macroscopic point of view, to examine the agglomeration characteristics and driving force in the leather industry industrial is necessary. It is an important foundation for leather industry to cope with complex internal and external pressure, restore industrial resilience, and achieve stable industrial operation. Based on foundational research on industrial agglomeration theory (Krugman, Citation1991; Marshall, Citation1961), some scholars began to research industrial agglomeration.
First, most scholars focused on the 'manufacturing industry’ to comprehensively identify its industrial agglomeration (Drucker & Feser, Citation2012; Fahad et al., Citation2022; Hu et al., Citation2022). For example, Ramachandran et al. (Citation2020) take the Indian manufacturing sector as research object, the measure of industrial agglomeration is based on Ellison-Glaeser index. And Yuan et al. (Citation2020) measured China’s manufacturing industry agglomeration level. The difference from Ramachandran’s study is that they estimated the manufacturing agglomeration by location entropy index. Considering the data availability, the location quotient method is also used in this paper.
Second, in the research dimension of industrial agglomeration, most scholars investigate industrial agglomeration on the provincial (Guan et al., Citation2019; Su et al., Citation2022), regional (Commendatore et al., Citation2014; Fahad et al., Citation2023), or city cluster scales (Shao et al., Citation2017). It is important to note that at the national level, the Chinese industry has shown a strong trend of agglomeration. However, due to the increase in economic globalization, social division of labor, and specialization, differences characteristics in industrial agglomeration among various kinds of sectors have gradually emerged (He & Hu, Citation2019). Further, above standard studies in the field of economics to studying industrial agglomeration have been in terms of cross-sectional measurement. However, such measures often fail to distinguish spatial scales of agglomeration (Mori & Smith, Citation2015). Therefore, the agglomeration research for a particular industry with the spatial econometrics approach is necessary.
In addition, industrial agglomeration is a multifactor coupling and a complex historical process. Although the factors behind the initial industrial distribution pattern are difficult to separate, the trend of industrial agglomeration suggests that there may exist some internal forces contributing to the continuous formation of the industrial geographical pattern (An, Citation2009). In the study on the factors influencing industrial agglomeration, however, some scholars used the regression analysis method in econometrics. The effect of regional institutional tilt on industrial agglomeration was examined, such as ‘the Outling of the Economic Belt of the Yangtze River’ and ‘the Pilot Project of Innovative Cities’ (Chen et al., Citation2021; Liu et al., Citation2020; Yang et al., Citation2016). On the other hand, at the provincial level, some scholars focused on foreign investment (Ning et al., Citation2016), environmental impact (Ahmad et al., Citation2021; Cole et al., Citation2010), resource endowment (Imaizumi et al., Citation2016), government behavior (Kondo, Citation2013; Zheng, Citation2021) and other factors on industrial agglomeration. Form there, with a view to the special history of China’s industrial development, the formation and evolution of China’s industrial distribution pattern is influenced by a combination of factors such as institutions, markets, regions, and globalization.
The existing literature focuses first on ‘manufacturing’, it does not conduct an in-depth study on industrial agglomeration in the leather industry. Second, existing research mostly adopted the economic method, and it did not focus on the crossover of multiple methods. In particular, there is a lesser combination of spatial econometric models that can reflect industrial development patterns. Third, existing studies have focused on the impact of one aspect of environmental or economic factors on industrial agglomeration. The combined effect of multiple factors requires further study.
Based on the this, focusing on Chinese leather industry as an example, this paper adopts locational entropy index, standard deviation ellipse method, spatial autocorrelation analysis and spatial econometric model. Then, this paper constructs a systematic empirical investigation and empirical analysis of the industry agglomeration characteristics and the formation mechanism of the agglomeration pattern.
This paper contributes to the literature in the following ways: Firstly, it focuses on the Chinese leather industry, the spatial characteristics of the industrial agglomeration, and the key factors influencing the formation of the spatial pattern. Secondly, by combining traditional economic measurement methods with typical models of economic geography, the temporal-spatial effect of industrial agglomeration in the leather industry is examined. Third, the influence of the combined factors on the leather industrial agglomeration is studied, in order to explore the dominant factors shaping the spatial pattern of leather industry. Through the exploratory research described above, this article aims to characterize the spatial pattern of the leather industry, describe its characteristics of dynamic evolution, and identify its key driving factors.
2. Material and methods
2.1. Empirical model specification
2.1.1. Location quotient index
Location quotient index, which was first proposed by Haggett (Citation1965) and used in spatial analysis. When measuring the spatial distribution of factors in a region, the location quotient reflects the degree of specialization of an industrial sector. Therefore, this paper uses location quotients to measure the degree of industrial agglomeration in the leather industry. The calculation is as follows:
(1)
(1)
In EquationEquation (1)(1)
(1) , LQij is the location quotient, Lij is the total output value or the number of workers of the industry j in region i,
is the total industrial output value or the number of workers in region i,
is the total output value or the number of workers of the industry j, and
is the total industrial output value or the number of workers nationwide. If the location quotient index LQij is greater than 1, it indicates that the agglomeration degree of industry j in region i is relatively high and has obvious comparative advantages; otherwise, it is considered that the industry j in region i is disadvantageous nationwide.
2.1.2. Standard deviational ellipse method of spatial statistics
By measuring the location quotient of the leather industry, the trend of leather industrial agglomeration can be described from time series. Furthermore, using the proposed spatial statistical standard deviation ellipse method, this paper comprehensively describes the dynamic evolutionary characteristics of leather industrial agglomeration. It attempts to conduct a comprehensive analysis of the evolutionary characteristics and development trend of the industrial pattern of China’s leather industry from a global and spatial perspective.
2.1.3. Spatial autocorrelation analysis
To accurately grasp the specific manifestations of spatial effects caused by the ‘core-peripheral’ pattern formed in the leather industrial migration process, it is necessary to perform a quantitative analysis of the spatial correlation of the leather industry. Therefore, based on the analysis of the spatial pattern of leather industrial agglomeration in China, the global spatial autocorrelation index (Global Moran’s I) is used to conduct a comprehensive investigation of the spatial spillover effect of leather industrial agglomeration (Tillé et al., Citation2018). To verify whether the areas surrounding the leather industrial agglomeration development region are also highly developed. Considering that economic differences between regions will affect the spatial radiation effect (Chen et al., Citation2021). In this paper, the economical distance weight matrix is constructed by using the difference in the annual average value of per capita GDP between regions when testing the spatial spillover effect of leather industrial agglomeration (Bai et al., Citation2015).
2.1.4. Spatial econometrics models
Based on the panel model, the spatial panel model incorporating spatial and temporal effects is used in this paper to discuss the factors that drive the leather industrial agglomeration pattern. According to External Economic Theory, and within the analytical framework of economic geography, a spatial panel model is constructed. Variables are selected from aspects of natural resource endowments, Marshallian externalities, transportation costs, and scale economies. The formula is as follows:
(2)
(2)
Here, yit is the agglomeration level of leather industry in region i at period t (the explained variable), Xit is the 1 × K dimensional exogenous explanatory variable. is the spatial lag term of the explained variable, which indicates the endogenous spatial interaction effect, and
is the spatial lag term of the explanatory variable which indicates the exogenous spatial interaction effect. wij is the element of the N × N standardized spatial weight matrix W,
is the spatial autoregressive coefficient matrix that reflects the intensity of the effect of the endogenous spatial interaction effect,
is the K × 1 dimensional coefficient valuation vector of the exogenous explanatory variables,
is the coefficient valuation of the spatial lag term of K × 1 dimensional exogenous explanatory variable, which reflects the intensity of the effect of the exogenous spatial interaction effect.
and
represent the individual effect, temporal effect, and random error term, respectively. Other variables are set as follows:
Water resources (marked as Water): The leather industry is a traditional high-water consumption industry (Hansen et al., Citation2021). With China’s strict industrial water quota management system, the abundance of local water may be a driving force in attracting leather companies. Therefore, this research chooses the total amount of water resources as one of the factors to measure the natural resource endowment.
Raw material (marked as Raw): The leather industry depends on the processing of animal products, and animal fur is used as the main raw material for serial processing (Mammadova et al., Citation2020). A typical feature of the leather industry is that its products include both raw materials of natural leather from agricultural products and synthetic leather from non-agricultural products (Karuppiah et al., Citation2021). In this regard, this paper takes the ‘total output value of animal husbandry’ as a specific indicator to measure the abundance of raw materials for livestock products in the region.
Labor force (marked as Labor): The core driving force of the development of industrial agglomeration is human capital, which has been confirmed by scholars (Freedman, Citation2008). High-level labor can promote technological progress by expanding the scale of technology choices and increasing the possibility of technology spillovers, thus promoting industrial agglomeration (Ji et al., Citation2016). Therefore, this paper uses ‘the number of residents’ to represent the regional labor endowment, to measure the degree of human capital effect on the leather industrial agglomeration.
Research and development (marked as Rd): Technological research and development (R&D) is an important driving force for industrial upgrading, and its investment is an important factor affecting technological innovation (Liu & Zhang, Citation2021). Therefore, this paper adopts the concept of ‘investment in scientific research and experimental development (R&D expenditure)’ to measure the strength of regional technological innovation (Carboni & Medda, Citation2021).
Logistics level (marked as Logistics): As a kind of producer service, the logistics industry is closely correlated with the manufacturing industry and is an intermediate demand industry in the manufacturing industry (Abdulrahman et al., Citation2014). Due to the economy of scale effect and input-output linkage effect, the logistics industry and the subsectors of manufacturing industry are also closely correlated (Zhu et al., Citation2015). Therefore, this study uses the turnover of freight traffic as a specific indicator to measure the level of regional logistics development, in order to explore the key role of logistics in the agglomeration of the leather industry.
Environmental regulation (marked as Regula): The leather industry is an industry with heavy water pollution (Kanagaraj et al., Citation2015), and regional environmental regulation has a potential influence on the leather industry (Han et al., Citation2017). This paper uses the proportion of investment in industrial wastewater treatment in GDP to characterize the intensity of industrial wastewater management by the regional government. Considering that investment in industrial wastewater management is mainly used for fixed assets investment. Taking the year 2000 as the base period, the fixed assets investment price index is used to deflate the actual completed investment in the industrial wastewater management in the region.
Foreign Direct Investment (marked as Fdi): The leather industry is an export-oriented industry (Brautigam et al., Citation2018). Studies have shown that the entry of foreign capital is conducive to strengthening the connection between the leather industry and the international market and improving the international competitiveness of industrial colony (Witkowska, Citation2011). This paper introduces foreign direct investment into the model to verify its specific effect on the level of leather industrial agglomeration. The proportion of province’s actual inflow of foreign direct investment in that year’s GDP is used to measure the degree of regional openness (Song et al., Citation2021).
Industrial structure (marked as Struc): The regional industrial layout is closely related to the scale of industrial development (Sun et al., Citation2017). This paper uses the proportion of gross industrial output value in gross domestic product (GDP) as a control variable to measure regional industrial scale.
2.2. Data sources
The data sample in this research consists of panel data from 29 provincial administrative regions in China from 2000 to 2019. Qinghai and other provinces were not involved due to the lack of data. The data on ‘number of workers in the leather industry’ from 2000 to 2019 in each province is obtained from the China Light Industry Yearbook (2001–2019) and China Industrial Economy Statistical Yearbook (2020). Data on the total amount of water resources in each province were obtained from the China Water Resources Bulletin of each province from 2000 to 2019; Actual completed investment data for industrial wastewater management were obtained from the China Statistics Yearbook on Environment 2001–2019 and the 2020 China Statistics Yearbook on Economic and Social Development. The rest of the total output value of animal husbandry, gross industrial output, gross domestic product, actual employment number in the whole society, R&D expenditure, freight turnover, and actual inflow of foreign capital was obtained from China Statistical Yearbook (2001–2020) and the statistical yearbooks of various provinces from 2001 to 2020.
3. Measurement of the leather industrial agglomeration
3.1. Characteristics of the leather industrial agglomeration
According to the results of the calculation of the location quotient of the Chinese leather industry during 2000–2019 (as shown in ), Shanghai, Jiangsu, Zhejiang, Fujian, Shandong and Guangdong were the main provinces with a high degree of concentration of the leather industry in 2000. In 2010, Shanghai, Zhejiang, Fujian, Jiangxi and Guangdong were the provinces with prominent development advantages of leather industrial agglomeration. According to the temporal trend, Shanghai, Zhejiang, Fujian, and Guangdong showed strong leading advantages in the leather industry. Although Guangdong province is still the main province where the leather industry is concentrated, as the location quotient of the leather industry in Guangdong province showed a fluctuating downward trend, indicating that the concentration of the leather industry in Guangdong province has dissipated.
Figure 1. China’s leather industry location entropy in 2000–2019.
Source: Authors compilation.
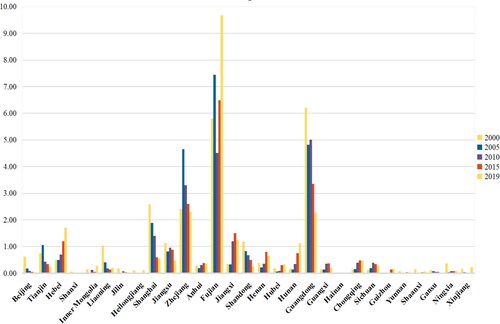
After 2010, Jiangxi province and Hebei province have shown significant advantages in the development of the leather industrial agglomeration. The location quotient index for Hebei province was found to have increased from 0.449 to 1.704 and the location quotient for Jiangxi province has increased from 0.349 to 1.236. This indicates that the agglomeration pattern of the Chinese leather industry has changed, where the leather industry has shown a trend of transforming from coastal provinces such as Guangdong province to inland areas, including Jiangxi, Hebei and Hunan provinces. It also reflects an overall trend of Chinese industrial diffusion from the coastal to the inland area. The reason for this trend is the serious impact of the 2008 international financial crisis on the Chinese light industry and the subsequent implementation of the corresponding macro-policy, such as the planning for the adjustment and revitalization of the light industry and the guide for the structural adjustment of the leather industry. During this period, the government response significantly affected the spatial distribution and evolution of industrial agglomeration.
3.2. The trend of temporal-spatial evolution of industrial leather agglomeration
According to the results of the calculation of the standard deviation ellipse method (as shown in ), the spatial development characteristics of the leather industry from 2000 to 2019 can be summarized as follows: Generally, the leather industry is moving towards the inland with its main body restricted in the first phase and expanded in the later phases.
Figure 2. The spatial pattern of Chinese leather industry.
Source: Authors compilation.
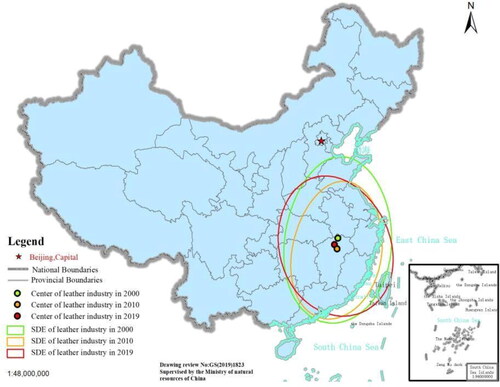
First, the elliptical center of the leather industry is mainly located in Jiangxi Province (116.163°E∼116.695°E, 28.529°N∼28.992°N), the spatial center of the leather industry showed a trend of moving west during 2000–2019, with an overall movement of 59.052 km westward. The results indicate that the Chinese leather industry is shifting from the southeast coastal areas to the west.
Secondly, the core area of the leather industrial agglomeration is between 1,298,800 km2 and 1,865,200 km2. During 2000–2010, the main body of the leather industrial agglomeration space was constrained, and during 2010–2019, the core area of the industrial space agglomeration showed a trend of expansion. All these reflect the sign of transformation of leather industrial agglomeration from a spatial diffusion development model to an agglomeration development model.
Third, the spatial devastation of the leather industry is due to the spatial ellipse (the ratio between the long and short axes and the length of the long axis) is between 0.124 and 0.395, and this trend expanded first and narrowed significantly in the later phase. According to oblateness and azimuth angle, during 2000–2010, the agglomeration direction had no significant change and there was mainly a shrink of the agglomeration scale. During 2010–2019, the direction of industrial leather agglomeration was counterclockwise. This shows that the provinces located in the northwest of the ellipse to the leather industry’s pulling role have increased, for example, Hubei, Henan, and other province.
3.3. Spatial spillover effects of the leather industrial agglomeration
The global Moran’s I index of the leather industry location quotient from 2000 to 2019 was calculated to verify the spatial dependence of the leather industry between regions (as shown in ).
Figure 3. Moran’s I of leather industry agglomeration from 2000 to 2019.
Source: Authors compilation.
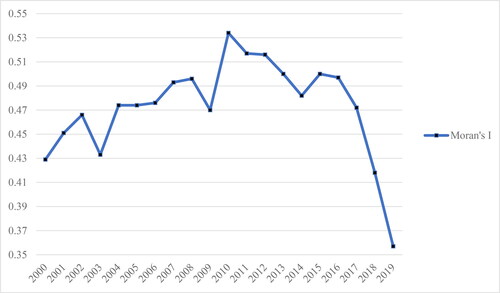
It can be seen from that the Moran’s I of Chinese leather industrial agglomeration in this period were all positive. It can be seen that the p-value of the spatial autocorrelation analysis showed 0.000 value and the z score was greater than 1.65, which showed valid results through the significance test. Results of Moran’s I index calculations showed that the leather industrial agglomeration had a positive spatial correlation during 2000–2019. In addition, continuous positive values indicate that the leather industry agglomeration presents a stable diffusion effect and spatial clustering occurs among provinces with a high degree of leather industry specialization.
However, from the changing trend of Moran’s I, the development of the Chinese leather industry can be divided into two phases. Firstly, the Moran’s I index showed a fluctuating and rising trend from 2000 to 2010, which indicates that the diffusion effect of the leather industrial agglomeration on surrounding area at this stage is more significant. From 2010 to 2019, the Moran’s I index reached the highest value of 0.534 in 2010, and further showed a continuous downward trend, which indicates that the diffusion effect of the leather industrial agglomeration on the surrounding area at this phase is weakened. The possible reason is that the ASEAN-China Free Trade Agreement, which came into effect in 2010 canceled the import tariff on leather products from China to ASEAN countries, which weakened the domestic correlation of the leather industry.
4. Results and discussion
4.1. Results of spatial econometric model
Before parameter estimation, it was essential to determine the suitability of model first. According to the estimation and testing procedure of the spatial panel econometric model proposed by Elhorst (Citation2014), the two questions needed answers. For instance, which spatial panel model should be chosen and which fixed effects should be included. Therefore, in the first phase this paper performed parameter estimation and LM test on the traditional mixed panel data model, which excludes the spatial interaction effect (as shown in ).
Table 1. Regression results of spatial models.
The results showed that the LM test for spatial auto regression (SAR) and the spatial error model (SEM) were both significant at level 1%, which indicated that there is a spatial spillover effect on the leather industrial agglomeration. Combining with the test results of the Moran index, a spatial regression model should be chosen for parameter estimation. Second, this paper evaluated the SAR model and the SEM model to check which is more suitable for parameter estimation and which fixed effect should be included in this research. The test results found that the LM robustness test values of the SEM and SAR models were significant. Meanwhile, the spatial durbin model (SDM) could not be simplified into SEM or SAR by the Wald test and likelihood ratio (LR); it was determined by Hausman’s test that the SDM with two-way temporal-spatial fixed effects will be used for the empirical test in this paper.
It can be noted that the fitting effect of the spatial durbin model is better than the spatial auto regression and the spatial error model. However, the regression coefficient of the spatial durbin model failed to reflect the regression effect of the explanatory variable on the explained variable. It was also necessary to use the partial differentiation proposed by Lesage and Pace to further decompose the influence of various factors into direct effects, indirect effects, and total effects (as shown in ).
Table 2. Effect decomposition results of the spatial durbin model.
From the perspective of direct effects, water resources had a certain impact on the industrial agglomeration of leather at the 10% level. The results showed that the direct effect is dominant, but water resources have a negative effect on the industrial agglomeration of leather. The possible reason is that, the more abundant the water resources in the province, the more water flows to more positively export-oriented industries with higher added values. In particular, after the decision of the State Council on Accelerating the Reform and Development of Water Conservancy and Opinions of the State Council on Implementing the Most Strict Water Resources Management System was issued, the market access of enterprises with high water consumption, high pollution, and the traditional formation of industrial agglomeration were restricted. Therefore, the strict regulation of water resources had disturbed the market-oriented industrial agglomeration.
The output value of animal husbandry and the labor force had a positive influence on the direct effect and total effect of the leather industrial agglomeration and showed significance at 1%. But there were some characteristic difference between the direct and indirect effect. Leather industrial agglomeration had a significant driving effect on the upstream and downstream industries of animal husbandry, and the direct and indirect effects were both positive. In terms of labor factors, the results drawn in this paper are consistent with those of Liu and Zhang (Citation2022). While the Chinese manufacturing industry is pursuing innovation and development, the leather industry is still a traditional labor-intensive industry at present (Omoloso et al., Citation2021). The development of the leather industry relies on a large number of low-cost skilled labor. Human capital can provide a sufficient reserve force for the agglomeration of the leather industry. Additionally, the agglomeration of traditional labor-intensive industries, such as the leather industry, will inevitably attract cross-regional migration labor (Suzuki et al., Citation2018). Therefore, labor endowment is an important factor affecting the leather industrial agglomeration.
Foreign investment had a significantly positive influence on the industrial agglomeration of leather. The indirect effect was nearly 6 times stronger than the direct effect, which indicates that the higher the actual use of foreign direct investment, the greater the multiplier amplification of the indirect effect of investment and the stronger the attraction to the leather industrial agglomeration. Foreign investment that reflects the openness and activeness of the regional market is one of the main driving forces for the agglomeration of leather companies, confirming the evolutionary phenomenon in the higher spatial agglomeration of the eastern region over the western region.
The industrial structure showed a negative impact on the direct and total effects of the leather industrial agglomeration at a significant level of 10%, which shows that the scale of regional industrial development is not a key factor in attracting leather companies to enter the local market. Under the guidance of the intensive development strategy, the level of agglomeration of China’s industry cluster has been significantly improved. But the economic effect of industrial clustering is not prominent enough, and a vertical value chain has not yet been formed within the region to focus on different levels of industrial agglomeration (Grimes & Du, Citation2022).
Logistics showed a positive influence on the direct effect of industrial leather agglomeration at a significance level of 5% and the regression coefficient was 0.205. This indicates that the logistics level is one of the key factors for leather industrial agglomeration. Consistent with existing studies, Zhu et al. (Citation2015) reported that the logistics industry and the manufacturing industry commonly present an agglomeration trend, and the construction of the logistics system promotes the agglomeration distribution of the manufacturing industry (Wang et al., Citation2021).
The indirect effect of the investment in research and development on industrial agglomeration of leather was 0.632 and the total effect was 0.698 with a positive significance of 1%. This result indicates that technological innovation is one of the key driving forces of industrial leather agglomeration. Moreover, the level of local technological innovation will improve the level of leather industrial agglomeration in other regions along with knowledge spillovers. According to the theory of Marshall externalities, knowledge spillovers are the key factors that cause a certain industry to agglomerate in a certain place (Kondo, Citation2013). Therefore, the level of regional innovation research and development investment is a key factor that drives the continued agglomeration of the leather industry.
4.2. Results of robustness test
Taking into account the certain limitations in constructing a weight matrix solely based on economic distance, this article used the 'road mileage function between provincial capitals’ to construct a geographic distance weight matrix W1, where the element wij of matrix W1 is represented by the reciprocal of the nearest road mileage of provincial capital cities in the i and j regions. In addition, in order to simultaneously reflect the spatial influence of geographic distance, as well as the regional spillover effect and radiation effect of economic factors, a nested weight matrix W2 of geographic distance and economic distance is constructed. The element wij in the nested weight matrix W2 of geographic and economic distance is the weighted value of ‘the reciprocal of the nearest road travel between the provincial capitals of Region i and j’ and ‘the reciprocal of the absolute difference between the annual average GDP per capita in Region i and j’. By constructing different weight matrices, the robustness test of the baseline regression results was carried out to verify the reliability of the simulation results. According to the aforementioned model selection strategy, the spatial durbin model with two-way fixed effects is adopted.
Comparing the parameter test results in the geographic distance weight matrix (W1), geographic matrix and economic distance nested weight matrix (W2) with the baseline spatial durbin model (as shown in ). It can be revealed that the parameter estimation results are consistent with the baseline regression, indicating that the baseline regression results are reliable. In addition, to further overcome the possible endogenous effects in the model (Tran et al., Citation2019), the systematic generalized method of moment (SGMM) method is also used to check the robustness of the model.
Table 3. Results of robustness tests.
4.3. Results of group regression
After 2011, the Chinese leather industrial agglomeration pattern has changed significantly. From the perspective of the three-digit industry code, the adjustment of the industry classification of the leather industry was mainly based the on ‘Classification of National Economic Industries’ in 2011, which included the ‘footwear industry’ into the major category of the leather industry. Combining these factors, this paper used samples in phases for further analysis to explore the dominant force in the historical changes of the Chinese leather industry and to examine whether the adjustment of industry classification standards affects the robustness of the results. By applying the test procedure of the above mentioned model, the spatial durbin model with fixed effects was finally determined in both phases (i.e. 2000–2010 and 2011–2019), the results are shown in .
Table 4. Estimation results of the group regression.
The influence of each factor on the industrial leather agglomeration in the two phases was decomposed into direct, indirect, and total effect (as shown in ). Comparing the parameter estimation results at the two phases, it can be noted that raw resources and industrial structure have become the key factors affecting the leather industry agglomeration for a long time. And the influence of water resources on the leather industrial agglomeration has gradually weakened. The level of logistics was a key factor for the leather industry agglomeration during 2000–2010. With the implementation of policies such as the Logistics Industry Adjustment and Revitalization Planning in 2009 and the long-term coordinated development of manufacturing and producer services, a modern overall logistics service system in China was established (Ali et al., Citation2021). The logistics development service capabilities of various regions had improved significantly and the logistics level in the leather industry agglomeration was significantly lower than the previous phase (2000–2010) in the past 10 years.
Table 5. Effect decomposition results of the group regression.
During the year 2000–2010, the direct effect of foreign direct investment on the leather industry agglomeration showed negative results, with an influence coefficient of −0.075. During 2011–2019, the direct, indirect, and total effects of foreign direct investment on the leather industry were positively significant, with a total effect influence coefficient of 0.352. The reason is that the location selection for FDI may depend on path dependencies in the initial (Mahbub et al., Citation2022). In the later period, with an easy access of the outer world to the Chinese markets, foreign direct investment and industrial agglomeration tend to have a positive effect and can promote each other.
In contrast to existing studies, this paper distinguishes the main factors affecting industrial agglomeration in different time periods. Furthermore, it is worth noting that environmental regulations, innovative research and development investment had a significant impact on the industrial agglomeration of the leather industry. The direct and total effects of environmental regulation on the agglomeration of the leather industry were negative and the regression coefficient of the total effect was −0.134. Therefore, the original extensive growth style was gradually abandoned in order to reduce its negative impact on the environment. Taking a path of innovation-driven development was an inevitable requirement for industrial transformation and upgrading. At present, the heavy environmental burden of small and medium enterprises and weak innovation capabilities of enterprises are the main challenges with which the leather industry is dealing in the country. In addition, heterogeneity tests for different regions were conducted in this paper, as shown in the Appendix.
5. Conclusions and policy implications
Export-oriented industries, such as the leather industry, are particularly affected by trade frictions as a result of multiple uncertainties, such as the complex economic environment at home and abroad. In this context, this paper accurately assesses the spatial pattern evolution characteristics and development trend of the Chinese leather industry over the last 20 years and systematically identifies the key driving factors of industrial agglomeration. The findings are as follows:
Firstly, exploratory spatial data analysis revealed that the three provinces, including Zhejiang, Fujian, and Guangdong province, have been the leading provinces for leather industrial agglomerations for several years. However, after the year 2010, inland areas such as Jiangxi and Hebei demonstrated a late-mover advantage of leather industry agglomeration.
Secondly, the spatial econometric analysis showed that resource endowment is the dominant force in leather industrial agglomeration. For the leather industry, as a traditional labor-intensive industry, labor resources were the driving force to attract industrial agglomeration. Additionally, the actual use of foreign investment showed a significant positive influence, which indicated that economic extroversion is also one of the leading forces in the development of the leather industry.
Thirdly, by comparing the affecting factors of the leather industrial agglomeration in different periods, it was found that the innovation capability has gradually become the dominant force affecting the development of the leather industry. It also reflects the industrial policy orientation in China since the implementation of the ‘11th Five-Year Plan’, which is the effect of innovation-driven industrial development to promote the optimization and upgrading of the industrial structure.
Based on these conclusions, several policy recommendations are proposed. On one hand, overall planning can be made based on the spatial pattern of leather industrial agglomeration and industrial transfer pathway. Due to the complex and changing global situation, the inland provinces should be promoted to actively undertake the leather industry transfer tasks. In addition to paying proper attention to the export-oriented advantages of the leather industry, there is an urgent need to develop the potential of the domestic market to better connect the domestic markets with the international markets. It will lead to an increase in innovation investment and to an upgrade of the driving force of new innovation in the transformation and upgrading of the industry.
On the other hand, specific measures need to be formulated according to the in-depth driving mechanism for the evolution of the industrial structure. In the important phase of the development of the high-quality leather industry, support for innovation research and development and technological progress should be improved, industrial transformation and upgrading should be promoted, and green manufacturing should be deepened through benign agglomeration of the leather industry.
Additionally, the correlation effect between industries is not included in the research due to the difficulty of data acquisition. And in the future research could analyze other industries how to build regional vertical value chains and how to achieve integration in industrial agglomeration.
Disclosure statement
No potential conflict of interest was reported by the authors.
Additional information
Funding
References
- Abdulrahman, M. D., Gunasekaran, A., & Subramanian, N. (2014). Critical barriers in implementing reverse logistics in the Chinese manufacturing sectors. International Journal of Production Economics, 147, 460–471. https://doi.org/10.1016/j.ijpe.2012.08.003
- Ahmad, M., Khan, Z., Anser, M. K., & Jabeen, G. (2021). Do rural-urban migration and industrial agglomeration mitigate the environmental degradation across China’s regional development levels? Sustainable Production and Consumption, 27, 679–697. https://doi.org/10.1016/j.spc.2021.01.038
- Ali, U., Li, Y. X., Wang, J. J., Yue, X. H., & Chang, A. (2021). Dynamics of outward FDI and productivity spillovers in logistics services industry: Evidence from China. Transportation Research Part E: Logistics and Transportation Review, 148, 102258. https://doi.org/10.1016/j.tre.2021.102258
- An, H. S. (2009). Principles of new economic geography. Economic Science Press.
- Bai, J. H., Wang, Y., Jiang, F. X., & Li, J. (2015). R&D, element flow, spatial knowledge spillovers and economic growth. Economic Research, 52(07), 109–123.
- Brautigam, D., Weis, T., & Tang, X. Y. (2018). Latent advantage, complex challenges: Industrial policy and Chinese linkages in Ethiopia’s leather sector. China Economic Review, 48, 158–169. https://doi.org/10.1016/j.chieco.2016.06.006
- Carboni, O. A., & Medda, G. (2021). External R&D and product innovation: Is over-outsourcing an issue? Economic Modelling, 103, 105601. https://doi.org/10.1016/j.econmod.2021.105601
- Chen, Y. B., Yin, G. W., & Liu, K. (2021). Regional differences in the industrial water use efficiency of China: The spatial spillover effect and relevant factors. Resources, Conservation and Recycling, 167, 105239. https://doi.org/10.1016/j.resconrec.2020.105239
- Cole, M. A., Elliott, R. J. R., & Okubo, T. (2010). Trade, environmental regulations and industrial mobility: An industry-level study of Japan. Ecological Economics, 69(10), 1995–2002. https://doi.org/10.1016/j.ecolecon.2010.05.015
- Commendatore, P., Kubin, I., Petraglia, C., & Sushko, I. (2014). Regional integration, international liberalisation and the dynamics of industrial agglomeration. Journal of Economic Dynamics and Control, 48, 265–287. https://doi.org/10.1016/j.jedc.2014.07.011
- Dicken, P. (1998). Global shift: Transforming the world economy. Paul Chapman Publishing.
- Drucker, J., & Feser, E. (2012). Regional industrial structure and agglomeration economies: An analysis of productivity in three manufacturing industries. Regional Science and Urban Economics, 42(1–2), 1–14. https://doi.org/10.1016/j.regsciurbeco.2011.04.006
- Elhorst, J. P. (2014). Spatial econometrics: From cross-sectional data to spatial panels. Springer.
- Fahad, S., Alnori, F., Su, F., & Deng, J. (2022). Adoption of green innovation practices in SMEs sector: Evidence from an emerging economy. Economic Research-Ekonomska Istraživanja, 35(1), 5486–5501. https://doi.org/10.1080/1331677X.2022.2029713
- Fahad, S., Su, F., & Wei, K. (2023). Quantifying households' vulnerability, regional environmental indicators, and climate change mitigation by using a combination of vulnerability frameworks. Land Degradation and Development, 34(3), 859–872. https://doi.org/10.1002/ldr.4501
- Freedman, M. L. (2008). Job hopping, earnings dynamics, and industrial agglomeration in the software publishing industry. Journal of Urban Economics, 64(3), 590–600. https://doi.org/10.1016/j.jue.2008.07.002
- Grimes, S., & Du, D. B. (2022). China’s emerging role in the global semiconductor value chain. Telecommunications Policy, 46(2), 101959. https://doi.org/10.1016/j.telpol.2020.101959
- Guan, W., Man, Q., & Xu, S. (2019). The cluster pattern and effect analysis of Liaoning manufacturing industry and its related industries. Geographical Research, 38(08), 1979–1992.
- Haggett, P. (1965). Location analysis in human geography. Edward Arnold.
- Han, C., Zhang, W. G., & Feng, Z. B. (2017). How does environmental regulation remove resource misallocatio: An analysis of the first obligatory pollution control in China. China Industrial Economics, 4, 115–134.
- Hansen, É., de Aquim, P. M., & Gutterres, M. (2021). Environmental assessment of water, chemicals and effluents in leather post-tanning process: A review. Environmental Impact Assessment Review, 89, 106597. https://doi.org/10.1016/j.eiar.2021.106597
- He, C. F., & Hu, X. (2019). Evolution of Chinese industrial geography since reform and opening-up. Acta Geopraphica Sinica, 74(10), 1962–1979.
- Hu, G. Y., Wang, J., Fahad, S., & Li, J. (2022). Influencing factors of farmers’ land transfer, subjective well-being, and participation in agri-environment schemes in environmentally fragile areas of China. Environmental Science and Pollution Research, 30, 4448–4461. https://doi.org/10.1007/s11356-022-22537-4
- Imaizumi, A., Ito, K., & Okazaki, T. (2016). Impact of natural disasters on industrial agglomeration: The case of the Great Kantō Earthquake in 1923. Explorations in Economic History, 60, 52–68. https://doi.org/10.1016/j.eeh.2015.11.005
- Ji, S. H., Zhu, Y. M., & Zhang, X. (2016). Study of industrial agglomeration improving misallocation of resources. China Industrial Economics, 6, 73–90.
- Kanagaraj, J., Senthilvelan, T., Panda, R. C., & Kavitha, S. (2015). Eco-friendly waste management strategies for greener environment towards sustainable development in leather industry: A comprehensive review. Journal of Cleaner Production, 89, 1–17. https://doi.org/10.1016/j.jclepro.2014.11.013
- Karuppiah, K., Sankaranarayanan, B., Ali, S. M., Jabbour, C. J. C., & Bhalaji, R. K. A. (2021). Inhibitors to circular economy practices in the leather industry using an integrated approach: Implications for sustainable development goals in emerging economies. Sustainable Production and Consumption, 27, 1554–1568. https://doi.org/10.1016/j.spc.2021.03.015
- Kondo, H. (2013). International R&D subsidy competition, industrial agglomeration and growth. Journal of International Economics, 89(1), 233–251. https://doi.org/10.1016/j.jinteco.2012.04.004
- Krugman, P. (1991). Increasing returns and economic geography. Journal of Political Economy, 99(3), 483–499. https://doi.org/10.1086/261763
- Liu, X. P., & Zhang, X. L. (2021). Industrial agglomeration, technological innovation and carbon productivity: Evidence from China. Resources, Conservation and Recycling, 166, 105330. https://doi.org/10.1016/j.resconrec.2020.105330
- Liu, Y., & Zhang, X. (2022). Does labor mobility follow the inter-regional transfer of labor-intensive manufacturing? Habitat International, 124, 102559. https://doi.org/10.1016/j.habitatint.2022.102559
- Liu, Y., Zhang, X., Pan, X., Ma, X., & Tang, M. (2020). The spatial integration and coordinated industrial development of urban agglomerations in the Yangtze River Economic Belt, China. Cities, 104, 102801. https://doi.org/10.1016/j.cities.2020.102801
- Mahbub, T., Ahammad, M. F., Tarba, S. Y., & Mallick, S. M. Y. (2022). Factors encouraging foreign direct investment (FDI) in the wind and solar energy sector in an emerging country. Energy Strategy Reviews, 41, 100865. https://doi.org/10.1016/j.esr.2022.100865
- Mammadova, A., Behagel, J., & Masiero, M. (2020). Making deforestation risk visible: Discourses on bovine leather supply chain in Brazil. Geoforum, 112, 85–95. https://doi.org/10.1016/j.geoforum.2020.03.008
- Marshall, A. (1961). Principles of economics. Cambridge University Press.
- Moktadir, M. A., Dwivedi, A., Khan, N. S., Paul, S. K., Khan, S. A., Ahmed, S., & Sultana, R. (2021). Analysis of risk factors in sustainable supply chain management in an emerging economy of leather industry. Journal of Cleaner Production, 283, 124641. https://doi.org/10.1016/j.jclepro.2020.124641
- Mori, T., & Smith, T. E. (2015). On the spatial scale of industrial agglomerations. Journal of Urban Economics, 89, 1–20. https://doi.org/10.1016/j.jue.2015.01.006
- Ning, L. T., Wang, F., & Li, J. (2016). Urban innovation, regional externalities of foreign direct investment and industrial agglomeration: Evidence from Chinese cities. Research Policy, 45(4), 830–843. https://doi.org/10.1016/j.respol.2016.01.014
- Omoloso, O., Mortimer, K., Wise, W. R., & Jraisat, L. (2021). Sustainability research in the leather industry: A critical review of progress and opportunities for future research. Journal of Cleaner Production, 285, 125441. https://doi.org/10.1016/j.jclepro.2020.125441
- Ramachandran, R., Sasidharan, S., & Doytch, N. (2020). Foreign direct investment and industrial agglomeration: Evidence from India. Economic Systems, 44(4), 100777. https://doi.org/10.1016/j.ecosys.2020.100777
- Scott, A. J. (2006). The changing global geography of low-technology, labor-intensive industry: Clothing, footwear, and furniture. World Development, 34(9), 1517–1536. https://doi.org/10.1016/j.worlddev.2006.01.003
- Shao, S., Tian, Z. H., & Yang, L. L. (2017). High speed rail and urban service industry agglomeration: Evidence from China’s Yangtze River Delta region. Journal of Transport Geography, 64, 174–183. https://doi.org/10.1016/j.jtrangeo.2017.08.019
- Song, J., Geng, L., & Fahad, S. (2022). Agricultural factor endowment differences and relative poverty nexus: An analysis of macroeconomic and social determinants. Environmental Science and Pollution Research, 29, 52984–52994. https://doi.org/10.1007/s11356-021-18470-7
- Song, W. F., Mao, H., & Han, X. F. (2021). The two-sided effects of foreign direct investment on carbon emissions performance in China. The Science of the Total Environment, 791, 148331.
- Su, F., Liang, X., Cai, S., Chen, S., & Fahad, S. (2022). Assessment of parent-subsidiary companies’ geographical distance effect on corporate social responsibility: A case of A-share listed companies. Economic Research-Ekonomska Istraživanja, 35(1), 4922–4946. https://doi.org/10.1080/1331677X.2021.2019597
- Sun, J. W., Zhang, K. Y., An, H. S., He, C. F., & Pan, W. Q. (2017). Commentary on establishing a more effective and new mechanism for regional coordinated development. China Industrial Economics, 11, 26–61.
- Su, F., Song, N., Shang, H., & Fahad, S. (2022). Research on the impact of economic policy uncertainty on corporate social responsibility: A case of A-share listed companies as an example. Plos One, 17(6), e0269165. https://doi.org/10.1371/journal.pone.026916s
- Suzuki, A., Mano, Y., & Abebe, G. (2018). Earnings, savings, and job satisfaction in a labor-intensive export sector: Evidence from the cut flower industry in Ethiopia. World Development, 110, 176–191. https://doi.org/10.1016/j.worlddev.2018.05.029
- Tillé, Y., Dickson, M. M., Espa, G., & Giuliani, D. (2018). Measuring the spatial balance of a sample: A new measure based on Moran’s I index. Spatial Statistics, 23, 182–192. https://doi.org/10.1016/j.spasta.2018.02.001
- Tong, J. D., Sheng, B., Jiang, D. C., Yan, B., Dai, J. P., & Liu, C. (2020). Global economy amid the COVID-19 Outbreak and Challenges for China. International Economic Review, 3, 9–28 + 4.
- Tran, N. V., Alauddin, M., & Tran, Q. V. (2019). Labour quality and benefits reaped from global economic integration: An application of dynamic panel SGMM estimators. Economic Analysis and Policy, 63, 92–106. https://doi.org/10.1016/j.eap.2019.04.014
- Wang, W., Rehman, M. A., & Fahad, S. (2022). The dynamic influence of renewable energy, trade openness, and industrialization on the sustainable environment in G-7 economies. Renewable Energy. 198, 484–491. https://doi.org/10.1016/j.renene.2022.08.067
- Wang, X. W., Zhang, Y. S., & Chen, N. X. (2021). Modern service industry agglomeration and its influencing factors: Spatial interaction in Chinese cities. Economic Research-Ekonomska Istraživanja, 34, 1–21.
- Witkowska, J. (2011). Globalization and foreign direct investment in the textile, garment, and leather industry. Comparative Economic Research, 14(1), 5–18.
- Yang, K., Fahad, S., & He, H. (2022). Assessing the cooking oil fume exposure impacts on Chinese women health: An influential mechanism analysis. Environmental Science and Pollution Research, 29(35), 53860–53872. https://doi.org/10.1007/s11356-022-19368-8
- Yang, Z. S., Song, T., & Chahine, T. (2016). Spatial representations and policy implications of industrial co-agglomerations, a case study of Beijing. Habitat International, 55, 32–45. https://doi.org/10.1016/j.habitatint.2016.02.007
- Yuan, H., Feng, Y., Lee, C.-C., & Cen, Y. (2020). How does manufacturing agglomeration affect green economic efficiency? Energy Economics, 92, 104944. https://doi.org/10.1016/j.eneco.2020.104944
- Zheng, L. (2021). Job creation or job relocation? Identifying the impact of China’s special economic zones on local employment and industrial agglomeration. China Economic Review, 69, 101651. https://doi.org/10.1016/j.chieco.2021.101651
- Zhu, H., Zhou, G. G., & Ren, G. Y. (2015). Research on spatial co-agglomeration between manufacturing industry and logistics industry: A case study of six provinces in central China. Economic Geography, 35(11), 117–124.