
 ?Mathematical formulae have been encoded as MathML and are displayed in this HTML version using MathJax in order to improve their display. Uncheck the box to turn MathJax off. This feature requires Javascript. Click on a formula to zoom.
Abstract
The trade-off between environmental regulation and job creation has been a dilemma for policymakers in the past decades. Exploiting the enterprise-level sample data, we conduct a difference-in-difference-in-differences (DDD) specification to estimate the overall effect of China’s Two Control Zones (TCZ) policy on labor demand, measured as the number of enterprise-level employees. We find that the industrial enterprises in TCZ cities, where the TCZ policy has been implemented after 1998, employed fewer workers in more polluting industries. Furthermore, these employment effects are very heterogeneous among different enterprise ownerships and control zones. The TCZ policy significantly decreased the labor demand in private enterprises or those located in the Acid Rain Control Zones (ARCZ) but had little impact on their state-owned and foreign-invested counterparts or those located in the Sulfur Dioxide Pollution Control Zones (SPCZ).
1. Introduction
In recent years, as the Chinese government began to pay attention to the potential costs of environmental regulations, it was facing a hard trade-off between economic development and environmental protection when designing relevant policies. Among them, what impact environmental regulations brought about on labor demand has increasingly become a hot economic issue that looms large in policy debates. Popular thinking is that environmental regulation may lead to additional costs, causing polluting firms to cut back on their output and various inputs, resulting in a decline in labor demand, but pollution abatement activities may also be labor-enhancing in some cases. Therefore, the overall impact of environmental regulation on labor demand is uncertain from a purely theoretical perspective and requires further empirical studies.
To our knowledge, the existing empirical studies on the nexus between environmental regulation and labor demand are relatively scarce, which focused on the regulation-induced employment effects in developed countries. Most studies have found no strong relationship or relatively modest effects of environmental regulations on labor demand (Coglianese et al., Citation2014). This paper contributes to the literature on three grounds. Firstly, our study bridges a long-standing gap in the existing literature focusing on developed countries by providing new evidence from China.
Secondly, we resolve the potential endogeneity issue by utilizing the implementation of the TCZ policy, a well-known quasi-natural experiment in China, and then construct a DDD specification to identify the impact of environmental regulation on labor demand, by which all time-varying and time-invariant omitted variables at the industry and city levels have been properly dealt with.
Thirdly, we exploit the most comprehensive enterprise-level data in China to examine the impact of the TCZ policy on labor demand and also highlight the heterogeneous effects among different ownerships and regions, which might provide support for the cost-benefit assessment of China’s environmental regulations.
The remainder of this paper is organized as follows. The institutional background will be provided in the following section. Section 3 is the literature review. Section 4 describes the sample dataset and the estimation methodology. We present the empirical results of our benchmark model, heterogeneity analyses, and a series of robustness checks in Sections 5 and 6, respectively. Our paper concludes in Section 7.
2. Institutional background
In China, coal has always been the most important source of energy consumption, and thus emissions from coal combustion were a major contributor to ambient air pollution and acid rain for many years. After years of treatment,
emissions in China have been effectively controlled and are no longer one of the binding emission reduction targets since the 14th Five Year Plan (2020–2025). Nevertheless, focusing on the successful experience and economic impacts of
pollution control policies will not only help other developing countries avoid detours in pollution control, but also enable us to draw useful lessons from the past and conduct referential cost-benefit analyses when solving current environmental problems. Among many historical experiences, setting up the TCZ is undoubtedly the most representative and influential one, and is widely considered the key to China’s remarkable achievements in this regard.
In 1998, the State Council of China finally approved the establishment of TCZ, which consisted of ARCZ and SPCZ, and was committed to controlling the emissions from coal-burning in production, especially from the power industry. Considering the different characteristics of acid rain erosion and
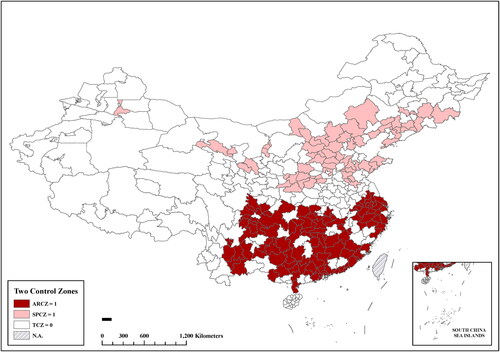
pollution, basic conditions for assigning ARCZ and SPCZ are determined, respectively. According to the criteria of TCZ designation, 175 out of total 334 prefecture-level cities were designated as TCZ cities, which approximately accounted for 40.6% of total population, 62.4% of GDP, and 58.9% of total
emissions in 1995. shows the geographic distribution of TCZ and non-TCZ cities.
Figure 1. Geographical distribution of TCZ and non-TCZ cities.
Notes: This figure shows the geographical distribution of TCZ and non-TCZ cities in China. The dark red, light red, and white regions are ARCZ, SPCZ, and non-TCZ cities, respectively.
Source: “The Official Reply of the State Council Concerning Acid Rain Control Zones and Sulfur Dioxide Pollution Control Zones”.
Once a city was assigned a TCZ status, more stringent environmental regulations were implemented. The targets of this regulation were provided for the short and long term. By 2000, emissions should be preliminarily controlled;
concentrations in the air of municipalities directly under the central government, provincial capitals, special economic zones, coastal open cities, and key tourist cities achieve the national environmental quality standard; and the situation of acid rain pollution will be alleviated. By 2010,
emissions should be curbed and controlled within the 2000 level;
concentration in all urban air meets the national environmental quality standards; the areas of precipitation pH value less than 4.5 in acid rain control zones will be reduced to below the 2000 level.
The TCZ policy was further enhanced in the main content of the 10th Five-Year Plan in 2000 and its successor in 2005. Consequently, emissions have been greatly reduced and reached a peak around 2005, and
intensity has also been effectively controlled for a long time. Moreover, nearly 60% of the TCZ cities reached the national Class II standard for the averaged ambient
concentration and 84.3% of severely
polluting firms also met the reduction mandates in 2000, and 94.9% of the TCZ cities had achieved the national Class II standard for the average ambient
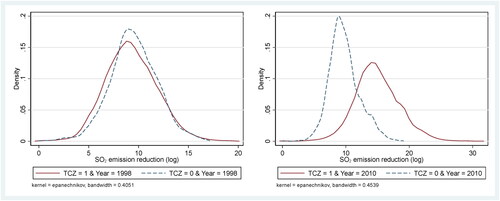
concentration, with no city reporting Air Quality Index above the national Class III standard in 2010. As shown in ,
emissions reductions of treated firms in TCZ cities have increased fundamentally over the years 1998-2010, indicating that the long-standing deteriorating situation of
pollution in China has been greatly improved by the implementation of the TCZ policy.
Figure 2. The difference in emission reduction between TCZ and non-TCZ cities.
Notes: This figure plots the distribution of emission reduction (log) of industrial enterprises in TCZ and non-TCZ cities in the year when the TCZ policy was issued and ended.
Source: China Environmental Statistics Database in 1998 and 2010.
3. Literature review
Debates about the effect of the environmental regulation on labor demand are often framed in terms of the ‘jobs versus the environment’ trade-off, especially in areas where declines in labor demand for manufacturing industries have been a hotspot. Although some scholars believed that environmental regulation and its attendant burdens might weaken the overall competitiveness of regulated industries (Palmer et al., Citation1995, Becker & Henderson, Citation2000, Greenstone, Citation2002, Greenstone et al., Citation2012, Walker, Citation2013), it might also stimulate new job opportunities by stimulating firms to innovate in abatement technologies and thereby create so-called ‘green jobs’ (Porter & Van der Linde, Citation1995, Mohr, Citation2002, Greaker, Citation2006, Mohr & Saha, Citation2008, Lanoie et al., Citation2011, Ambec et al., Citation2013).
In earlier studies, Berman and Bui (Citation2001) built a theoretical model to analyze the underlying cost-minimizing activities of treated enterprises and used the plant-level dataset to identify the employment effects of local air pollution policies implemented in the South Coast Air Quality Management District (SCAQMD) of California. Based on their previous studies, Morgenstern et al. (Citation2002) investigated the relationships between environmental expenditures and changes in labor demand from four major heavy polluting industries, and eventually found no statistically significant changes in labor demand across these industries in the years 1979-1991. Gray et al. (Citation2014) incorporated the industry-level data into the microeconomics model derived by Berman and Bui (Citation2001) and shed light on how differences in industry competitiveness accentuate or attenuate the effects of environmental regulation on labor demand.
Empirical studies on employment effects of county non-attainment status concerning the National Ambient Air Quality Standards (NAAQS) have won the widespread favor of many scholars. Using plant-level data and a DiD model, Greenstone (Citation2002) found evidence indicating that during the first fifteen years after the 1970 Clean Air Act Amendment was introduced, there was a decrease in labor demand about 40000 jobs on average per year in plants located in non-attainment regions with stricter air pollution requirements. Following a similar approach, Walker (Citation2011, Citation2013) compared labor demand over time for polluting industries in counties that switched to non-attainment status under the 1990 Clean Air Act Amendments and found that the overall labor demand of polluting industries in these newly regulated counties was about 15% lower than other counties. Kahn and Mansur (Citation2013) also suggested that employment growth of energy-intensive industries in counties with stricter ozone non-attainment status was lower than elsewhere in the United States.
There are also some studies based on other environmental regulations implemented in the United States. Using the plant-level data in 1992-2007, Gray et al. (Citation2014) estimate the impacts of the EPA’s 1997 Cluster Rule on labor demand of pulp and paper industries, and found evidence of small positive effects for MACT-only plants and small negative effects for BAT plants, although employment effects are not always statistically significant. Ferris et al. (Citation2014) found little evidence of significant effects on labor demand for fossil fuel-fired power plants subjected to Phase I (1995-1999) of the EPA’s Trading Program, which was implemented under the Title IV of 1990 Clean Air Act Amendments. Although these findings from the United States vary between positive and negative, statistically significant and insignificant, they fairly and consistently indicate that environmental regulations lead to relatively limited or at most modest impacts on the aggregate labor demand.
As far as China is concerned, local governments at all levels are mutually in charge of the enforcement of environmental regulations, but the central government independently issues environmental regulations with very little input from local governments and relevant stakeholders. In addition, labor unions in China have weak bargaining power, tend to have inextricable political connections with the government, and thus play an insignificant role in defending the interests of their labor members. Hence, it’s expected that environmental regulation may have different employment effects in China. Unlike the previous research that has paid more attention to the average employment effects of China’s environmental regulations (Liu et al., Citation2017, Liu et al., Citation2021), our research sheds light on the heterogeneity of employment effects across the different industries, investigates the regulation-induced sectoral disparity in labor demand by using the DDD estimation strategy, and contributes to the existing empirical literature.
4. Data and estimation strategy
4.1. Data source and sample coverage
This paper combines two data sources to shed light on the effect of the TCZ policy on labor demand in China. The first one is the common Annual Surveys of Industrial Firms database conducted by the National Bureau of Statistics (NBS) of China from 1998 to 2006, which contains the accounting and financial information for all state-owned enterprises and other enterprises with sales above CNY5 million in China. The second one is the 3rd National Industrial Census collected by NBS in 1995 with a much wider scope of firms. We merge the two micro databases by matching the enterprise code, name, address, etc.
To account for the possibility that some enterprises might change their codes or names of business when restructuring, reorganizing or expanding, we further refer to the data and variables cleaning strategy suggested by Brandt et al. (Citation2012, Citation2014) studies to generate our re-cleaned enterprise-level data, and also take advantage of their industry concordances as consistent industry identifier. In addition, we also exploit the data-dropping methodology pioneered by Nie et al. (Citation2012) to deal with outliers. In addition, all nominal variables have been deflated at the province level (year 1995 = 100).
Our treatment and control groups in our matched sample datasets are generated by using the standard location indicator or the district code of China as well as the full postal address of enterprises. Our sample includes 321,394 observations and the period ranges from 1995 and 1998-2006. reports a brief description of all variables, the acronyms we use in the following empirical analyses, the number of observations, as well as the main summary statistics for both treatment and control groups. Although the mean values of our main variables in the two groups differ somewhat, the identifying assumption of the DDD estimator is common trends in the two groups prior to this regulation. We provide evidence that our dataset meets the common trends assumption in Section 5.1 below.
Table 1. Summary statistics.
4.2. Empirical specification
The time and regional variations in the adoption of the TCZ policy provide an opportunity for a DiD analysis. Specifically, we can compare the firm-level labor demand in TCZ cities before and after the adoption of the TCZ policy in 1998 with the corresponding change in non-TCZ cities during the same period. However, a concern about the DiD analysis is that there might be time-varying city characteristics related to the main variable of interest and then bias our benchmark estimates. But for comparison, we still report the empirical results based on a standard DiD model. The prime examples of omitted time-varying city-level variables are the agglomeration effect and the spillover effect, both of which are found to be critical determinants of industrial location choice (Arauzo-Carod et al., Citation2009, Millimet & Roy, Citation2016). One feasible way to address these issues in the literature is to additionally control the spatially lagged dependent variable (Wagner & Timmins, Citation2009, Gibbons & Overman, Citation2012). Nevertheless, this practice leads to a mechanical correlation between the error term and the lagged dependent variable in panel estimation and generates inconsistent estimates in DiD analysis (Angrist & Pischke, Citation2009).
In light of these potential concerns, we use the fact that industries with different emission intensity will be differently affected by the TCZ policy, and then add industrial variation (i.e., more versus less
polluting industries) to help with identification apart from time variation (i.e., before versus after 1998) and regional variation (i.e., TCZ cities versus non-TCZ cities), and finally conduct a DDD specification (Yelowitz, Citation1995) as our main estimation methodology. With the help of industrial variation, the DDD specification allows to control for what cannot be controlled in the standard DiD analysis but is essential for our identification of employment effects, such as city-industry fixed effects, city-year fixed effects, and industry-year fixed effects, in which all omitted variables varying at the city or industry level, regardless of time-varying or time-invariant, have been properly dealt with. Our benchmark DDD specification is given by the equation:
where
indexes enterprises,
indexes two-digit industries,
indexes cities, and
indexes years.
is the log of labor demand, measured as the number of
’s employees of industry
in the city
at year
is a dummy variable indicating if the city
was assigned a TCZ status in 1998;
is a dummy variable equal to 1 if it is after 1998 and 0 otherwise; The official disclosed the
emission data of all 39 industries since 2003, while only 15 industries were disclosed before. Hence, it greatly reduced the cross-industry variations to exploit the
emission intensity of each industry before 1998. Furthermore, we find high correlations between the
emission intensity in 1995 and that after 2003 for 15 common industries, indicating that the
emission intensity has remained relatively stable and is less affected by the TCZ policy, at least in the short term. Finally, we use the
emission intensity for industry
averaged on the years 2003-2006 as a benchmark, unless otherwise stated. For the same reason, we exploit the ammonia nitrogen (
) emission intensity for industry
averaged on the years 2003-2006 to conduct the falsification test.
is a vector of time-varying enterprise characteristics used to isolate the effect of the TCZ policy on labor demand, such as the log of assets, log of per-capita wages, log of firm age, tax burden rate, export share, total debt ratio, total assets turnover as well as return on assets. In addition, our DDD specification controls for the full sets of industry-city fixed effects
city-year fixed effects
and industry-year fixed effects
To further tackle the potential heteroskedasticity and serial correlation issues, we cluster the standard error at the industry-city level in all DDD regressions.
5. Empirical results
5.1. Checks on the identification assumption
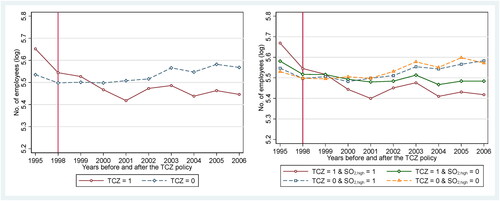
Whether the results of our benchmark DDD specification in this paper capture the causal effects of the TCZ policy on labor demand hinges on satisfying the strong identification assumption that our treatment group would have followed the same trends as the control group absent this regulation. Since the micro-data before the TCZ policy are only available in 1995, we reconsider the pre-treatment trends of labor demand by utilizing the aggregated employment sourced from the China City Statistical Yearbook 1994–2006. plots the year-to-year changes in the average levels of total and industrial employees for the TCZ and non-TCZ cities over the years 1994-2006. It’s worth noting that the statistical caliber of employees was greatly changed in 1998 from the employed persons in the whole society to the employed persons in units so that there is a precipitous drop in total and industrial employees in both TCZ and non-TCZ cities from 1997 to 1998. Given that the adjustment of statistical caliber in 1998 is an exogenous shock, the overall employment levels over time can still provide some suggestive evidence on the identifying assumption of common trends. In addition, shows the number of averaged employees in TCZ and non-TCZ cities and that across industries with high/low emission levels in these cities using the raw micro-data. The enterprises located in TCZ cities, particularly those from industries with higher
emission levels saw an abrupt break in employees from the pre-treatment trend. This pattern of relative changes in employees will be further confirmed in the formal regression analysis that follows.
Figure 3. Checks on the identification assumption with the city-level data.
Notes: This figure illustrates the time trend of the number of total and industrial employees in TCZ and non-TCZ cities during the period from 1994 to 2006.
Source: China City Statistical Yearbook, various years.
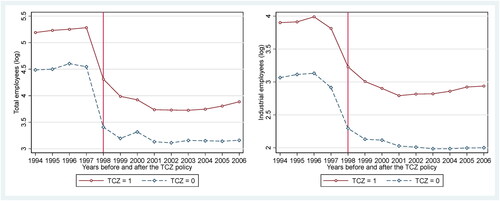
Figure 4. Checks on the identification assumption with the raw data.
Notes: This figure shows the number of averaged employees in TCZ and non-TCZ cities over time and that across industries with high/low emission levels in the two groups of cities.
Source: Sample data in this paper.
5.2. Main results
The results based on the DiD model are reported in . We first present the results of this specification in columns (1) and (4), breaking down the data by its means across groups to prima facie determine the employment effects without the controls. Columns (3) and (6) report the estimates from our preferred DiD specification with city fixed effects, year fixed effects, and all the controls. The estimates on are consistently negative and statistically significant regardless of the specific choices, suggesting that treated firms went through a decline in production and then reduced their labor demand.
Table 2. Main results: DiD specification.
Furthermore, concerning omitted time-varying variables in the DiD specification, we further report the results of our benchmark DDD specification in and focus on the estimates on in columns (3) and (6), which ideally tackles potential omitted variables varying at the city and industry level and captures differential responses of output and labor demand to the TCZ policy across industries with different
emission intensity. In particular, one standard deviation (SD) increase in the
emission intensity brings about the effects of this regulation on labor demand to be 15.6% lower (equivalent to 12.5% SD), suggesting that tougher environmental regulations are likely to be a potential source of unemployment in China. The DDD results suggest that the overall effects of this environmental regulation on labor demand of treated enterprises are consistently negative and more significant in more polluting industries, which indicates sectoral disparity in labor demand, and the workers and firms in polluting industries are more affected in the context of this environmental regulation.
Table 3. Main results: DDD specification.
There are three possible reasons why tough environmental regulations caused sectoral disparity in labor demand in China. First, the TCZ policy required that all outdated, dirty production technologies and equipment were phased out, and the collection of effluent fees was further enhanced, which increased production costs and thus reduced competitiveness particularly for polluting industries in TCZ cities. Second, the TCZ policy prohibited the establishment of new collieries and new coal-burning power plants that utilized low-quality coal and also required the installation of desulfurization equipment in the existing thermal power plants, which led to an increase in electricity costs faced by high energy-consuming industries in TCZ cities. Third, the TCZ policy incentivized local officials to strengthen environmental enforcement for compliance with emission reduction, and thus a series of supply-side reforms were implemented to seek short-term immediate results. Among them, a common practice was to shut down small and medium-sized polluting firms and resettle the laid-off workers to cleaning sectors, thereby accelerating the transfer of labor demand between polluting and cleaning industries.
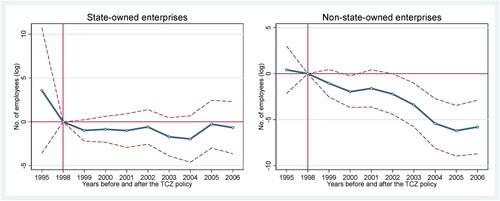
Nevertheless, plots a set of the event-time estimates on labor demand using the subsample of the state-owned and non-state-owned enterprises, respectively. The treatment and control groups were relatively balanced in labor demand before 1998, suggesting good comparability in statistics between the two groups with all controls in our benchmark DDD specification. Different from treated state-owned enterprises, their treated non-state-owned counterparts went through a gradual and persistent drop in labor demand in the post-policy periods, indicating that the non-state-owned enterprises were more regulated by this new regulation, which will be further confirmed in the heterogeneity analysis across ownerships that follows. In addition, there exists a statistically insignificant downward trend on the left hand before 1998, because state-owned enterprises faced a series of shocks after the reform and opening up and had to carry out reorganization and privatization in the middle and late 1990s that caused mass unemployment and thereby lowered the average labor demand of a representative state-owned enterprise.
Figure 5. Event-time estimates on labor demand before and after the TCZ policy.
Notes: Plotted are event-time estimates with our preferred setting for the state- and non-state-owned enterprises. The solid line captures the time course of the difference in firms’ labor demand between treatment and control groups. The dashed lines represent the 95% confidence intervals.
Source: Sample data in this paper.
5.3. Heterogeneity analyses
In this subsection, we conduct several heterogeneity analyses to further highlight whether the TCZ policy has heterogeneous effects on labor demand. Following the previous studies by Dean et al. (Citation2009), we expect that private enterprises are the most sensitive in response to environmental regulation and thus have more significant employment effects followed by state-owned enterprises (SOEs) and foreign-invested enterprises (FIEs). Using owner’s equity information, enterprises can be divided into three ownerships: (1) FIEs are the ones with foreign equity larger than the statutory 25%. (2) SOEs are recognized as the domestic ones that receive more than 50% paid-up capital from the Chinese governments at all levels and their departments. (3) Private enterprises consist of the others.
The empirical results in show that the TCZ policy has the expected significant negative effects on the labor demand of private enterprises, with the magnitude being rather larger (i.e., −3.588) and the significance being slightly down. Nevertheless, this regulation does not have any significant employment effects on SOEs or FIEs, indicating that private enterprises are more influenced and regulated by the TCZ policy than their state-owned or foreign-invested counterparts.
Table 4. Heterogeneity across firm ownership types.
In addition, TCZ consists of SPCZ that mainly covers the urban regions in Northern China to alleviate the ambient air pollution from coal-burning, and ARCZ that include the cities eroded by regional acid rain in Southern China, where the climate conditions are relatively more humid and rainy. In 1998, the number of
emission-intensive industrial firms (i.e.,
) located in SPCZ and ARCZ accounted for 18% and 51%, while their contributions to total
emissions are 25% and 56%, respectively. Hence, ARCZ might be more regulated by local environmental regulators because of its more substantial
production and discharge.
Certainly, treated enterprises located in the ARCZ need to undertake greater pollution abatement efforts to comply with this new environmental regulation than those located in the SPCZ, and thus we expect larger negative employment effects after excluding the SPCZ subsample. We further examine this possibility by dividing into two triple interaction terms
and
based on the name list of TCZ cities, and then respectively conduct the two regression analyses, ceteris paribus. The results in indicate that this regulation leads to significantly negative employment effects on treated firms located in ARCZ cities, but has little impact on similar firms located in SPCZ cities even in the pooled regression.
Table 5. Heterogeneity across control zone types.
6. Robustness checks
In this subsection, we conduct a series of further robustness checks to address the potential threats to our baseline findings. First, we verify that our baseline findings are not driven by the choices of the third dimension. Second, we use a contaminant (i.e., ) unregulated by the TCZ policy to conduct a falsification test. Third, we consider a placebo exercise by randomly assigning the TCZ status to cities and the treatment timing to check whether our DDD estimator
is severely biased due to any omitted variables at the industry-city-year level. Finally, we adopt an IV approach to instrument the TCZ status with each city’s FDI inflows averaged on several years before the TCZ policy and resolve the endogeneity issue arising from potential self-selection bias.
Alternative specifications. we conduct two robustness checks to test the sensitivity of our baseline findings to alternative specifications in the third dimension, including the emission intensity across industries in 1995 and a dummy variable indicating whether the
emissions of an industry accounted for more than 1% in 1998. We present the results in columns (1) and (2) of and continue to find negative and statistically significant coefficients. Hence, our findings remain robust to both alternative specifications, providing further evidence for our identification of employment effects across industries.
Table 6. Robustness checks.
Using unregulated contaminants as falsification tests. In this part, a feasible strategy is to examine whether or not the enterprises from much heavier wastewater polluting industries are systematically influenced by the TCZ policy. In other words, we expect that this regulation targeting
emission reduction would not affect the labor demand of
polluting enterprises. More specifically, we exploit the averaged wastewater
emission intensity over the years 2003-2006 across industries to conduct a falsification check. The corresponding estimated coefficient is presented in column (3) of , and we find no significant negative employment effects in these enterprises from much heavier wastewater
polluting industries, indicating that our benchmark DDD specification is identifying the true effects of the TCZ policy on labor demand in China and lending further support to our identification.
Placebo test. Denote and then rewrite the error term in our baseline model
such that
and
Given that all the potential identification problems mainly come from
our benchmark estimator
is derived by:
As a further check for whether our benchmark results are biased due to omitted variables at firm-industry-city-year we conduct a placebo test by randomly assigning the TCZ status to cities (Chetty et al., Citation2009, La Ferrara et al., Citation2012, Cai et al., Citation2016) and the policy timing (Lu et al., Citation2017). We randomly select 175 cities from the total 334 prefecture-level cities and designate them as TCZ cities, with the remaining being non-TCZ cities, and at the same time randomly assign the treatment year to all TCZ cities, which helps to produce a false triple interaction term (i.e.,
). Moreover, we use our DDD benchmark specification to capture the placebo estimate of this newly constructed regressor of our interest. Given the random data generation process, the false TCZ policy should have had no significant employment effects with a magnitude close to zero, or it would indicate the misspecification of our benchmark DDD model.
More specifically, if there exists no significant omitted variable (i.e., ), then we should observe the false estimate
In other words, the randomization test ensures that the false TCZ policy should have little or no impact on labor demand, and any significant coefficient would directly indicate the misspecification of our benchmark DDD model. Using the randomly constructed variable
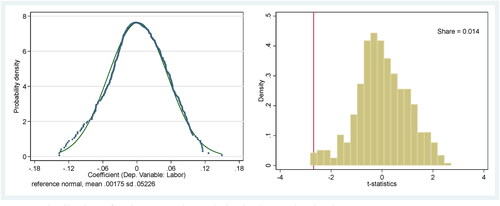
a placebo exercise is conducted following our benchmark DDD model in column (6) of . To further increase the identification power of this placebo test, it is repeated 500 times. We present the mean value and standard deviation of the 500 estimates from the randomized assignments in column (4) of , suggesting that there is almost no employment effect with the randomly constructed treatment variable. Furthermore, we conduct our statistical inferences in an alternative manner, by further visualizing the benchmark coefficient and the distribution of placebo treatment effects we estimated, to more intuitively interpret the randomization approach in this subsection.
shows the distribution of coefficients and t-statistics from the 500 runs and also marks the specific location of the t-statistic of the actual treatment effect within the placebo distribution. The distribution of estimates from the random assignments is almost centered around zero and our benchmark estimate (i.e., −1.433) lies far beyond the 95 percentiles in the entire distribution. Furthermore, we present the share of the placebo t-statistics that is larger than the actual statistic, in absolute value, which can be regarded as an analogous measure to the p-value in the placebo exercise (Cantoni et al., Citation2017). As per the requirement of this small enough share, we conclude that under the null of no effect of the false TCZ policy, random variations in TCZ status across cities and policy timing would quite rarely generate t-statistics as large as the ones we could obtain from environmental regulations in the reality. Consequently, these empirical findings strongly suggest that we are identifying the true employment effects, and the negative and significant effects of the TCZ policy on labor demand in our baseline findings are unlikely driven by omitted variables or any other unobserved confounding factors.
Figure 6. Distribution of estimates and t-statistics in the randomization test.
Notes: This randomization exercise is repeated 500 times and the resulting estimates and t-statistics are plotted. The red line marks the position of t-statistic for our benchmark estimate. Share is the percentage of t-statistics that is larger than the actual one.
Source: Sample data in this paper.
Instrumental variable (IV) approach. Since our benchmark DDD specification aims at identifying the heterogeneous employment effects of TCZ policy across industries with different emission intensity, it is vulnerable to encountering a potential endogeneity issue related to self-selection bias if the TCZ status was not randomly assigned. In the past three decades, China has vigorously attracted foreign capital for its economic development and has also increasingly received the transfer of polluting industries from other developed countries or regions for a long time, particularly in the early stage of China’s reform and opening up. At that time, a large number of foreign pollution enterprises, including the
polluting enterprises saw China as a ‘pollution paradise’ due to its looser environmental regulation and then entered the Chinese market with the qualification of FIEs.
The orthogonality or externality of the IV decides whether the IV approach could be successfully adopted in this subsection. Intuitively, the more FDI inflows a city introduced before the TCZ policy, the more likely that city would attract more emitting FIEs over this period, produce and discharge more
emissions, and then be assigned a TCZ status in 1998, which is consistent with the purpose of the TCZ policy to substantially reduce
emissions. Therefore, the FDI inflows at the city level before 1998 will be a feasible IV choice for each city’s TCZ status. In the practice, we use the log of FDI inflows averaged on the years 1990-1995 to instrument the TCZ status, and ensure that the IV has fairly weak correlations with the confounding factors (i.e.,
) as much as possible. The rationale for this IV choice lies in that a city’s FDI inflows before the TCZ policy can affect whether that city is assigned a TCZ status in 1998 but they were almost impossible to be influenced by this subsequent environmental regulation.
The first-stage and second-stage regression results of our IV approach are all reported in column (5) of . In the first-stage regression, we obtain a significantly positive estimate as per the requirement of our expectation. More importantly, we continue to find negative and statistically significant impacts of environmental regulation on labor demand in the second-stage regression, with the magnitude being even larger (i.e., −6.237) and the significance being almost unchanged. Furthermore, the reported Kleibergen-Paaprk LM statistic (i.e., 15.282) and Wald F statistic (i.e., 23.136) also suggest that the IV regression passes both the under-identification and weak identification tests. Therefore, these results further confirm that our baseline findings are reliable even when we carefully consider and resolve the endogeneity issue associated with self-selection bias.
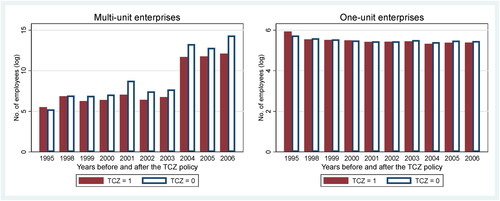
Location of the enterprise. Our last set of sensitivity analyses is to address the concern that the headquarter of an enterprise is not the same as the place where the majority of the employees work, which could be a potential measurement error under certain conditions if that were the case here since enterprises were headquartered in TCZ cities but also owned polluting factories in non-TCZ cities, or vice versa. As shown in , the average number of employees of multi-unit enterprises in non-TCZ cities began to constantly increase after 1998, indicating that this regulation may motivate treated firms in TCZ cities to reoptimize input factors and transfer emissions to elsewhere. Therefore, we only use the one-unit firms for regression and report the results in column (6) of . The results quantitively go through under this subsample, suggesting the robustness of our baseline findings.
Figure 7. Temporal and spatial distribution of employees in multi- and one-unit enterprises.
Notes: Plotted is the annual average number of employees (log) in TCZ and non-TCZ cities across multi- and one-unit enterprises, respectively.
Source: Sample data in this paper.
7. Conclusions
In this paper, we shed light on what impact stricter environmental regulation produces on labor demand at the firm level. To control for the potential endogeneity of environmental regulation, we adopt a well-known quasi-natural experiment, namely China’s TCZ policy in 1998. We find that one SD increase in emission intensity at the industry level leads to the impact of environmental regulation on labor demand to be 15.6% lower. Our findings are quite solid to a series of robustness checks on alternative specifications, identifying assumptions, and other econometric concerns.
China used to implement a series of supply-side reforms such as shutting down small and medium-sized polluting firms to solve its air pollution problems, which might lead to substantial structural unemployment. As China is increasingly enhancing its environmental regulation, the heterogeneous employment effects across industries and regulation-induced unemployment should also be carefully considered to make a conscious trade-off between economic growth and environmental protection when conducting the benefit-cost analyses of environmental regulations. Hence, we suggest that policymakers should consider setting different environmental objectives for different pollution-intensive industries when issuing nationwide pollution control policies. Furthermore, they should also develop some training and financial supporting measures to help the laid-off workers solve the resulting economic and transfer costs, especially in cases where unskilled workers are more affected.
In recent years, some developing countries in Asia have faced similar situations in decentralized pollution controls as those faced by China. Thus, understanding the disparity across industries that bear more burden in terms of unemployment and how to help these workers and firms survive in the tide of environmental regulation is very important to the sustainable development of these low-income countries. Finally, we also suggest that more heterogeneous employment effects across different types of workers should be further highlighted in future research, which can help the government to identify these workers who are more sensitive and vulnerable to environmental regulation, and then provide them with accurate assistance on time.
Disclosure statement
No potential conflict of interest was reported by the authors.
Additional information
Funding
References
- Ambec, S., Cohen, M. A., Elgie, S., & Lanoie, P. (2013). The porter hypothesis at 20: Can environmental regulation enhance innovation and competitiveness? Review of Environmental Economics and Policy, 7(1), 2–22. https://doi.org/10.1093/reep/res016
- Angrist, J. D., & Pischke, J.-S. (2009). Mostly harmless econometrics: An empiricist’s companion. Princeton University Press.
- Arauzo-Carod, J.-M., Liviano-Solis, D., & Manjón-Antolín, M. (2009). Empirical studies in industrial location: An assessment of their methods and results. Journal of Regional Science, 50(3), 685–711. https://doi.org/10.1111/j.1467-9787.2009.00625.x
- Becker, R., & Henderson, V. (2000). Effects of air quality regulations on polluting industries. Journal of Political Economy, 108(2), 379–421. https://doi.org/10.1086/262123
- Berman, E., & Bui, L. T. (2001). Environmental regulation and labor demand: Evidence from the south coast air basin. Journal of Public Economics, 79(2), 265–295. https://doi.org/10.1016/S0047-2727(99)00101-2
- Brandt, L., Van Biesebroeck, J., & Zhang, Y. (2014). Challenges of working with the Chinese NBS firm-level data. China Economic Review, 30, 339–352. https://doi.org/10.1016/j.chieco.2014.04.008
- Brandt, L., Van Biesebroeck, J., & Zhang, Y. (2012). Creative accounting or creative destruction? Firm-level productivity growth in Chinese manufacturing. Journal of Development Economics, 97(2), 339–351. https://doi.org/10.1016/j.jdeveco.2011.02.002
- Cai, X., Lu, Y., Wu, M., & Yu, L. (2016). Does environmental regulation drive away inbound foreign direct investment? Evidence from a quasi-natural experiment in China. Journal of Development Economics, 123, 73–85. https://doi.org/10.1016/j.jdeveco.2016.08.003
- Cantoni, D., Chen, Y., Yang, D. Y., Yuchtman, N., & Zhang, Y. J. (2017). Curriculum and ideology. Journal of Political Economy, 125(2), 338–392. https://doi.org/10.1086/690951
- Chetty, R., Looney, A., & Kroft, K. (2009). Salience and taxation: Theory and evidence. American Economic Review, 99(4), 1145–1177. https://doi.org/10.1257/aer.99.4.1145
- Coglianese, C., Carrigan, C., Coglianese, C., & Finkel, A. M. (2014). The jobs and regulation debate. In C. Carrigan (Ed.), Does regulation kill jobs? (pp. 1–30). University of Pennsylvania Press.
- Dean, J. M., Lovely, M. E., & Wang, H. (2009). Are foreign investors attracted to weak environmental regulations? Evaluating the evidence from China. Journal of Development Economics, 90(1), 1–13. https://doi.org/10.1016/j.jdeveco.2008.11.007
- Ferris, A. E., Shadbegian, R. J., & Wolverton, A. (2014). The effect of environmental regulation on power sector employment: Phase I of the title IV SO2 trading program. Journal of the Association of Environmental and Resource Economists, 1(4), 521–553. https://doi.org/10.1086/679301
- Gibbons, S., & Overman, H. G. (2012). Mostly pointless spatial econometrics? Journal of Regional Science, 52(2), 172–191. https://doi.org/10.1111/j.1467-9787.2012.00760.x
- Gray, W. B., Shadbegian, R. J., Coglianese, C., Finkel, A. M., & Carrigan, C. (2014). Do the job effects of regulation differ with the competitive environment?. In Does regulation kill jobs? (pp. 51–69). University of Pennsylvania Press.
- Gray, W. B., Shadbegian, R. J., Wang, C., & Meral, M. (2014). Do EPA regulations affect labor demand? Evidence from the pulp and paper industry. Journal of Environmental Economics and Management, 68(1), 188–202. https://doi.org/10.1016/j.jeem.2014.06.002
- Greaker, M. (2006). Spillovers in the development of new pollution abatement technology: A new look at the Porter-hypothesis. Journal of Environmental Economics and Management, 52(1), 411–420. https://doi.org/10.1016/j.jeem.2006.01.001
- Greenstone, M. (2002). The impacts of environmental regulations on industrial activity: Evidence from the 1970 and 1977 clean air act amendments and the census of manufactures. Journal of Political Economy, 110(6), 1175–1219. https://doi.org/10.1086/342808
- Greenstone, M., List, J. A., & Syverson, C. (2012). The effects of environmental regulation on the competitiveness of U.S. manufacturing. National Bureau of Economic Research Working Paper Series No. 18392.
- Kahn, M. E., & Mansur, E. T. (2013). Do local energy prices and regulation affect the geographic concentration of employment? Journal of Public Economics, 101, 105–114. https://doi.org/10.1016/j.jpubeco.2013.03.002
- La Ferrara, E., Chong, A., & Duryea, S. (2012). Soap operas and fertility: Evidence from Brazil. American Economic Journal: Applied Economics, 4(4), 1–31.
- Lanoie, P., Laurent-Lucchetti, J., Johnstone, N., & Ambec, S. (2011). Environmental policy, innovation and performance: New insights on the porter hypothesis. Journal of Economics & Management Strategy, 20(3), 803–842. https://doi.org/10.1111/j.1530-9134.2011.00301.x
- Liu, M., Shadbegian, R., & Zhang, B. (2017). Does environmental regulation affect labor demand in China? Evidence from the textile printing and dyeing industry. Journal of Environmental Economics and Management, 86, 277–294. https://doi.org/10.1016/j.jeem.2017.05.008
- Liu, M., Tan, R., & Zhang, B. (2021). The costs of “blue sky”: Environmental regulation, technology upgrading, and labor demand in China. Journal of Development Economics, 150, 102610. https://doi.org/10.1016/j.jdeveco.2020.102610
- Lu, Y., Tao, Z., & Zhu, L. (2017). Identifying FDI spillovers. Journal of International Economics, 107, 75–90. https://doi.org/10.1016/j.jinteco.2017.01.006
- Millimet, D. L., & Roy, J. (2016). Empirical tests of the pollution haven hypothesis when environmental regulation is endogenous. Journal of Applied Econometrics, 31(4), 652–677. https://doi.org/10.1002/jae.2451
- Mohr, R. D. (2002). Technical change, external economies, and the porter hypothesis. Journal of Environmental Economics and Management, 43(1), 158–168. https://doi.org/10.1006/jeem.2000.1166
- Mohr, R. D., & Saha, S. (2008). Distribution of environmental costs and benefits, additional distortions, and the porter hypothesis. Land Economics, 84(4), 689–700. https://doi.org/10.3368/le.84.4.689
- Morgenstern, R. D., Pizer, W. A., & Shih, J. S. (2002). Jobs versus the environment: An industry-level perspective. Journal of Environmental Economics and Management, 43(3), 412–436. https://doi.org/10.1006/jeem.2001.1191
- Nie, H., Jiang, T., & Yang, R. (2012). Current status and potential problems of the database of China’s industrial enterprises. Journal of World Economy, 5, 142–158.
- Palmer, K., Oates, W. E., & Portney, P. R. (1995). Tightening environmental standards: The benefit-cost or the no-cost paradigm? Journal of Economic Perspectives, 9(4), 119–132. https://doi.org/10.1257/jep.9.4.119
- Porter, M. E., & Van der Linde, C. (1995). Toward a new conception of the environment-competitiveness relationship. Journal of Economic Perspectives, 9(4), 97–118. https://doi.org/10.1257/jep.9.4.97
- Wagner, U. J., & Timmins, C. D. (2009). Agglomeration effects in foreign direct investment and the pollution haven hypothesis. Environmental and Resource Economics, 43(2), 231–256. https://doi.org/10.1007/s10640-008-9236-6
- Walker, W. R. (2011). Environmental regulation and labor reallocation: Evidence from the clean air act. American Economic Review, 101(3), 442–447. https://doi.org/10.1257/aer.101.3.442
- Walker, W. R. (2013). The transitional costs of sectoral reallocation: Evidence from the clean air act and the workforce. The Quarterly Journal of Economics, 128(4), 1787–1835. https://doi.org/10.1093/qje/qjt022
- Yelowitz, A. S. (1995). The medicaid notch, labor supply, and welfare participation: Evidence from eligibility expansions. The Quarterly Journal of Economics, 110(4), 909–939. https://doi.org/10.2307/2946644
Appendix
Table A1. A glossary of technical terms and abbreviations.