
 ?Mathematical formulae have been encoded as MathML and are displayed in this HTML version using MathJax in order to improve their display. Uncheck the box to turn MathJax off. This feature requires Javascript. Click on a formula to zoom.
Abstract
For small open economies such as Slovakia, foreign demand is a significant factor in economic growth. Since Slovakia acceded to the European Union, its exports have focused primarily on the EU internal market. Therefore, one of its goals is to diversify the territorial structure of foreign trade. Kazakhstan is the economic engine of Central Asia, which has made significant efforts in recent years to transform its economy. The aim of the case study of the Slovak Republic is to examine its export opportunities to Kazakhstan using selected one-factor indicators of competitiveness based on their mutual foreign trade. The imbalance in Slovakia-Kazakhstan’s foreign trade suggests sizable reserves. The work evaluates their foreign trade relations through indices of trade intensity, complementarity, and intra-industry trade. It identifies the export potential of Slovakia based on the concept of revealed comparative advantages and import significance of Kazakhstan in the examined period. In 2020, The export potential was used only at 2%, the export gap was 95,928 mil. EUR and concerned 56 commodities at the level of HS 4 aggregation. Considering the geographical distance and costs, Slovakia should focus on the export of goods with higher added value.
1. Introduction
Kazakhstan is part of the Central Asia region and since ancient times the region has been of great importance in transit from China to the Middle East and Europe, known as the Silk Road (Byrd, Citation2006). In addition to their strategic location, Kazakhstan and other Central Asian countries are rich in mineral resources such as oil, natural gas, gold, and uranium, which makes them attractive not only to current powers such as Russia, the United States, and China but also to the European Union as relevant import partners (and thus also for Slovakia). (Konopelko, Citation2018). Although energy was in the past the main area of cooperation between the EU and the Central Asian region, currently other areas focused on the implementation of democratic principles, the protection of human rights, and the fight against poverty are coming to the fore (Cornell & Engvall, Citation2017). At the same time, mineral raw materials have become a significant factor of economic development and a tool of their foreign trade policy, as evidenced by the given case study focused on the export potential of Slovakia with Kazakhstan.
The Slovak Republic is a country with a small economy and a relatively limited size of the internal market but with a high trade openness. The indicated predisposes it to the necessary internationalization. According to the World Bank, in 2020 the openness of the Slovak economy reached 170%. Over the last decade, exports have been the driving force behind the economic growth of the Slovak Republic, as evidenced by its high share in GDP (in 2020 it reached 85.4%).
Since Slovak Republic acceded to the EU, Slovak exports have been primarily oriented to the markets of the European Union. Diversification of the territorial and commodity structure of foreign trade is necessary for the advancement of the export performance of the Slovak Republic, as pointed out by the newly adopted Concept of External Economic Relations and Economic Diplomacy of the Slovak Republic for 2022 - 2030. Based on the given concept, it is necessary to focus not solely on the diversification of foreign trade but also the inflow of FDI with higher added value and the establishment of a favourable international environment in favour of the promotion of trade and economic interests and increase the efficiency of economic diplomacy.
The Republic of Kazakhstan is the economic engine of Central Asia and accounts for 60% of the region’s GDP (World Bank, 2020). In recent years, we can see considerable efforts in the Republic of Kazakhstan to transform the economy. The main goal of the Kazakhstan Development Strategy until 2050 is to make the country one of the top 30 most advanced economies in the world. The government’s infrastructure development program ‘Nurly Zhol 2020-2025’ defines the strategic tasks and direction of the country until 2025.
The transformation of the Kazakh economy creates opportunities for Slovak companies to gain a foothold in their market. It is possible to expect that with a rising standard of living, a new demand for products will arise. Slovak companies are looking for new sales opportunities in response to the military operations of the Russian Federation in Ukraine.
In response to these objective facts, there is room to review the development of foreign trade between the Slovak Republic and the Republic of Kazakhstan through several one-factor indicators of competitiveness and to determine the assessment of Slovakia’s export potential to the territory. The motivation of the presented contribution is to identify one of the possibilities for diversification of the territorial structure of Slovak exports on the example of the Republic of Kazakhstan, which will also have an impact on increasing the efficiency of economic diplomacy.
This contribution establishes the theoretical foundation for comparative advantages, competitiveness, complementarity, and intra-industry trade based on a case study of Slovakia in Kazakhstan. The following chapter is the methodology, which describes the contribution’s aim, hypotheses for reaching the objective, and specific methodological research processes. Focusing on the development of mutually inclusive trade based on selected single-factor trade indicators and the export potential of Slovakia to Kazakhstan, we find additional opportunities for the growth of Slovak exports to the researched territory in the work’s results. The authors present conclusions and recommendations regarding the subject under research in the final chapter.
2. Theoretical background
The concept of comparative advantage points to a country’s ability to produce specific products or services not only with higher productivity as originally proposed by Ricardo but also with higher product differentiation than other countries (Lafay, Citation1987). Assessing countries’ comparative advantages is a dynamic concept, as a country’s ability to produce goods changes over time in response to various endogenous and exogenous factors, such as changes in property factors, including technology and human capital.
There are several ways to express whether a country has a comparative advantage. One of the initial approaches is to determine a country’s specialization in the production of goods by calculating the Balassa index, defined as the share of a selected country’s exports in a commodity group’s total exports to that country’s share of the world exports in that commodity group.
Other authors have tried to add their contribution to the improvement and calculation of the RCA index, namely Hinloopen and Marrewijk, (Citation2001), Vollrath (Citation1991), Yeats (Citation1985), and others. In the literature, we can find many pieces of research that assess the effects of trade barriers through RCA, which was also the original Balassa ‘s impulse in its construction.
Greenway et al. (2008), Goldberg, (Citation2010), Menezes-Filho and Muendler (Citation2011), and McCaig and Pavcnik, (Citation2018) show different examples of the effects of changes in trade barriers between products. Descriptive analyzes such as Fertö and Hubbard (Citation2003) and Tongzon (Citation2005) are used to clarify the effects of past or future trade policies, such as tariffs and export subsidies.
In the context of the perception of competitiveness at the level of countries and companies, Krugman (Citation1994, Citation1996) made a major contribution, pointing out the fact that companies that mainly produce public goods do not compete in the markets, companies did. Relevant works addressing the competitiveness of countries and companies include, for example, Prahalad and Hamel (Citation2009), Melitz and Ottaviano (Citation2008), Falciola et al. (Citation2020), etc. The company’s ability to compete at a given moment is the result of meeting the qualitative, quantitative, and time market requirements at a competitive price (Bas & Strauss-Kahn, Citation2014).
Access to information on untapped export opportunities at the sectoral and product levels can help governments design policies and strategies that stimulate export promotion as a factor of inclusive and sustainable economic growth. Identifying products and markets for which the country does not make sufficient use of its export potential creates possibility of advantage new market opportunities. In some cases, remove obstacles that prevent the country’s companies from realizing their export potential (Cheong et al., Citation2018).
Archiereev (Citation2018) expressed the export potential of Ukraine with Germany, based on the principle of revealed comparative advantages at the HS2 level in 2013-2014. Bronček (Citation2019) identified the export potential of the Slovak Republic with China at the HS6 level for the period 2013 - 2014, mainly in the field of engineering, chemistry, and agriculture. Ochieng et al. (Citation2020) proceeded analogously in assessing COMESA's export potential concerning the world for the period 2011–2015. Niazi and Nizami (Citation2015) examined the export potential of Indian cotton to 37 countries from 2002 to 2012.
Foreign trade interaction between countries is divided into inter-industry and intra-industry. While in inter-industry trade there is an exchange of goods between different sectors, intra-industry trade refers to an exchange of goods within the same industry. Historically, trade between nations has largely consisted of exchanges of products that varied widely and were not closely substitutable in consumption or production processes. Intra-industry trade lowers domestic prices and pushes less competitive domestic producers out of business. As a result, domestic producers are opposed to trade liberalization (Destler & Odell, Citation1987).
This effect is not conceived by a standard theory of comparative advantage and requires an explanation based on factors such as economies of scale, product differentiation, imperfect markets, and growing consumer demands (Vona, Citation1991). The beginnings of the study of intra-industry trade point to the authors Grubel and Lloyd, who in 1971 brought a new perspective on the quantitative assessment of foreign trade flows within individual product groups between countries. Hamilton and Kniest (Citation1991), Brülhart (Citation1994) Thom and McDowell (Citation1999), Crespo and Fontoura (Citation2004), and others later devoted themselves to the development of the idea of intra-industry trade. The volume of this trade varies inversely with the level of trade restrictions and creates other trade policy objectives, namely, to affect the range of commodities exported and imported (Falvey, Citation1981).
Baccini et al., (Citation2018) examined the impact of intra-industry trade and global value chains on the political economy of trade. According to them, the impact of intra-industry trade on tariff reduction is very diverse between countries. Some of their results suggest that the presence of intra-industry trade is accompanied by a rapid and significant reduction in tariffs, while others point to a slow and insignificant reduction. The findings of Milner (Citation1997) and Manger (Citation2015) reflect that intra-industry trade can directly reduce competition between products and thus reduce the number of domestic companies that perceive imports as a threat. Another group of authors suggests that the presence of intra-industry trade may strengthen close protectionist groups, which may result in lobbying for the protection of private goods (Kono, Citation2009).
As defined by Krugman (Citation1981), intra-industry trade consists of two-way trade within an industry, as companies in different countries will produce differentiated products. Intra-industry trade increases prosperity by increasing the size of the market, redistributing factors of production towards the most productive firms, raising wages in the most productive firms, and providing a greater variety of products to consumers. However, it increases competition between manufacturers and may therefore force less competitive companies to leave the market. Smaller companies that do not export are likely to be the main losers when trade agreements lead to increased intra-industry trade (Madeira, Citation2016).
3. Methodology
The aim of the case study of the Slovak Republic is to examine its export opportunities to Kazakhstan using selected one-factor indicators of competitiveness based on their mutual foreign trade. To achieve this, we have formulated the following hypotheses (H):
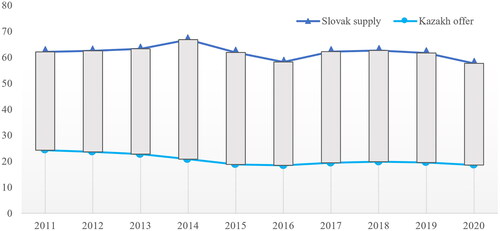
H1: In the period under review, due to the structure and diversification of Slovak exports, the Slovak Republic’s foreign trade with Kazakhstan is more intensive and Slovakia’s supply is greater than Kazakhstan’s demand and vice versa.
H2: The Slovak Republic has untapped export potential to Kazakhstan in the field of automotive commodities in the period under review.
xij – value of exports from country i to country j;
Xit – the value of the country’s i total exports to the world;
xwj – the value of total world exports to country j;
Xwt – value of total world exports.
The index ranges from zero to infinity. If the value of the index is 1, it means that the country i exports to country j the exact ratio of exports that country j belongs to, in terms of its share of world imports. If the value of the index is higher than 1, trade flows between the studied countries are at a higher level than would be expected given the importance of the economy in the world economy. It means that country i exports more to country j than the rest of the world, which indicates an intensive business relationship. If the value is less than 1, the trading intensity is at a lower level than would be expected (World Bank, 2013).
For the calculation of intra-industry trade, we use the original Grubel-Lloyd specification, which can be expressed as:
(2)
(2)
where Xi denotes the export and Mi the import of good I. The index’s range is from 0 to 1. If GLIi=1, it indicates that there exists intra-industry trade between considered countries. Conversely, if GLIi = 0, there is no intra-industry trade at all. A higher index value classifies a higher level of specialization in intra-industry exchange, considering that, a lower value of GLI indicates that the foreign trade is closer to the inter-industry trade (Egger et al., Citation2005). The table illustrates the basic scenarios of the development of the intra-industry trade index)
Table 1. Intra-industry index development scenarios.
To evaluate the foreign trade relations between countries in terms of the complementarity of their trade flows, we use the method of calculating the trade complementarity index (TCI). This index explains us to what extent the surveyed countries can be considered natural partners. The initial author of the Trade Complementarity Index is Drysdale, which sought to assess the extent to which the total exports of one entity overlap with the imports of the other (Drysdale and Garnaut, Citation1982). The development of TCI was also dealt with by other authors, in our case, we are calculating the most current specification of Michaely and Wajnryt (Citation2017), who defines TCI as:
(3)
(3)
where χjk is the share of product k in the total exports of country j and mik is the share of product k in the total imports of country i. With a perfect correlation of export and import shares, the index reaches the value of 100 and at none, it is equal to 0. If the value is equal to 100, the surveyed subjects are ideal trading partners. Subjects are perfect competitors, ie their composition of exports and imports coincides when the value equal to zero. Development of the index over time indicates whether the business profiles of the monitored entities are compatible.
In assessing and setting prospects for cooperation, it should be borne in mind that, despite high CTIs, geographically distant countries may not be ideal partners due to high transaction costs (World Bank, 2019).
Balassa’s index of Revealed Comparative Advantages (RCA) was used to determine the country’s specialization, which is defined as follows:
(4)
(4)
where Xnjk stands for the exports of country j in commodity group k in year n, Xjn stands for the value of total exports of country j in year n, Xnwk is world export of commodity k in period n a Xnk total world export in period n (Balassa, Citation1965).
If RCA is more than 0, it suggests that there exists revealed comparative advantage for exports of the commodity group; and if it is less than 0, it induces revealed comparative disadvantage in the commodity group. For more detailed identification of the revealed comparative advantage (Hinloopen & Marrewijk, Citation2001), possible values of the index can be classified into four categories determining its size, respectively intensity:
0 < RCA ≤ 1 no comparative advantage,
1 < RCA ≤ 2 weak comparative advantage,
2 < RCA ≤ 4 moderate comparative advantage,
4 < RCA strong comparative advantage.
We calculated RCAs for 1242 products and 6210 observations were made. After expressing annual indices, the average RCA for the observed period was calculated for eliminating deviating values in individual years (Bronček, Citation2019). The transformed Ballasa’s index (M replaces X) was used to identify goods that the country imports to a greater extent than the rest of the world.
(5)
(5)
where ISnjk represents the Ballasa’s index for product imports to countries j in period n (import significance index). Mnjk is the import of product to country j in period n, Mnj is the total import of country j in period n, Mnwk is the world import of product k in period n and Mnw is the world import in period n. The number of analyzed commodity groups was 1259 and we made 6295 observations, based on which the average value of the import significance index was expressed.
After expressing the RCA and IS indices, it is possible to examine their penetration, which is the basis for calculating the export gap. Mathematically, EGnjik—the country’s export gap to the country and for the product can be expressed as follows (Bronček, Citation2019):
(6)
(6)
where the individual shares represent:
The average share of country j‘s exports in world imports over time t;
(7)
Share of product k exports to country j in country imports in period n.
Xjk is the export of the product k to country j,
Mwk is a world import of the product k,
Xnjik is the export of the product k from country j to country i in year n,
Mnik is the import of product k of the country i in year n,
n year of export gap calculation,
n0 is the first year in the range of the average RCA index.
The following conditions apply when calculating the export gap:
(9)
(9)
(10)
(10)
when assessing export potential we considered the tariff advantage, the distance factor, and the market concentration based on the Herfindahl-Hirschman Index (HHI).
If the tariffs applied to the exporting country are lower than those applied to other suppliers, the exporter benefits from a tariff advantage in the market. Conversely, if the applied tariffs to an exporting country are higher than those applied to other suppliers, the exporter experiences a customs disadvantage which reduces his capacity to export the product to a particular market.In the case of the distance factor, the lower the absolute difference between the exporter’s distance from the target market and the average distance of the product imported by the target market, the higher the export potential (Cheong et al., Citation2018).
We evaluate the above facts concerning the three most important trading partners in the commodity group in question in 2020. Market concentration is based on the Herfindahl index. It is calculated as the square of each country’s share of the selected market and by adding the resulting numbers:
(11)
(11)
where si is the i country’s share of the market and N is the number of countries. The Herfindahl index (H) is moving from 1/N to 1.
The Herfindahl index values are interpreted as follows:
H below 0.01 indicates a highly competitive industry without dominant players,
H below 0.15 indicates non-concentrated industry,
H between 0.15 and 0.25 indicates a slightly concentrated industry,
H above 0.25 indicates high market concentration.
The limitation of the research in examining the development of mutual foreign trade and analysis through selected one-factor indicators was set for the period 2011 - 2020. The calculation of the Slovak export potential was based on the assessment in 2016 - 2020 at the HS4 level. The primary sources of information were the databases of Eurostat, International Trade Center, World Bank, World Economic Forum, and UN Comtrade.
4. Results
Slovakia’s foreign trade turnover with Kazakhstan is unbalanced and indicates significant reserves. Their mutual trade cooperation is marked by considerable geographical distance and different integration priorities but also with Kazakhstan’s efforts to replace imports with domestic production. China’s proximity, which is being pursued in the market by an aggressive trade and price policy, exacerbated by the well-known phenomenon of illegal transit of Chinese goods to Kazakhstan, makes production even cheaper. This suggests that Slovak production, no matter how high quality, is and will be relatively difficult to promote on the Kazakh market. A detailed overview of the mutual development of trade is shown in .
Figure 1. Development of foreign trade between Slovakia and Kazakhstan in the years 2011–2020 (in millions of euros).
Source: author’s own processing based on ITC data (2022)
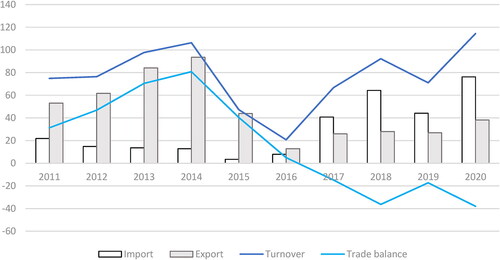
In the course of 2016 - 2017, we observe a suspension of trade growth, mainly due to a decline in Slovak exports. This development suggests that the Kazakh market is either not interested in Slovak production for a long time and Slovakia does not offer goods that are marketable on this market or are not sufficiently emphatic during expansion. Exports in 2020 had a value of 38.208 mil. EUR and imports 76.210 mil. EUR. Business turnover over 100 mil. EUR caused by the growth of Slovak imports was recorded only in 2020.
4.1. Evaluation of foreign trade based on selected one-factor indices: intensity, complementarity, and intra-industry trade
To achieve the evaluation of mutual trade, we used several one-factor indicators of competitiveness assessment, which were expressed using the following indices in each part of the research. In , we can observe how the trade intensity between Slovakia and Kazakhstan developed over the same period.
Figure 2. Development of the trade intensity index between Slovakia and Kazakhstan 2011–2020.
Source: author’s own processing based on ITC data (2022)
From Kazakhstan’s point of view as an exporter, their bilateral trade relations cannot be perceived as intense, as the index has not exceeded 1 in the last 20 years. Over the last nine years, Kazakhstan has more than doubled its total exports compared to previous periods. Since 2015, we can see slight signs of growth.
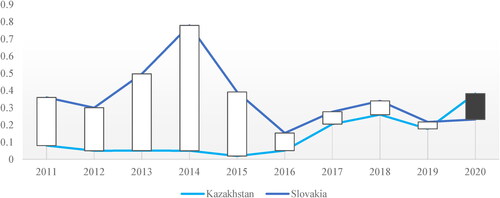
Trade complementarity plays a remarkable role in the evaluation of bilateral trade cooperation, which points out how complementary Slovak supply is to Kazakh demand and vice versa. A detailed overview of the development is shown in the . The highest value of TCI by Slovakia was reached in 2014 and was equal to 66.78 points. After three years of stagnation, there has been a recovery since 2017. A declining trend is detected on the Kazakh supply side, with TCI values ranging from 18.40 to 24.26. As suggests, Slovak supply is more complementary to Kazakh demand than vice versa.
Figure 3. Development of trade complementarity between Slovakia and Kazakhstan in the years 2009–2020.
Source: author’s own processing based on ITC data (2022)
We also follow how the index of intra-industry trade between the Slovak Republic and Kazakhstan has developed. The index values are low throughout the period under review. A detailed overview of intra-industry trade is in .
Table 2. GLI of the Slovak Republic with Kazakhstan in the years 2011 - 2020.
Until 2017, intra-industry trade was recorded in the group of processed goods Equation(6)(6)
(6) , but in recent years trade between the Slovak Republic and Kazakhstan was limited to inter-industry trade. On the contrary, in recent years we can observe a growing presence of intra-industry trade in the chemical group (5). Within the other groups, the inter-industry exchange is observed. For the group of animal and vegetable oils Equation(4)
(4)
(4) , it was not possible to calculate the GLI due to the absence of trade flows.
Based on the research, we can state that we accept hypothesis 1: In the period under review, due to the structure and diversification of Slovak exports, the Slovak Republic’s foreign trade with Kazakhstan is more intensive and Slovakia’s supply is greater than Kazakhstan’s demand and vice versa.
4.2. Slovak export potential to Kazakhstan
In the period under review, the Slovak Republic had the revealed comparative advantages in a total of 240 commodity groups at the HS4 level, if we adhere to the traditional Ballasa’s classification with the condition RCA> 1.
presents the 10 most exported commodities of Slovakia to Kazakhstan. As we can see, the ten most exported items are characterized by the presence of comparative advantages, up to 5 of which can be classified as strong (namely HS 8703, HS 4011, HS 8403, HS 8528, and HS 3306).
Table 3. Top 10 products of Slovak exports to Kazakhstan in 2020.
Cars occupy a significant position in the Slovak export basket to Kazakhstan, accounting for more than 38% of total exports. In Slovak exports, we can observe the representation of machines, devices, and accessories (HS 8407, HS 8504, HS 8708, and HS 8407).
A special feature is the presence of articles on the class of live animals and products (HS 0102 and HS 0407). As far as trade in live livestock is concerned, according to the Central Livestock Register, only cattle have been exported from Slovakia to Kazakhstan since 2019. These were exclusively females (calves, heifers, and cows), mainly Slovak spotted and Holstein breeds. Hereford females originating in Ireland were also exported last year. Thus, in addition to the export of animals born and raised in Slovakia, Slovakia also served to quarantine animals before their export to Kazakhstan and to livestock from the other Member States.
For last five years 326 import-significant commodities were identified for Kazakhstan in the condition> 1.5. The table shows the first 10 commodities. The most important commodities in import were ores and concentrate… (HS 2617), which are used to produce useful metals. Kazakh demand for this is up to 89 times higher than the rest of the world. It imports this commodity mainly from the Russian Federation (48.3%), Zimbabwe (32.7%), and Mozambique (19.7%). The second most important commodity on import was unroasted iron pyrites (HS 2502), which Kazakhstan imported from the Russian Federation (83.3%) and China (16.7%). Their modern use is in the cathode material of lithium batteries, mineral detectors for radio receivers, and semiconductor material)
Table 4. Import-significant commodities for Kazakhstan at the level of HS4, for the period 2016-2020.
Kazakhstan’s demand for rail or freight wagons … (HS 8606) is 27 times higher than average world demand. This is mainly initiated by the fact that almost 50% of the loads in Kazakhstan are transported by rail. Thus, as part of the government’s ‘Nurly Zhol’ initiative, Kazakhstan is objectively trying to create conditions to facilitate the growth of flows and shorten delivery times. The ‘Belt and Road Initiative’, which supports the country’s attractiveness as a logistics hub between Europe and China (International Trade Administration, 2022), was also a considerable impetus for building infrastructure. The suppliers (HS 8606) are the Russian Federation (92.8%), Belarus (2.7%) and Georgia (2.6%).
Based on examining the export potential, we can accept hypothesis 2: The Slovak Republic has untapped export potential to Kazakhstan in the field of automotive commodities in the period under review.
Kazakhstan is trying to restructure its economy and infrastructure and should re-enter the growth trajectory after a crisis in 2020 affected by the pandemic. In such a case, EU production and technology should find their place in its market to a greater extent.
We identified 56 commodities with export potential based on the analysis of the penetration of the revealed comparative advantages of the Slovak Republic and import-significant commodities for Kazakhstan. Slovakia’s export potential to Kazakhstan in 2020 was 95.928 mil. EUR. The export gap was EUR 94.222 million, indicating that export potential was only used to 2% in 2020.
The highest untapped export potential is in the amount of 19.339 mil. EUR is recorded in the group of constructions, including cabs for tractors, and motors for transport of more than 10 persons (HS 8707). The Herfindahl index at 0.25 indicates a moderate market concentration. The main suppliers were the Russian Federation (35.9%), China (24.6%), and the Czech Republic (19.1%). As the Russian Federation and Kazakhstan are members of the customs union, they apply a zero-tariff rate. The tariff in relation to China and the Czech Republic is at the same level, namely 13.8%. The average geographical distance from the supplier was 3167 km.
Another item is air or vacuum pumps (HS 8414), additional exports could amount to 16.849 mil. EUR (actual exports amounted to EUR 257 thousand). The market concentration is 0.62 high. The main suppliers are Korea (78.6%), Japan (5.1%), and Germany (4.2%). The applied tariff is at the level of 0.5%. The distance from the supplier is on average 4545 km.
In 2020, the export gap of railway or tram cars and wagons (HS 8606) in the amount of 12,203 mil. EUR A very intense market concentration of 0.86 and the dominance of the Russian Federation on the market (92.8%), Belarus (2.7%), and Georgia (2.6%) prevailed. Kazakhstan applies a zero-tariff rate to these countries and the average distance of the supplier is 1728 km, which does not create positive conditions for additional exports.
The value of untapped exports of new rubber tires (HS 4011) was 6.924 mil. EUR. The market concentration was 0.36, with the Russian Federation (54.4%), China (24.8%), and Japan (4.4%). The applied customs tariff of Slovakia is at the level of China and Japan, ie 9.1%. The average geographical distance of the supplier is 3002 km. Continental Matador Truck Tires s.r.o. is one of the largest Slovak exporters.
Central heating boilers, except for electric ones, their parts, and components (HS 8403) are goods with the highest revealed comparative advantage of the Slovak Republic, whose value of untapped exports was 3.756 mil. EUR (actual exports amounted to EUR 25 thousand). With a significant market concentration of 0.31, the main suppliers were China, the Russian Federation, and Italy. The average distance of the supplier is 3010 km, which points to the geographical advantage of Slovakia, while the average applied tariff is at the level of 10%. The Herfindahl index indicates an unconcentrated industry in the group of boards, panels, and consoles … (HS 8537), which was at the level of 0.11. The geographical distance between the supplier and the customer from Kazakhstan was on average 4113 km. The main suppliers were the Russian Federation (21.9%), France (16.7%), and China (13.5%). Kazakhstan applies a 0% customs tariff to imports of this commodity. The possibility of additional exports in 2020 amounted to 1.409 mil. EUR. From the point of view of competition, the group of iron and steel products not specified elsewhere (HS 7326) can be perceived as promising for Slovak exporters, the market concentration was at the level of 0.14. The average distance from suppliers was 4126 km, which were mainly China (25.3%), Russian Federation (22%), and Italy (8.3%).
5. Conclusion
Concerning the identification of the export potential of foreign trade in the example of Slovakia in Kazakhstan, we came to the following based on research on the development of the Slovak Republic’s foreign trade with the Republic of Kazakhstan, using selected single-factor indicators of competitiveness and determining the export potential of Slovakia to the territory.
The historical development of foreign trade between the Slovak Republic and the Republic of Kazakhstan indicates significant reserves. It is marked by considerable geographical distance as well as different integration priorities. Slovak-Kazakh relations were most intense in the period under review in 2014 when their mutual trade was higher than would be expected given their position in the world economy. We can assume that this was the impact of the imposition of EU sanctions on the Russian Federation and the strengthening of Kazakhstan’s re-export operations, as part of the Eurasian Economic Union.
It was not until 2020 that a mutual turnover of foreign trade was over 100 mil. EUR, which was caused by the growth of Slovak imports. Foreign trade flows within individual product groups were observed at the inter-industry level. The calculation of the trade complementarity index indicated that Slovak supply is more complementary to Kazakh demand than vice versa. The highest value of trade complementarity of 66.78 was in 2014.
Concerning the Republic of Kazakhstan, the Slovak Republic had an export potential of EUR 95.928 million in the period under review, which concerns 56 goods. The scope for the advantage of additional exports can be perceived positively, as its use is limited to only 2%. Considering the geographical distance and the resulting higher transaction costs, the focus should be on higher value-added exports. The Slovak Republic has the highest untapped export potential in the group of cab bodies for tractors, motor vehicles … (HS 8707) to Kazakhstan (EUR 19.339 million). Other goods with the potential for additional export include air or vacuum pumps (HS 8414), electric wagons and wagons (HS 8606), central heating boilers, except electric, and parts thereof (HS 8403), and others. The goods in which the export potential of the Slovak Republic was revealed correspond to the transformation process of the Republic of Kazakhstan under the Development Strategy of Kazakhstan and ‘Nurly Zhol 2020-2025’. These findings do not identify the Republic of Kazakhstan as one of the most promising partners in the Slovak Republic in terms of exports. They point to other possibilities of expansion of Slovak exports with a more diversified composition of the commodity structure.
From the perspective of the Republic of Kazakhstan, the Visegrad countries represent significant potential in trade and investment cooperation. In addition to the automotive industry, Slovakia is gaining a foothold in the Kazakh market in the field of services, such as the construction of sports grounds, and in the IT segment, mainly in the field of artificial intelligence, such as the production of flight simulators. The significant potential of mutual trade cooperation is also seen in the areas of circular economics and the production of building materials. At the same time, Kazakhstan is an eminent partner for Slovakia in the defence, energy, and chemical industries.
The competitiveness of Slovak production and its implementation on the Kazakh market, together with the favourable development of mutual trade, will be an influential factor in the positive impact on the development of Slovak exports to Kazakhstan. If Slovak producers want to be competitive in the markets of Kazakhstan, they must be able to offer sophisticated products that meet the needs of local demand. At present, price competitiveness is an extensive factor. Just as China has included Kazakhstan in its New Silk Road initiative, it will strengthen its position from both a trade and a political perspective. At the same time, significant competition comes from producers in Russia, with whom Kazakhstan already has historical ties.
Acknowledgement
This article was prepared within the project of the Ministry of Education, Science Research and Sports of the Slovak Republic. VEGA No. 1/0419/23 The Position of Third Countries in External Economic Relations and the Competitiveness of the Economy of the Slovak Republic under the Influence of Geoeconomic Changes and VEGA No. 1/0398/22 The Current Status and Perspectives of the Development of the Market of Healthy, Environmentally Friendly and Carbon-neutral Products in Slovakia and the European Union.
Disclosure statement
No potential conflict of interest was reported by the author.
References
- Archiereev, S. (2018). Ocenka realizacii potenciala exportnoj specializacii mezdunarodnymi biznesom. Naukovij visnik. Odeskij nacionalnyj ekonomickeskij universiteta, 23–43.
- Baccini, L., Dür, A., & Elsig, M. (2018). Intra-industry trade, global value chains, and preferential tariff liberalization. International Studies Quarterly, 62(2), 329–340. https://doi.org/10.1093/isq/sqy006
- Balassa, B. (1965). Trade liberalisation and “revealed” comparative advantage 1. The Manchester School, 33(2), 99–123. https://doi.org/10.1111/j.1467-9957.1965.tb00050.x
- Bas, M., & Strauss-Kahn, V. (2014). Does importing more inputs raise exports? Firm-level evidence from France. Review of World Economics, 150(2), 241–275. https://doi.org/10.1007/s10290-013-0175-0
- Bronček, J. (2019). Identifikácia exportného potenciálu Slovenskej republiky pri obchodovaní s Čínskou ľudovou Republikou—Ricardovský prístup. Ekonomické Rozhľady: vedecký Časopis Ekonomickej Univerzity v Bratislave, 48(2), 158–178.
- Brülhart, M. (1994). Marginal intra-industry trade: Measurement and relevance for the pattern of industrial adjustment. Review of World Economics, 130(3), 600–613. https://doi.org/10.1007/BF02707615
- Byrd, W. (2006). Economic cooperation in the wider Central Asia Region. (No. 75). The World Bank Working Paper.
- Cornell, S. E., & Engvall, J. (2017, September 6). The EU and Central Asia: Expanding economic cooperation, trade and investment. The Central Asia-Caucasus Analyst, 1, 1–4.
- Crespo, N., & Fontoura, M. P. (2004). Intra-industry trade by types: What can we learn from Portuguese data? Review of World Economics, 140(1), 52–79. https://doi.org/10.1007/BF02659710
- Destler, I. M., & Odell, J. (1987). The politics of anti-protection. Institute for International Economics.
- Drysdale, P., & Garnaut, R. (1982). Trade intensities and the analysis of bilateral trade flows in a many-country world: A survey. Hitotsubashi Journal of Economics, 22(2), 62–84.
- Egger, H., Greenaway, D., & Egger, P. H. (2005). Trade liberalisation with multinational firms: Effects on welfare and intra-industry trade. University of Nottingham Research Paper, (2005/06).
- Falciola, J., Jansen, M., & Rollo, V. (2020). Defining firm competitiveness: A multidimensional framework. World Development, 129, 104857. https://doi.org/10.1016/j.worlddev.2019.104857
- Falvey, R. E. (1981). Commercial policy and intra-industry trade. Journal of International Economics, 11(4), 495–511. https://doi.org/10.1016/0022-1996(81)90031-3
- Fertö, I., & Hubbard, L. J. (2003). Revealed comparative advantage and competitiveness in Hungarian agri–food sectors. The World Economy, 26(2), 247–259. https://doi.org/10.1111/1467-9701.00520
- Goldberg, L. S. (2010). Is the international role of the dollar changing? Current Issues in Economics and Finance, 16(1), 1–7.
- Hamilton, C., & Kniest, P. (1991). Trade liberalisation, structural adjustment, and intra-industry trade: a note. Weltwirtschaftliches Archiv, 127(2), 356–367. https://doi.org/10.1007/BF02707991
- Hinloopen, J., & Marrewijk, C. (2001). On the empirical distribution of the Balassa index. Weltwirtschaftliches Archiv, 137(1), 1–35. https://doi.org/10.1007/BF02707598
- Cheong, D., Decreux, Y., & Spies, J. (2018). Spotting export potential and implications for employment in developing countries. (No. 995008093502676). International Labour Organization.
- Kono, D. Y. (2009). Market structure, electoral institutions, and trade policy. International Studies Quarterly, 53(4), 885–906. https://doi.org/10.1111/j.1468-2478.2009.00561.x
- Konopelko, A. (2018). Eurasian Economic Union: A challenge for EU policy towards Kazakhstan. Asia Europe Journal, 16(1), 1–17. https://doi.org/10.1007/s10308-017-0480-7
- Krugman, P. (1994). Competitiveness: A dangerous obsession. Foreign Affairs, 73(2), 28. https://doi.org/10.2307/20045917
- Krugman, P. R. (1981). Intraindustry specialization and the gains from trade. Journal of Political Economy, 89(5), 959–973. https://doi.org/10.1086/261015
- Krugman, P. R. (1996). Making sense of the competitiveness debate. Oxford Review of Economic Policy, 12(3), 17–25. https://doi.org/10.1093/oxrep/12.3.17
- Lafay, G. (1987). Avantage comparatif et compétitivité. Economie Prospective Internationale, 29, 39–52.
- Madeira, M. A. (2016). New trade, new politics: Intra-industry trade and domestic political coalitions. Review of International Political Economy, 23(4), 677–711. https://doi.org/10.1080/09692290.2016.1218354
- Manger, M. (2015). PTA design, tariffs and intra-industry trade. In Trade cooperation: The purpose, design and effects of preferential trade agreements (pp. 195–217). Cambridge. https://www.cambridge.org/us/academic/subjects/law/international-trade-law/trade-cooperation-purpose-design-and-effects-preferential-trade-agreements?format=HB&isbn=9781107083875
- McCaig, B., & Pavcnik, N. (2018). Export markets and labor allocation in a low-income country. American Economic Review, 108(7), 1899–1941. https://doi.org/10.1257/aer.20141096
- Melitz, M. J., & Ottaviano, G. I. (2008). Market size, trade, and productivity. Review of Economic Studies, 75(1), 295–316. https://doi.org/10.1111/j.1467-937X.2007.00463.x
- Menezes-Filho, N. A., & Muendler, M. A. (2011). Labor reallocation in response to trade reform. (No. w17372). National Bureau of Economic Research.
- Michaely, M., & Wajnryt, D. (2017). Intra-industry, intra-product, and inter-product trade. Global Economy Journal, 17(3), 24–35. https://doi.org/10.1515/gej-2017-0024
- Milner, H. V. (1997). Interests, institutions, and information: Domestic politics and international relations. Princeton University Press.
- Niazi, R. Z. M. F. K., & Nizami, U. (2015). Cotton export potential: A case study of Pakistan. Journal of Economics and Sustainable Development, 6(5), 134–140.
- Ochieng, J., Abala, D., & Mbithi, M. (2020). Infrastructure development and intra-regional trade: The case of east African community. The European Journal of Applied Economics, 17(2), 104–118. https://doi.org/10.5937/EJAE17-26791
- Prahalad, C. K., & Hamel, G. (2009). The core competence of the corporation. In Knowledge and strategy (pp. 41–59). Routledge.
- Thom, R., & McDowell, M. (1999). Measuring marginal intra-industry trade. Weltwirtschaftliches Archiv, 135(1), 48–61. https://doi.org/10.1007/BF02708158
- Tongzon, J. L. (2005). ASEAN‐China free trade area: A bane or boon for ASEAN countries? The World Economy, 28(2), 191–210. https://doi.org/10.1111/j.1467-9701.2005.00643.x
- Vollrath, T. L. (1991). A theoretical evaluation of alternative trade intensity measures of revealed comparative advantage. Weltwirtschaftliches Archiv, 127(2), 265–280. https://doi.org/10.1007/BF02707986
- Vona, S. (1991). On the measurement of intra-industry trade: Some further thoughts. Weltwirtschaftliches Archiv, 127(4), 678–700. https://doi.org/10.1007/BF02707415
- Yeats, A. J. (1985). On the appropriate interpretation of the revealed comparative advantage index: Implications of a methodology based on industry sector analysis. Weltwirtschaftliches Archiv, 121(1), 61–73. https://doi.org/10.1007/BF02705840