
 ?Mathematical formulae have been encoded as MathML and are displayed in this HTML version using MathJax in order to improve their display. Uncheck the box to turn MathJax off. This feature requires Javascript. Click on a formula to zoom.
Abstract
The subject of this paper is the assessment of the efficiency of oil companies operating in the Republic of Serbia. This paper presents the possibilities of applying non-parametric methods in researching the efficiency of oil companies in the Serbian market. In addition to the standard variables for measuring technical efficiency, the market share should be taken into account, because the oil market is an example of an imperfect competition market. By applying the quantitative-analytical method (Data Envelopment Analysis), obtained results show the development of the efficiency of oil companies in the relevant market, and indicate that the efficiency of oil companies improved during the analysed period. However, the results also indicate that there is still a problem of misallocation of resources. The reasons for this outcome are interesting and debatable for this industrial area.
1. Introduction
The energy industry contributes to sustainable development in many ways (Borges et al., Citation2022): by encouraging employment and entrepreneurship, providing access to energy, contributing to the government budget through the payment of various taxes, investing in research and development and encouraging the development of technologies and products, as well as investing in local communities. Developing countries, such as the Republic of Serbia, are characterized by a continuous increase in energy demand (Shahsavari & Akbari, Citation2018). At the same time, oil still takes a significant share in the structure of consumption of energy resources (Filimonova et al., Citation2020). In recent years, the consumption of total available energy per inhabitant in the Republic of Serbia records an average increase of about 3% per year (Ministry of Mining & Energy, 2022). Since the middle of the last century, the Republic of Serbia has been producing oil and gas in certain quantities, but it is still highly dependent on imports, primarily from Russia. The production of crude oil in the Republic of Serbia is not sufficient to meet the needs of industry and the population, and it is necessary and unavoidable to import crude oil in order to bridge the gap between demand and supply. According to the Energy Balance of the Republic of Serbia for the year 2022, 80% of the required amount of crude oil (and semi-products) will be provided from imports (Ministry of Mining & Energy, 2022). However, high import dependence means that in the event of an increase in the price of crude oil, there will be an increase in the price of imports. This can consequently be harmful for oil companies, bearing in mind that the profit margin is reduced (Haykir et al., Citation2022). With the above in mind, oil companies must find ways to improve profit margins and maintain competitiveness in the market, which can be achieved with efficient use of resources. Reaching efficient use of resources requires improving and achieving the technical efficiency of oil companies’ operations, which will lead to a reduction in the use of inputs and an increase in profits (Dalei & Joshi, Citation2020). Achieving technical efficiency means improving operational aspects of business, within the limits of existing technology (Joly, Citation2012). In other words, technical inefficiency indicates that there is an opportunity to improve operational processes without additional investment in new technology. Therefore, the quantification of technical efficiency is particularly important in order to identify misallocation of resources with the aim of improving operational performance while working with existing technology (Dalei & Joshi, Citation2020).
However, when analysing the oil industry, it should be kept in mind that the supply chain involves upstream and downstream sector. Upstream sector refers to exploration and development, while the downstream sector encompasses refinery and sales (Atris, Citation2020). Our focus is on the downstream sector, especially on the sales, because sales represent the function that involves interaction with consumers (Atris & Goto, Citation2019) and the business success of oil companies primarily depends on their market position.
The market of oil and oil derivatives in the Republic of Serbia during the last decade has changed and evolved substantially. Since 2010, influenced by the process of liberalization, privatization, and implementation of new regulations (Energy Law, Citation2011; Regulation on the Conditions & Manner of Oil Import & Processing, 2020) the market of oil and oil derivatives in the Republic of Serbia has changed its structure rapidly. The number of oil companies involved in the sale of oil and oil derivatives increased. Before 2010, just NIS/Gaspromnjeft (Oil Industry of Serbia, in Serbian: Naftna Industrija Srbije, abbreviated hereafter as NIS) was involved in the oil and oil derivates market of the Republic of Serbia, as a monopoly. The activity of retail trade in oil derivatives in the Republic of Serbia is carried out by companies owned by domestic and foreign companies, whose subsidiaries are registered in the Republic of Serbia.Footnote1 At the same time, except for the number of participants, the size of participants also changed. According to the market share, six companies are large and medium-sized, while other companies are small. Therefore, the market conditions have changed during the observed period. Companies faced the need to adapt their business operations in order to improve their competitive position. To maintain their market shares they had to increase efficiency of their technical efficiency.
The importance of research is reflected in identifying efficient oil companies, as well as in providing guidelines to inefficient companies in order to reach the efficiency limit. In line with this, management of oil companies may benefit from research results. Also, gained results may represent a basis for future research. In order to analyse the technical efficiency of oil companies in the Republic of Serbia, the DEA method will be applied. Basic research hypotheses that will be tested are: a) Application of DEA method provides a scientifically-based framework for measurement and assessment of the performance of oil companies in the Republic of Serbia; b) Foreign-owned companies operate more efficiently than domestic-owned companies; c) Efficiency of specific market players in achieving revenue comes from a more favourable position in the market, in the form of greater market share.
2. Literature review
Maintaining and managing a high level of competition in the industry is very important for the industry itself, but also for the entire economy. Competition is reflected in a company’s ability to secure, maintain, and increase its shares in both domestic and international commodity markets (Pappa, Citation2019). In order to survive a competition, oil companies have to monitor, measure, and improve their efficiency. An increase in technical efficiency leads to an increase in the price competitiveness of gas stations, regardless of any increased concentration (Lagos, Citation2019). Therefore, oil companies should be dedicated to technical efficiency increases.
Many techniques and mathematical approaches have been proposed over the past decades for solving the problem of assessing relative efficiency. The DEA method is a systematic analytical method firstly developed by Charnes et al. (Citation1978) which nowadays attracts the attention of many researchers. Successful application of this method could be the reason for its widespread use.
Numerous studies have addressed the efficiency analysis of different business entities in the field of the energy industry utilizing the DEA method. Eller et al. (Citation2011) investigated the operational efficiency of national oil companies. Their results indicate that the relative technical inefficiency of the sample companies is primarily caused by the government exercising control over the distribution of rents, which causes inefficiencies in revenue generation, primarily through lower levels of production and higher prices. Ike and Lee (Citation2014) took the environmental factors and examined the productivity and relative technical efficiency of 38 national (public) and international oil companies (private) which belong to the world’s largest 50 oil companies in the period of 2003–2010 using the DEA method, and their results indicate that international oil companies performed better in the analysed period. Gong (Citation2018) investigated the impact of non-commercial objectives (alongside subsidizing below-market energy prices and excessive employment efficiency) of national and international oil companies (privately owned) in the oil industry over the period 2009–2015, using stochastic frontier models. Ismail et al. (Citation2013) inspected the economic efficiency and environmental performance of global operations of selected oil companies (companies were chosen from the 2008 GLOBAL 500) in the oil industry based on their 3-year average value of assets, using a DEA method, Pearson’s coefficient of correlation, and the Spearman rank correlation coefficient. They discovered a weak positive association between technical efficiency and eco-efficiency, concerning environment protection operations taken by oil companies. Atris and Goto (Citation2019) examined the operational efficiency related to the environmental regulations of 34 oil and gas companies that operated in the United States over the period 2011–2015, using non-radial DEA models. Their study examined refineries’ operational efficiency and conducted an efficiency-based rank assessment using an unbalanced panel dataset comprised of oil and gas refineries in four global regions (U.S. and Canada; Europe; Asia-Pacific; Africa and the Middle East) covering 2008 to 2017. Sueyoshi and Wang (Citation2018) examined the performance of oil companies in the United States’ product distribution versus green technology innovations in the United States using the DEA method. Hosseini and Stefaniec (Citation2019) evaluated the overall efficiency of the oil refining industry in Iran using a novel dynamic two-stage slacks-based measure framework over the period 2011–2015. Their model decomposes the efficiency of refineries into operational and profitability subunits. In the first stage, they qualify by-products like emissions as undesirable outputs and incorporate mazut as an unprofitable product. In the second step, they indicate a significant negative relationship between the overall efficiency scores and the amount of mazut produced in refineries. Dalei and Joshi (Citation2020) assessed the technical efficiency of 12 oil refineries in India and revealed the main factors that affect the obtained efficiency. Atris (Citation2020) investigated the operational efficiency of 696 oil and gas refineries using DEA model and discovered that the U.S. and Canada region shows a superior performance over Europe, Asia-Pacific, and Africa and the Middle East regions. Hatami-Marbini et al. (Citation2022) proposed robust DEA approach for the assessment of efficiency and productivity of the oil refineries in 25 countries over the period 2000–2018 considering data uncertainty along with undesirable outputs. Tavana et al. (Citation2019) applied the fuzzy network DEA model for the assessment of the relative technical and environmental efficiency of nine Iranian refineries between 2013 and 2016. Wolf (Citation2009) examined the influence of ownership on the efficiency of oil companies. Al-Mana et al. (Citation2020) compared the financial and operational efficiencies of national and international oil companies and revealed that international oil companies accomplish, on average, higher relative efficiency compared to national oil companies. Jarboui (Citation2021) has examined the operational efficiency of oil and gas companies in the United States.
When it comes to analysing the efficiency of oil companies in the Republic of Serbia, Lukić (Citation2020) examined the economic and financial performance of the efficiency of trade, concerning earnings, assets, capital, sales, and net profit of oil companies, by integrated application of the Fuzzy AHP-TOPSIS method. Also, Lukić (Citation2018) analysed the sustainable development of oil companies in the Republic of Serbia, with particular reference to the company NIS by applying ratio analysis, DuPont analysis, strategic profit model, comparative analysis, and statistical analysis. Hence, so far, a similar analysis of the efficiency of the oil company’s operations in the Republic of Serbia, based on market share and revenue, has not been done.
3. The research methodology and data
According to the Serbian Business Registers Agency, the number of oil companies operating in the Republic of Serbia in the period 2011–2018 was 15 (Serbian Business Registers Agency, Citation2020). However, the gathering of specific and necessary data for all oil companies in order to conduct the analysis was not feasible. In the observed period (2011–2018), collected data refer to a 90% of market share of total revenues in the oil and oil derivatives market (six companies). According to the available data, the supply of the oil and oil products market in the Republic of Serbia is highly concentrated. This is confirmed by data on the market shares of each oil company in total revenues. The data in the realized revenues has been retrieved from financial statements issued by the Serbian Business Registers Agency and compared to generally realized revenues of the relevant market for the observed period. During the observed period, the largest revenues of motor gasoline and diesel fuel in retail trade was achieved by NIS and its share was about 40–50% (Competition Commission, Citation2019). Therefore, the oil and oil derivatives market is an oligopoly with a dominant company NIS/Gaspromnjeft (with almost 50% of the market share), while other oil companies in the sample have less than 10% of the market share (observed individually). It can be noticed that there is a growing trend of uneven distribution of market share in the market of oil and oil derivatives of the Republic of Serbia.
The purpose of the intended analysis is a better understanding of the competitive behaviour of the leading oil companies in the market through the analysis of their technical efficiency. Regarding this, Craig and Savage (Citation2013) examined the effects of market restructuring that introduced competition into the United States energy sector. Model estimates show that competition increases the efficiency of companies. These gains stem from organizational and technological changes within the company and are not due to the attrition of inefficient companies. Specifically, according to the competition-efficiency hypothesis more competitive market is characterized by higher efficiency (Craig & Savage, Citation2013). Therefore, the market shares and revenues of oil companies are the focus of this research, i. e. represents the outputs of the applied method. This paper aims to assess the technical efficiency of six oil companies that have operated in the Republic of Serbia in the period 2011–2018 using Data Envelopment Analysis (abbreviated and hereinafter referred to as the DEA). Applied methods in this paper are relatively rarely used in the Republic of Serbia, but it is expected that this and similar papers encourage more frequent use of parametric and non-parametric methods in the efficiency assessments.
3.1. Basic DEA models
The DEA method is an analytical technique used for assessing efficiency of decision-making units (abbreviated DMUs). It allows the measurement of relative technical efficiency of various decision units that perform the same or similar tasks (Halkos & Salamouris, Citation2004). Besides this, ‘the DEA method provides the efficiency frontier for the ensemble of the analysed units, and then each decision unit from the data set used is evaluated concerning this frontier, and a relative efficiency is associated with the units with the best performances’ (Andries & Cocris, Citation2010, p. 58).
The objective of the DEA method is to determine the efficiency frontier which consists of the best oil companies within the data under consideration. This efficiency frontier indicates the efficiency of resource usage and it is a guideline for non-efficient DMUs in the sense of how they can increase the level of efficiency of the use of their resources. For each production unit, DEA calculates the efficiency score, determines the relative weights of inputs and outputs, and identifies peers for each unit that is not technically efficient (Dlouhý, Citation2009). DEA method contains two types of data, input and output data. Based on the orientation, models can be input-oriented, output-oriented, or non-oriented. Input-oriented models proceed from the assumption that the output values are fixed or non-changeable so that the input parameters are adjusted to increase efficiency (Cooper et al., Citation2000). The premise in output-oriented models is that the input parameters are fixed so that in order to increase efficiency output values are adjusted. The selection of model orientation depends on the characteristics of the industry for which efficiency analysis is performed.
The determination of technical efficiency does not require a priori specification of input and output weights, which is one of the advantages of the DEA method (Asmild et al., Citation2007). The mathematical formulation of the DEA method comprises defining a linear programming problem that aims to find a set of coefficients ( and
) which will result in the highest possible ratio of output and input for the organizational unit which is the subject of analysis. In literature and practice, there are two most commonly used DEA models: a DEA model with constant returns-to-scale and a DEA model with variable returns-to-scale. CCR—Charnes, Cooper, and Rhodes model (Charnes et al., Citation1978) is more restrictive and the efficiency ascertained by CCR is always less or equal to the efficiency ascertained by BCC—Banker, Charnes and Cooper model (Banker et al., Citation1984). ‘CCR model is built on the assumption of constant and BCC model on the assumption of variable returns to scale activities. Therefore, knowing the characteristics of the production frontiers of the process to be analysed is crucial for model type selection’ (Škuflić et al., Citation2015, p. 94). Therefore, a constant returns-to-scale measure of both pure technical efficiency and scale efficiency, while the BCC model measures pure technical efficiency. The primal CCR DEA model can be mathematically represented as follows (Cooper et al., Citation2004):
(1)
(1)
Wherein:
—the value of the output
—the value of the input
—weighting coefficient of output
—weighting coefficient of input
r = 1, 2… s—number of the generated output
i = 1, 2… m—number of used resources
j = 1, 2… n—number of decision units
Input-oriented dual CCR DEA model can be represented mathematically:
(2)
(2)
Wherein
represents a vector of weighting coefficients. The vectors s+ and s– represent positive and negative adjusting variables (slacks) in the input and output constraints, ε is an infinitely small constant and θ is a scalar variable that represents the rate of reduction of the input in order to meet the boundaries of efficiency. The decision unit is efficient if the following two conditions are met (Jablonský, Citation2007): the optimum value of the variable θ* is 1 and the optimal values of all adjusting variables s+ and s− (slacks) are equal to zero. If the resulting value is less than 1 decision unit is considered inefficient and it is possible to achieve the same level of output with fewer resources.
BCC models contain one additional restriction to the vector of the weight coefficients:
(3)
(3)
When it comes to choosing between the two models, it is often stated that the CCR model is used in situations of perfect competition, when DMUs operate at their optimal size and that this is not appropriate for most real-world situations (Pai et al., Citation2020). The BCC model can overcome this problem and assess the pure technical efficiency of the DMUs in the existence of imperfect competition. ‘In addition, the DEA model can be adjusted to the strategy chosen by management. If the aim is in reducing the input amounts by as much as possible while keeping at least the present output levels, the input-oriented model is used. If the aim is in maximizing the output levels under at most the present input consumption, the output-oriented model is used (Škuflić et al., Citation2015). Therefore, the input-oriented BCC model will be applied for the assessment of the efficiency of oil companies in the Republic of Serbia. The reason for choosing this orientation of the model is the fact that oil companies have more control over their inputs than over their outputs.
3.2. Model development
One of the major drawbacks of traditional DEA is that the analysis is performed in only a one-time period, and it is difficult to see changes in efficiency when there is more than a one-time period (Řepková, Citation2014). In situations where there is more than a one-time period, it is possible to apply a panel DEA, known as Window DEA. The window analysis technique is a useful tool for the detection of performance trends of DMUs over time. Each DMU is treated as an independent unit in a different period but is still comparable in the same window (Savić et al., Citation2012). Such a feature of Window analysis allows an increase in the discriminatory power of the DEA in the situation of a small number of DMUs and a large number of inputs and outputs (Cooper et al., Citation2011). Thus, by applying Window analysis, problems with a small number of DMUs can be solved. The first step in developing a model that will be used for assessing the efficiency of oil companies is the selection of the appropriate outputs and basic inputs used to achieve the defined outputs. When considering the variables that will be subject to analysis one should have in mind that using more variables causes some problems. Specifically, when the number of input and output variables is large it can lead to imprecise results. A large number of variables in the model may cause an increase in the number of efficient companies and analysis becomes useless. Accordingly, if there is an increase in the number of inputs, the number of observed entities must be increased. Therefore, it was necessary to select those indicators that in the best way give a true picture of the business of the entity under evaluation, which is one of the main challenges with the application of this method. Specifically, the obtained results are significantly influenced by the selected inputs and outputs (Cooper et al., Citation2004), so when creating the model, variables that best represent the operations of DMUs should be carefully selected.
In addition, when selecting variables, the availability of data must be considered, especially if a longer period of time is analysed. The sources of data are the database of the Agency for Economic Registers. This choice ensured the reliability of the data and the equal treatment of the sampled participants. Also, the used published annual reports contain enough data that can be used to analyse technical efficiency. According to the data availability and considering their importance, subsequent input and output variables are selected: operating expenses, the number of employees, total assets, revenue, and the market share. The selection of variables was performed based on the review of inputs and outputs in various research given in Sueyoshi and Wang (Citation2018). Regarding the selection of inputs, operating expenses are used to indicate the operating liquidity of a company while total assets and number of employees represent a proxy for a producer’s size (Wang & Li, Citation2018). In particular, using an indirect approach, the level of operating expenses indicates the company’s liabilities, where a higher level of expenses can potentially threaten the operating liquidity of the company. When it comes to total assets, higher total assets usually point to higher production and service capability for the company, while large number of employees may lead to operational inefficiencies due to increase in the labour cost burden for the company (Atris & Goto, Citation2019). On the other hand, a market share represents the strength of the company on the market, while revenue indicates the operational soundness of the company. Specifically, revenue indicates the operational size of the company and points to its business success (Jarboui, Citation2021).
Development and application of the model, according to model assumptions, require securing a sufficient degree of freedom, which is necessary for the significance of analysis. The general rule is that there should be at least 3 DMUs for each input and output here m is the number of inputs, s is the number of outputs and n is the number of DMUs (Savić et al., Citation2012). In the literature, a different set of rules may also be found, e. g.
or
(Cooper et al., Citation2000). Bearing in mind that six oil companies were analysed during the eight-year period, there are 48 DMUs, which satisfy the aforementioned conditions.
Data on total assets, operating expenses, number of employees, and revenue are collected from annual reports of oil companies available at the Serbian Business Registers Agency website ().
Table 1. Descriptive statistics of inputs and outputs.
Since the descriptive statistics indicate the great heterogeneity in the observed data, to ensure consistent results, data normalization is made as proposed by Sarkis (Citation2007). Efficiency assessment is further done by determining the efficiency of the observed companies concerning their own business in the past or concerning other companies operating in the domestic market. To conduct the efficiency analysis of oil companies in the Republic of Serbia two models were created. In the first model total assets, number of employees, and operating expenses were considered as input variables, and the relevant output variable was revenue. In the second model, the input variables remained the same as in the first model, but the output variable was represented by the market share.
Selected data also had to pass statistical testing to determine whether there is a functional relationship between inputs and outputs. This refers to the mathematical property of isotonicity, which means that an increase in input causes an increase in output without reducing any input (Savić, Citation2016). Determining the functional dependence is realized through correlation analysis of selected data. The correlation coefficient needed to be positive and significant, in order to the specification of the DEA model to be valid. The results of the correlation analysis are given in .
Table 2. The value of correlation coefficients.
The correlation analysis revealed high values of correlation coefficients among all variables. There are different views about the treatment of variables with high correlation coefficients. Charnes et al. (Citation1994) argue that highly correlated inputs or outputs can remain in the DEA models without distorting the efficiency scores at the expense of lower discrimination power and that is the view we support. Therefore, high correlation coefficients do not prevent us from running a DEA model because of the non-parametric nature of DEA, which is supposed to mitigate this effect (Halkos & Salamouris, Citation2004).
Based on the results of correlation analysis it can be concluded that there is a positive and significant correlation relationship among all selected variables, and it is, therefore, possible to continue further analysis.
4. Research results and discussion
The analysis was performed using Efficiency Measurement System Software (abbreviated EMS). EMS represents software specifically designed to measure the efficiency of applying the DEA method. The number of input and output parameters is not limited, as well as the number of decision units which’s assessment is performed. Results of efficiency analysis applied to the first set of data are given in .
Table 3. Average efficiency scores for the first model.
For better interpretation, the results of the efficiency analysis are presented graphically ().
Figure 1. Evolution of efficiency by years in analyzed companies - the first model.
Source: Authors’ preview.
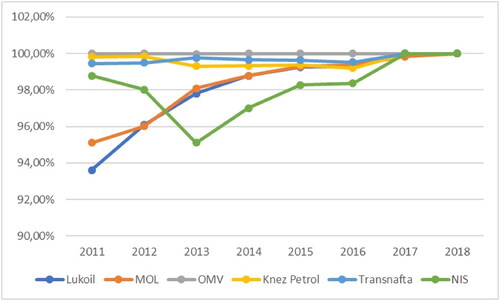
The results indicate that the average relative technical efficiency of DMUs in the first model amounted to 98.99% which means that the average oil company had to operate with 98.99% of the available inputs (total assets, employees, operating expenses) and to achieve the same revenue in order to operate efficiently. Possible reasons for the high pure technical efficiency in this model can be seen in the oligopolistic market structure and favourable position of analysed companies, which allows them to realize high revenue. It can be noticed that during the analyzed period there is a trend of improvement of technical efficiency in all observed companies. The highest efficiency improvements were achieved by Lukoil and MOL, while the highest efficiency fluctuation was recorded by NIS. The remaining companies (OMV, Knez Petrol, Transnafta) operated without major efficiency fluctuations, with OMV being the most efficient in almost the entire analyzed period.
Results of efficiency analysis applied to the second model are given in .
Table 4. Average efficiency scores for the second model.
The results indicate that the average relative technical efficiency of DMUs in the second model amounted to 94.12% which means that the average oil company had to operate with 94.12% of the available inputs (total assets, employees, operating expenses) and to achieve the same market share in order to operate efficiently. Analysis of the efficiency results presented in reveals that there was a significant efficiency fluctuation. Companies NIS, MOL, and Knez Petrol registered a significant decrease in efficiency in 2015, after which technical efficiency improved.
Figure 2. Evolution of efficiency by years in analyzed companies - the second model.
Source: Authors’ preview.
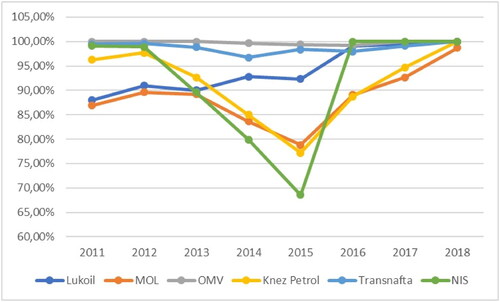
When it comes to the company MOL, the lower level of efficiency achieved after 2012 is the result of personnel changes, which gave results after 2015 in the form of an improvement in the pure technical efficiency of the company, through the expansion of the product mix and the offering of innovative products and services that enabled the realization of higher income and increasing market share (Competition Commission, Citation2016). Furthermore, the reduction of the efficiency levels of NIS was caused by the increase in operating costs that occurred due to the growing uncertainty in the world economy and the increase in volatility in the global oil market (Competition Commission, Citation2016). Regarding Knez Petrol, the main source of the inefficiency is the increases in operating costs. One of the potential reasons for the decrease in efficiency may be the fact that during 2015, Knez Petrol increased the number of workers in retail by 35% (Competition Commission, Citation2016), and that they did not adequately contribute to business results. Lukoil, on the other hand, has seen improvements in technical efficiency over the observed period. OMV and Transnafta had relatively low-efficiency fluctuations, with OMV being the most efficient during the observed period.
Further analysis was dedicated to the comparison of the obtained results, in order to determine whether the companies that are efficient regarding the market share are also efficient in acquiring revenue. The analysis was conducted using the correlation analysis of the obtained results in order to determine the level of correlation between the first and the second model ().
Table 5. Correlation analysis of data of two models.
The results indicate that there is a significant moderate correlation between the two models, that is, that companies that have been found as efficient according to the first model are found to be efficient according to the second model. This denies the hypothesis that companies with larger revenue achieve efficiency based on the higher market share. Hence, it can be noted that the average efficiency according to the second model is slightly lower (94.12%) than in the first model (98.99%), which supports the competition-efficiency hypothesis (Craig & Savage, Citation2013). Namely, the liberalization of the market of oil and oil derivatives in the Republic of Serbia (2010) had an impact on the increase of the number of market participants and decreases relative market shares.
Regarding the efficiency of companies according to their ownership, the company with the highest efficiency scores over the analysed period was the company OMV, which is a foreign-owned company. Although there were efficiency fluctuations in both models and there are differences in the values of the average technical efficiency of domestic oil companies compared to the average efficiency of foreign companies, the results of the independent samples t test indicate that they are not statistically significant (the corresponding p-value is 0.420). Therefore, the second research hypothesis is denied.
Additional analysis of the obtained efficiency results may provide guidance to inefficient oil companies on how to restructure their operations to improve their efficiency in the future. Efficiency analysis reveals the amount of resources whose usage was not adequate. Unlike the first model, where all sample oil companies where technically efficient, the results of the second BCC input-oriented model have been thoroughly examined for the last analysed year. Since there is only one inefficient company according to the second model (MOL), the target values of the inputs are calculated only for that company. The calculation of target value was done according to the following equation (Dalei & Joshi, Citation2020):
(4)
(4)
The analysis of lacks revealed that the source of inefficiency in was related to the number of employees. Namely, in 2018, MOL company employed 86 employees, while, according to the efficiency analysis a necessary number of employees was 85, meaning that one employee was misallocated and did not contribute to the MOL outcomes. Similar conclusions can be drawn for other inefficient companies in the previous periods, where the primary reason for inefficiency is often the number of employees, followed by the amount of operating expenses.
In line with this, to achieve technical efficiency, in general, the most concrete measures for all oil companies (but with emphasis on domestic oil companies) are the reduction of operating expenses and the reduction of the number of employees. Not rarely, under the conditions of low technical efficiency companies often reduce all expenses that are not necessary. Therefore, approved expenses should be exclusively essential for the continuity of operational business. Wherever it is possible excessive operating expenses should be reduced, such as expenses reducing the rented space, terminating the vehicle lease, postponing or cancelling certain ineffective services/repairs, etc.
Also, employee costs can be a significant burden in conditions of reduced technical efficiency, while on the other hand, retaining a quality workforce can be important for the company’s long-term organizational and operative success as well as technical efficiency increases. Restructuring the staff portfolio, decreasing ineffective staff quantity, using government aid, and investing in new organizational concepts, ideas, software and equipment, represent the justified direction in favour of technical efficiency level.
Finally, concerning total assets, some oil companies (for example NIS/Gaspromnjeft) often own certain properties (assets) that are not used for regular business. Also, it is possible that some part of the property has ceased to be needed. In these cases, non-performing assets can be liquidated (causing the reduction of assets) in order to obtain fresh cash while for the technical operations improvements and consulting services, assuming regular operations are not disrupted.
5. Conclusion
Monitoring and measuring the efficiency of oil companies is an issue of paramount importance since the efficiency of oil companies can have an impact on improving energy efficiency and, therefore, on the country’s economic growth, improvement of energy security, and sustainability. Therefore, the paper aimed to assess the technical efficiency of oil companies in the Republic of Serbia, using the DEA analysis over the period 2011–2018. The results indicate that the efficiency of oil companies changed in both models, annually. According to the first model, where revenue was considered as an output variable, it has been found that only 33% of companies operate efficiently in the observed period. When the efficiency results of the second model (where the market share was the output variable) were analysed around 21% of the companies operated efficiently. However, it was observed that in both models there is a tendency of efficiency improvement(s), observed by years.
In summary, the results offer several implications for oil company managers and policy makers. First, despite the fact that there is a tendency to improve efficiency in recent years, the oil industry still has problem with achieving technical efficiency, which is particularly evident in the first model. Specifically, in relation to the resources employed, the achieved market share of the observed companies should be higher, which indicates a misallocation of resources, since they were not used in a technically efficient manner. However, since pure technical inefficiency is under the direct control of oil companies, solving the problem of inefficiency is the direct responsibility of management. The management of oil companies must find ways to improve pure technical efficiency, either through improving the quality of personnel, through the reduction of operating expenses, or through liquidation of non-performing assets. Second, policymakers should harmonize regulations related to the oil and oil derivatives market, in order to best mitigate environmental shocks that may affect the technical efficiency of companies.
The study has several limitations. First, although the variable selection was done according to the previous literature review, the selection of the input and output variables was entirely subjective. Apart from the fact that the input variables were chosen according to management’s ability to influence them, there was no special rule in determining the procedures for the selection of variables. Second, due to the unavailability of data, the study does not represent the technical efficiency evaluation of all oil companies that have operated in the Republic of Serbia in the analysed period, but only an evaluation of the efficiency of one segment, which realizes 90% of total revenues. Nevertheless, the results of efficiency analysis may provide information to company management that can help to objectively assess the parameters of technical efficiency and make appropriate business decisions following internal and external circumstances that determine technical efficiency itself.
Future research can be implemented in several directions. First, since there is the large number of efficient companies, it is possible to perform a super-efficiency DEA analysis to determine the ranking of companies, that is, to rank companies based on the achieved technical efficiency. Secondly, it is possible to conduct Tobit regression analysis and determine the internal and external determinants of the obtained efficiency of oil companies. In particular, it is possible to analyse company-specific, industry-specific as well as macro-economic factors that influence the achieved level of technical efficiency of oil companies. Thirdly, to obtain assessment of the technical efficiency of the whole oil and oil derivatives market, it is possible to perform a standard DEA analysis of all oil companies in the last business year, since the data for all companies would be available on the website of the Serbian Business Registers Agency.
Disclosure statement
No potential conflict of interest was reported by the authors.
Additional information
Funding
Notes
1 After 2010, the number of oil companies has increased up to 16: NIS/Gaspromnjeft, Mol, OMV, Knez Petrol, Lukoil, Transnafta, Eko/Helenic Group, Euro Petrol Trans Subotica, Gas Petrol Pancevo, Gaspetrol Novi Sad, Naftahem Novi Sad, Evolucija 2004 Beograd, Radun Avia Novi Sad, Standard Gas Novi Sad, Petrol DOO Beograd, Nafta AD Beograd. Evolucija 2004 Beograd initiated bankruptcy proceedings.
References
- Al-Mana, A. A., Nawaz, W., Kamal, A., & Koҫ, M. (2020). Financial and operational efficiencies of national and international oil companies: An empirical investigation. Resources Policy, 68, 101701. https://doi.org/10.1016/j.resourpol.2020.101701
- Andries, M. A., & Cocris, V. (2010). A comparative analysis of the efficiency of Romanian Banks. Romanian Journal of Economic Forecasting, 13(4), 54–75. Retrieved from http://www.ipe.ro/rjef/rjef4_10/rjef4_10_5.pdf
- Asmild, M., Paradi, J. C., Reese, D. N., & Tam, F. (2007). Measuring overall efficiency and effectiveness using DEA. European Journal of Operational Research, 178(1), 305–321. https://doi.org/10.1016/j.ejor.2006.01.014
- Atris, A. M. (2020). Assessment of oil refinery performance: Application of data envelopment analysis-discriminant analysis. Resources Policy, 65, 101543. https://doi.org/10.1016/j.resourpol.2019.101543
- Atris, A. M., & Goto, M. (2019). Vertical structure and efficiency assessment of the US oil and gas companies. Resources Policy, 63(C), 1. https://doi.org/10.1016/j.resourpol.2019.101437
- Banker, R. D., Charnes, A., & Cooper, W. W. (1984). Some models for estimating technical and scale inefficiencies in data envelopment analysis. Management Science, 30(9), 1078–1092. https://doi.org/10.1287/mnsc.30.9.1078
- Borges, F. M., Rampasso, I. S., Quelhas, O. L., Leal Filho, W., & Anholon, R. (2022). Addressing the UN SDGs in sustainability reports: An analysis of Latin American oil and gas companies. Environmental Challenges, 7, 100515. https://doi.org/10.1016/j.envc.2022.100515
- Charnes, A., Cooper, W. W., & Rhodes, E. (1978). Measuring the efficiency of decision making units. European Journal of Operational Research, 2(6), 429–444. https://doi.org/10.1016/0377-2217(78)90138-8
- Charnes, A., Cooper, W. W., Lewin, A. Y., & Seiford, L. M. (1994). Data envelopment analysis: Theory, methodology and application. Kluwer Academic Publishers. https://doi.org/10.1007/978-94-011-0637-5
- Competition Commission. (2016). Analysis of the state of competition in the wholesale and retail markets of oil derivatives in the Republic of Serbia in 2014. Report. http://www.kzk.gov.rs/analiza-stanja-konkurencije-na-trzistu-trgovine-na-veliko-i-trzistu-trgovine-na-malo-naftnim-derivatima-u-republici-srbiji-u-2014
- Competition Commission. (2019). Report on Sectoral Analysis of the Retail Trade Market in 2018. Retrieved from http://www.kzk.gov.rs/kzk/wp-content/uploads/2019/12/12-2019-Sectoral-analysis-NAFTA-2018.pdf
- Cooper, W. W., Seiford, L. M., & Tone, K. (2000). Data envelopment analysis: A comprehensive text with models, applications, references and DEA-solver software. Kluwer Academic Publishers.
- Cooper, W. W., Seiford, L. M., & Zhu, J. (2004). Handbook of DEA. Kluwer Academic Publishers. https://doi.org/10.1007/b105307
- Cooper, W. W., Seiford, L. M., Zhu, J., et al. (2011). Data envelopment analysis: History, models, and interpretations. In: W. Cooper eds. Handbook on data envelopment analysis. Springer, pp. 1–39. https://doi.org/10.1007/978-1-4419-6151-8_1
- Craig, J. D., & Savage, S. J. (2013). (1996 to 2006). Market restructuring, competition and the efficiency of electricity generation: Plant-level evidence from the United States. The Energy Journal, 34(1), 1–31. https://doi.org/10.5547/01956574.34.1.1
- Dalei, N. N., & Joshi, J. M. (2020). Estimating technical efficiency of petroleum refineries using DEA and Tobit model: An India perspective. Computers & Chemical Engineering, 142, 107047. https://doi.org/10.1016/j.compchemeng.2020.107047
- Dlouhý, M. (2009). Efficiency and productivity analysis in health services. Prague Economic Papers, 18(2), 176–184. https://doi.org/10.18267/j.pep.348
- Eller, S. L., Hartley, P. R., & Medlock, K. B. (2011). Empirical evidence on the operational efficiency of national oil companies. Empirical Economics, 40(3), 623–643. https://doi.org/10.1007/s00181-010-0349-8
- Energy Law. (2011). Retrieved from http://www.aers.rs/files/Zakoni/Zakon%20o%20energetici_57-11.pdf
- Filimonova, I. V., Komarova, A. V., Provornaya, I. V., Dzyuba, Y. A., & Link, A. E. (2020). Efficiency of oil companies in Russia in the context of energy and sustainable development. Energy Reports, 6, 498–504. https://doi.org/10.1016/j.egyr.2020.09.027
- Gong, B. (2018). Different behaviors in natural gas production between national and private oil companies: Economics-driven or environment-driven? Energy Policy, 114, 145–152. https://doi.org/10.1016/j.enpol.2017.12.004
- Halkos, G. E., & Salamouris, D. S. (2004). Efficiency measurement of the Greek commercial banks with the use of financial ratios: A data envelopment analysis approach. Management Accounting Research, 15(2), 201–224. https://doi.org/10.1016/s1044-5005(04)00013-7
- Hatami-Marbini, A., Arabmaldar, A., & Asu, J. O. (2022). Robust productivity growth and efficiency measurement with undesirable outputs: Evidence from the oil industry. Or Spectrum, 1-42, 10–1007. https://doi.org/10.1007/s00291-022-00683-y
- Haykir, O., Yagli, I., Gok, E. D. A., & Budak, H. (2022). Oil price explosivity and stock return: Do sector and firm size matter? Resources Policy, 78, 102892. https://doi.org/10.2139/ssrn.4060882
- Hosseini, K., & Stefaniec, A. (2019). Efficiency assessment of iran’s petroleum refining industry in the presence of unprofitable output: A dynamic two-stage slacks-based measure. Energy, 189, 116112. https://doi.org/10.1016/j.energy.2019.116112
- Ike, C. B., & Lee, H. (2014). Measurement of the efficiency and productivity of national oil companies and its determinants. Geosystem Engineering, 17(1), 1–10. https://doi.org/10.1080/12269328.2014.887045
- Ismail, Z., Tai, J. C., Kong, K. K., Law, K. H., Shirazi, S. M., & Karim, R. (2013). Using data envelopment analysis in comparing the environmental performance and technical efficiency of selected companies in their global petroleum operations. Measurement, 46(9), 3401–3413. https://doi.org/10.1016/j.measurement.2013.04.076
- Jablonský, J. A. (2007). Spreadsheet-based system for DEA models. Multiple Criteria Decision Making, 3, 51–64.
- Jarboui, S. (2021). Renewable energies and operational and environmental efficiencies of the US oil and gas companies: A true fixed effect model. Energy Reports, 7, 8667–8676. https://doi.org/10.1016/j.egyr.2021.04.032
- Joly, M. (2012). Refinery production planning and scheduling: The refining core business. Brazilian Journal of Chemical Engineering, 29, 371–384. https://doi.org/10.1590/s0104-66322012000200017
- Lagos, V. (2019). Effectiveness of Merger remedies: Evidence from the retail gasoline industry. Journal of Industrial Economics, 66(4), 942–979. https://doi.org/10.1111/joie.12188
- Lukić, R. (2018). Analiza efikasnosti naftnih kompanija u Srbiji [Efficiency analysis of oil companies in Serbia]. Nafta i Plin, 38(154), 79–90. https://hrcak.srce.hr/204595
- Lukić, R. (2020). Analysis of the efficiency of trade in oil derivates in Serbia by applying the FUZZI AHP-TOPSIS method. Business Excellence and Management, September, 10(3), 80–98. https://doi.org/10.24818/beman/2020.10.3-06
- Ministry of Mining and Energy. (2022). Energy balance of the Republic of Serbia for the year 2022. https://www.mre.gov.rs/sites/default/files/2022/03/energetski_bilans_rs_za_2022__0.pdf
- Pappa, E. (2019). Efficiency and Innovation. In G. Ritzer (Ed.), The Blackwell Encyclopedia of Sociology. https://doi.org/10.1002/9781405165518.wbeose101.pub2
- Pai, P., Khan, B. M., & Kachwala, T. (2020). Data envelopment analysis – is BCC model better than CCR model? Case of indian life insurance companies. NMIMS Management Review, 38(1), 17–35.
- Regulation on the Conditions and Manner of Oil Import and Processing. (2020). Retrieved from https://www.carina.rs/upload/media/2020/10/20/47053/NAFTA_RASPIS_LAT.pdf
- Řepková, I. (2014). Efficiency of the Czech banking sector employing the DEA window analysis approach. Procedia Economics and Finance, 12, 587–596. https://doi.org/10.1016/s2212-5671(14)00383-9
- Sarkis, J. (2007). Preparing your data for DEA. In J. Zhu, & W. D. Cook (Eds.) Modeling data irregularities and structural complexities in data envelopment analysis (pp. 305–320). Springer US. https://doi.org/10.1007/978-0-387-71607-7_17
- Savić, G., Radosavljević, M., & Ilijevski, D. (2012). DEA window analysis approach for measuring the efficiency of Serbian banks based on panel data. Management - Journal for Theory and Practice of Management, 17(65), 5–14. https://doi.org/10.7595/management.fon.2012.0028
- Savić, G. (2016). Implementacija analize obavijanja podataka [Application of DEA Method]. Retrieved from http://pa.fon.bg.ac.rs/wp-content/uploads/2016/02/Primena-DEA-metode.pdf
- Serbian Business Registers Agency. (2020). Financial statements. Retrieved from https://www.apr.gov.rs/home.1435.html
- Shahsavari, A., & Akbari, M. (2018). Potential of solar energy in developing countries for reducing energy-related emissions. Renewable and Sustainable Energy Reviews, 90, 275–291. https://doi.org/10.1016/j.rser.2018.03.065
- Škuflić, L., Rabar, D., & Šokčević, S. (2015). Assessment of the efficiency of Croatian counties using data envelopment analysis. Economic Research-Ekonomska Istraživanja, 23(2010-2), 88–101. https://doi.org/10.1080/1331677x.2010.11517414
- Sueyoshi, T., & Wang, D. (2018). DEA environmental assessment on US petroleum industry: Non-radial approach with translation invariance in time horizon. Energy Economics, 72, 276–289. https://doi.org/10.1016/j.eneco.2018.02.003
- Tavana, M., Khalili-Damghani, K., Arteaga, F. J. S., & Hosseini, A. (2019). A fuzzy multi-objective multi-period network DEA model for efficiency measurement in oil refineries. Computers & Industrial Engineering, 135, 143–155. https://doi.org/10.1016/j.cie.2019.05.033
- Wang, D., & Li, T. (2018). Carbon emission performance of independent oil and natural gas producers in the United States. Sustainability, 10(1), 110. https://doi.org/10.3390/su10010110
- Wolf, C. (2009). Does ownership matter? The performance and efficiency of State Oil vs. Private Oil (1987–2006). Energy Policy, 37(7), 2642–2652. https://doi.org/10.1016/j.enpol.2009.02.041