
 ?Mathematical formulae have been encoded as MathML and are displayed in this HTML version using MathJax in order to improve their display. Uncheck the box to turn MathJax off. This feature requires Javascript. Click on a formula to zoom.
Abstract
Volatility transmission is a crucial price phenomenon that influences upstream production and downstream consumption in agricultural commodity markets. However, existing studies offer little evidence on how product perishability is related to price volatility transmission along the agricultural market chain. This study investigates how price volatilities are transmitted across the farm, wholesale, and retail stages using high-frequency data from litchi and apple markets in China. We adopt various MGARCH models and volatility impulse response functions to evaluate the time evolution of price volatility correlation, and the direction and magnitude of price volatility transmission. Empirical results indicate that in the litchi market chain, the wholesale stage plays a dominant role in price volatility transmission, and the wholesale and retail stages have higher volatility spillover effects on the farm stage than vice versa. However, we find little evidence of price volatility transmission along the apple market chain. Our findings suggest that the degree of price volatility transmission is stronger for higher product perishability.
1. Introduction
In the past twenty years, countries worldwide have experienced an increasing degree of price fluctuations in agricultural commodity markets. This price phenomenon has received considerable attention in the economic literature (e.g., Lloyd, Citation2017; Assefa et al., Citation2015; Frey & Manera, Citation2007; Meyer & Cramon-Taubadel, Citation2004), which examines price linkages across agricultural market stages. Current studies mainly examine the price-level transmission that deals with the relationship between predictable components of prices (e.g., Zheng & Pan, Citation2022; Liu et al., Citation2019; Fousekis et al., Citation2016; Shrinivas & Gómez, Citation2016; Bakucs et al., Citation2014). Although evidence on price transmission is accumulating, there is limited research on the extent to which price volatility in one market, commonly referred to unpredictable price changes (Boyd & Bellemare, Citation2020), affects the one in other markets. In this paper, we adopt China’s litchi and apple markets to investigate price volatility transmission along the agricultural market chain. Investigating volatility transmission is particularly informative to academic researchers and policymakers since it may bring great risks and uncertainties to all market actors.
The early literature on agricultural price volatility transmission was partly inspired by price transmission studies that apply a Vector Autoregressive (VAR) model to explore price linkages across market chain stages. For example, Khan and Helmers (Citation1997) use the VAR model on moving variances of monthly prices to investigate price volatility transmission between the U.S. beef and pork markets. Subsequently, a series of studies build on the above literature and extend it in the framework of the Generalized Autoregressive Conditional Heteroskedasticity (GARCH). Some research on price volatility transmission concentrates on applications of univariate GARCH family models. Natcher and Weaver (Citation1999) use the predicted conditional variances of univariate GARCH models to estimate volatility spillover effects in the U.S. beef market chain. Buguk et al. (Citation2003) and Uchezuba et al. (Citation2010) adopt the univariate exponential GARCH models to investigate price volatility transmission in the U.S. catfish and South African farm-retail broiler market chains, respectively. Additionally, Serra (Citation2011) investigates volatility spillover patterns in the Spanish beef market chain using the univariate smooth transition conditional correlation GARCH model.
The methodological limitation in the univariate GARCH models is that the identification is inappropriate to account for the cross-market volatility process. To address this concern, recent studies devote increasing attention to multivariate GARCH (MGARCH) models (Khiyavi et al., Citation2012; Apergis & Rezitis, Citation2003), which are advantageous in identifying the cross-market price volatility spillover and persistence effects. For instance, using the standard MGARCH models, Rezitis (Citation2003) and Rezitis and Stavropoulos (Citation2011) investigate price volatility transmission across meat markets (e.g., lamb, beef, pork, and poultry) in Greece. Moreover, Abdelradi and Serra (Citation2015) employ the MGARCH model with the BEKK specification to investigate price volatility transmission between food and biofuel markets in Spain.
Although volatility transmission studies discussed above have made much progress in methodologies and product data, the existing literature does not offer a consistent conclusion on price volatility transmission along the agricultural market chain. Notably, the current studies document that price volatility linkages are empirically detected across all or some market chain stages in some products and countries but not in others (e.g., Abdallah et al., Citation2020; Assefa et al., Citation2017; Serra, Citation2015), leading to a compromise opinion that price volatility transmission largely depends on local conditions. It also motivates some research to investigate the contextual factor of price volatility transmission along the agricultural market chain. However, except limited evidence on market power, contracts, and production nature (Assefa et al., Citation2017, Citation2015; Apergis & Rezitis, Citation2003), other possible factors, such as product characteristics, menu costs, inventory, etc., remain uninvestigated.
This study examines price volatility transmission using data from China’s litchi and apple markets. We adopt MGARCH models with the constant conditional correlation (CCC) and dynamic conditional correlation (DCC) specifications to compare price volatility correlations across different chain stages. Furthermore, we use the MARCH model with the BEKK specification and the volatility impulse response function (VIRF) to examine the direction and magnitude of price volatility transmission. Our results show that price volatility linkages across farm, wholesale, and retail stages are more pronounced in the litchi market chain than in the apple market chain. These findings are reasonable since price volatility transmission tends to be strong for agricultural products requiring a minimal transformation via packaging. Our findings confirm the role of product perishability in agricultural price volatility transmission.
The first contribution of this paper is to extend the flourishing literature on cross-market volatility transmission of agricultural commodity prices. Even though a growing number of studies (e.g., Abdallah et al., Citation2020; Chavas & Pan, Citation2020; An et al., Citation2016; Serra, Citation2015; Buguk et al., Citation2003) explore price volatility transmission patterns along the agricultural market chain, little research has examined the volatility transmission between wholesale and retail stages, which is a key component of the price adjustment process affecting upstream production and downstream (Tomek & Kaiser, Citation2014). Our work improves this research gap by using distinct data from the three-stage market chain.
In addition, our study reinforces previous findings (e.g., Ferrer-Pérez & Gracia-de-Rentería, Citation2020; Hassouneh et al., Citation2017; Assefa et al., Citation2015) using daily prices that better reflect the short-term price adjustment. Due to data limitations, much of the current literature on price volatility transmission adopts price data at the monthly and weekly levels. However, using these low-frequency data may not accurately capture the characteristics of price volatility since the price adjustment of agricultural products often occurs within days (Meyer & Cramon-Taubadel, Citation2004; Boyd & Brorsen, Citation1988). By contrast, the data used in our paper contain detailed daily prices from farm, wholesale, and retail markets, which substantially improve the precision of estimation results.
Second, we contribute to the burgeoning literature on contextual factors of price volatility transmission, which is important in designing policies and management strategies aimed at minimizing volatility risks. Previous studies have documented the roles of market power (Assefa et al., Citation2017; Rezitis, Citation2012; Serra, Citation2011), contracts (Apergis & Rezitis, Citation2003), and production nature (Khiyavi et al., Citation2012; Alexandri, Citation2011) in agricultural price volatility transmission. However, product perishability is ignored in the existing literature (Assefa et al., Citation2015), although this characteristic has been widely discussed in asymmetric price transmission studies (e.g., Zheng et al., Citation2020; Santeramo & von Cramon-Taubadel, Citation2016; Ahn & Lee, Citation2015; Ward, Citation1982). In this study, we compare price volatility transmissions for heterogeneous products that differ in the intensity of product perishability. Our findings suggest that the degree of price volatility transmission tends to be lower in the agricultural product with lower product perishability. To the best of our knowledge, this is the first study to provide empirical evidence on the role of product perishability in price volatility transmission along the three-stage agricultural market chain.
Third, this study also contributes to the existing literature on volatility transmissions of agricultural commodity prices in developing countries. Notably, the volatility transmission patterns may differ across countries due to differences in institutional and economic development. While much of the current literature has investigated developed countries that are capable of large-scale production with advanced technologies and efficient business operations, such as Germany (Assefa et al., Citation2017) and the United States (Buguk et al., Citation2003), limited studies examine developing countries with the characteristics of decentralized smallholder economy. Our findings provide new evidence from China to this strand of the empirical literature. Moreover, we contribute to the literature on price volatility dynamics in China’s agricultural commodity markets (e.g., Chavas & Pan, Citation2020; Tan & Zeng, Citation2019; Zhou & Koemle, Citation2015). The recent study (Zheng et al., Citation2020) close to our work examines litchi price transmission at the mean level between farm and retail markets. We differ from this research by focusing on the price transmission at the volatility level along the three-stage market chain of litchis and apples.
The rest of the paper is organized as follows. Section 2 discusses the methodology. Section 3 introduces the background and data. Section 4 presents empirical findings. Section 5 concludes the paper.
2. Methodology
To investigate price volatility transmission along the agricultural market chain, this subsection introduces the MGARCH models with the CCC, DCC, and BEKK specifications. We adopt the CCC- and DCC-MGARCH models to examine volatility correlations. Further, we estimate the BEKK-MGARCH model and derive the VIRF to examine the direction and magnitude of cross-market volatility transmission.
2.1. MGARCH FAMILY models
Following the existing literature (Gardebroek et al., Citation2016; Gardebroek & Hernandez, Citation2013), we specify a vector stochastic process as follows:
(1)
(1)
where rt is a 3 × 1 vector of price returns for farm, wholesale, and retail markets at time t. The price return is defined as the first difference of logarithmic prices. δ0 is a 3 × 1 vector of constants and δi is a 3 × 3 matrix of parameters measuring own and cross lead-lag price relationships between markets. p is the lag length.
is a 3 × 1 vector of errors with zero mean, conditional on previous information Ωt − 1 and conditional variance-covariance matrix Mt = [μijt], i, j = 1, …, 3. μijt is the conditional covariance of rt between market i and market j at time t. The conditional variance-covariance matrix Mt in the CCC-MGARCH model is expressed as:
(2)
(2)
where R is a 3 × 3 matrix whose element ρij measures the constant conditional correlation between market i and market j. Dt is a 3 × 3 diagonal matrix with the square root of the conditional variance
i = 1, …, 3, that follows a GARCH (1,1) specification, i.e., μiit = ωi + βi
+ γiμiit − 1. ωi measures the constant conditional variance for market i. Subsequently, we adopt the MGARCH model with the DCC specification that allows the conditional correlations ρij to vary across time. The conditional variance-covariance matrix Mt in the DCC-MGARCH model is given as:
(3)
(3)
where Rt = [ρijt] = diag(Qt)−1/2Qtdiag(Qt)−1/2. In particular, ρijt is the element of the 3 × 3 matrix of Rt capturing time-varying conditional correlations between market i and market j. The symmetric positive-definite matrix
where
is the 3 × 3 unconditional variance matrix of
and
=
/
Additionally, coefficients
and
are nonnegative parameters satisfying
+
<1. The conditional variance-covariance matrix Mt in the BEKK-MGARCH model is as follows:
(4)
(4)
where C is a 3 × 3 lower triangular matrix of constants cij. G is a 3 × 3 matrix including the element gij that measures the volatility spillover from market i to market j. The element hij of the 3 × 3 coefficient matrix H captures the volatility persistence from market i to market j. These specifications ensure that covariance matrices are positive definite.
2.2. Volatility impulse response function
We further investigate price volatility transmission by adopting the VIRF that tracks the impact of an exogenous volatility shock in one market on price volatility in another market. The conventional specification of the impulse response function (IRF) may not be applicable in our analysis since we focus on the effects of shocks on conditional variance of price returns rather than the conditional mean. Therefore, we follow the existing literature (Yang & Karali, Citation2021; Hafner & Herwartz, Citation2006; Lin, Citation1997; Koop et al., Citation1996) to estimate the VIRF based on the BEKK-MGARCH model. The VIRF is defined as the expectation of volatility conditional on an initial shock and past information subtracted by the baseline expectation conditional on past information. The specification is given as:
(5)
(5)
where z0 represents an initial specific shock at time 0 and Vt(z0) measures a vector of the impact of shock components of z0 on the t-step ahead conditional variance-covariance matrix components. Mt denotes the 3 × 3 conditional variance-covariance matrix at time t. vech(.) is an operator that stacks the lower fraction of an N × N matrix into N × (N + 1)/2 dimensional vector. Thus, vech(Mt) is a 6 × 1 vector. It − 1 is previous information up to time t − 1. Notably, the VIRF differs from the conventional IRF in three ways. First, compared with a linear function used in the IRF, the VIRF specification is not a homogeneous function of any degree. Second, the VIRF is an even function of the initial shock instead of an odd function used in the conventional IRF. Third, the VIRF depends on previous information through the volatility state M0, while the IRF is not influenced by past information of the process.
3. Background and data
3.1. Background
Our study examines price volatility transmission by adopting China’s litchi and apple markets which are indispensable components of agricultural product markets and have important international influences.Footnote1 As shown in , China has been the world’s largest producer of litchis and apples in recent years. The production areas and volumes for two fruits are much larger than those in other major producing economies. Additionally, China is the leading exporter of litchis and apples in the world. suggests that China’s export in terms of volumes and amounts are the largest among the major producing economies.
Table 1. Summary statistics.
Table 2. Pearson correlation coefficient.
Moreover, litchi and apple markets in China exist in a relatively loose policy environment. Due to national food safety, the Chinese government tends to provide more policy support and restrictions on major agricultural commodities (e.g., wheat and rice), while the fruits, such as litchis and apples, receive relatively less government attention. This market environment helps reduce the complexity of economic modelling because market dynamics can be sensitive to particular policy scenarios (Mehta & Chavas, Citation2008). Furthermore, the litchis and apples we examine have large differences in the degree of product perishability. While litchi is a typical subtropical fruit grown in areas from 17 to 26 degrees latitude in the Southern and Northern Hemispheres, apple is a temperate fruit that originated in Europe, Central Asia, and China. Under ambient temperatures, litchis rot rapidly within three days after harvest, but apples can stay fresh for thirty days.Footnote2 This product characteristic allows us to compare price volatility transmissions in different perishable agricultural products.
3.2. Data
The data used in this study come from two sources. First, litchi market prices are from the national litchi industry survey of the Modern Litchi and Longan Industrial Technology System of China operated by South China Agricultural University.Footnote3 This is the first and largest litchi survey in China, which is conducted in 20 cities across 14 provinces (See for the details). Due to planting cycles and seasonal characteristics, litchi data are available during harvest seasons from May to July in each survey year. Thus, the resulting sample consists of 335 observations from 17 May 2012 to 22 July 2016. Second, apple market prices are from the agriculture product database of the Bric Global Agricultural Consulting Company,Footnote4 which are widely used in previous studies on China’s agricultural markets (e.g., Guo et al., Citation2021; Jiang et al., Citation2019; Li & Xiong, Citation2019). Due to the data availability, the sample consists of 1271 observations from 4 April 2016 to 26 September 2019.
Table 3. Unit root tests.
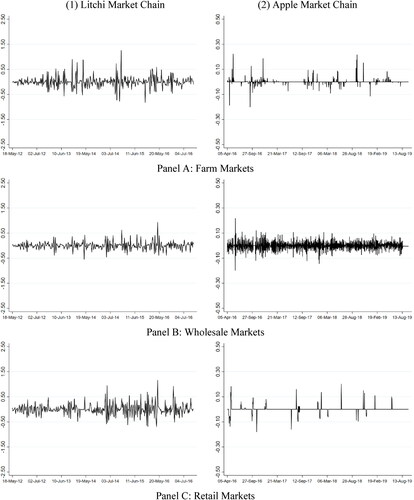
reports summary statistics of price levels and price returns. In panel A, farm, wholesale, and retail prices in litchi markets are on average much larger than those in apple markets, respectively. We find similar patterns for price returns in panel B as well. The trends of price returns are reported in . We further conduct a Pearson correlation analysis to examine price correlations. Panel A of suggests strong correlations of price levels along market chains of litchis and apples. In panel B, correlations of price returns remain statistically significant along the litchi market chain, but we find no evidence of significant price return correlations along the apple market chain. Before presenting the results for price volatility transmission, we conduct unit-root tests to examine whether price returns follow the stationary process. In , the Dickey-Fuller test, the Augmented Dickey-Fuller test, and the Phillips Perron test indicate that test statistics in all columns are significant at the 1% level, thereby rejecting the null hypotheses of unit roots in price returns.
Figure 1. The trends of price returns. Sources: Litchi data are from the national litchi industry survey of the Modern Litchi and Longan Industrial Technology System of China. Apple data are from the agriculture product database of the Bric Global Agricultural Consulting Company.
4. Empirical findings
4.1. Volatility correlation analysis
4.1.1. CCC-MGARCH estimation results
In , we estimate the MGARCH model with the CCC specification. Columns (1)–(3) of panels A and B report the CCC-MAGRCH estimation results for farm, wholesale, and retail stages in litchi and apple market chains, respectively. The correlation analysis on the litchi market chain in panel A indicates that ρYf,Yw and ρYw,Yr are positive and statistically significant at the 1% level, suggesting that price volatility are positively correlated between farm and wholesale stages and between wholesale and retail stages. In particular, the coefficient magnitude of wholesale-retail volatility correlation (0.4847) is much larger than the one of farm-wholesale volatility correlation (0.2498). We find little evidence of the volatility correlation between farm and retail stages in the litchi market chain.
Table 4. CCC-MGARCH estimates.
In panel B, correlation results on the apple market chain show that ρYf,Yw is positive and statistically significant at the 5% level. It suggests a positive correlation of price volatility between farm and wholesale stages. On the contrary, ρYf,Yr is found to be negative and statistically significant at the 5% level, implying the negative correlation between farm and retail stages. No significant result is found on the volatility correlation between wholesale and retail stages. It is worth noting that the magnitudes of correlation coefficients ρYf,Yw (0.045) and ρYf,Yr (−0.0512) in the apple market chain are much smaller than those of ρYf,Yw and ρYw,Yr in the litchi market chain.
In summary, we obtain two important findings from the CCC-MGARCH analysis. First, we confirm the existence of price volatility linkages at specific stages along the litchi and apple market chains. Second, we find that price volatility interdependence is much stronger in the litchi market chain than in the apple market chain. This result is consistent with the view of the previous studies (e.g., Santeramo & von Cramon-Taubadel, Citation2016; Ward, Citation1982) that product perishability influences the vertical price adjustment. Price volatility correlations tend to be strong for products requiring a minimal transformation via packing. Since litchis have relatively higher product perishability than apples, the degree of price volatility correlation is reasonably stronger in the litchi market chain.
4.1.2. DCC-MGARCH estimation results
The limitation of the MGARCH model with the CCC specification is that the conditional correlation coefficient is assumed to be constant over time. To address this concern, we adopt the MGARCH model with the DCC specification that allows volatility correlation coefficients to vary across time.
Panel A of suggests the daily volatility correlation results for the litchi market chain. We find substantial variations of volatility correlation coefficients between farm and wholesale stages and between wholesale and retail stages. While farm-wholesale volatility correlation coefficients vary from −0.1714 to 0.6363, the wholesale-retail volatility correlation coefficients vary from 0.0595 to 0.8269. On average, the magnitudes of farm-wholesale volatility correlation coefficients tend to be larger than those of wholesale-retail volatility correlation coefficients. In addition, we find that the farm-retail volatility correlation coefficients have relatively small variations from −0.0212 to 0.121. Panel B shows the daily volatility correlation results for the apple market chain. More than 95% of farm-wholesale volatility correlation coefficients are in the interval between −0.1 and 0.1. We find similar patterns for wholesale-retail and farm-retail volatility correlation coefficients. On average, wholesale-retail volatility correlation coefficients are largely centred at zero, while farm-retail volatility correlation coefficients tend to vary around −0.029.
Figure 2. DCC-MGARCH estimates. Sources: Litchi data are from the national litchi industry survey of the Modern Litchi and Longan Industrial Technology System of China. Apple data are from the agriculture product database of the Bric Global Agricultural Consulting Company.
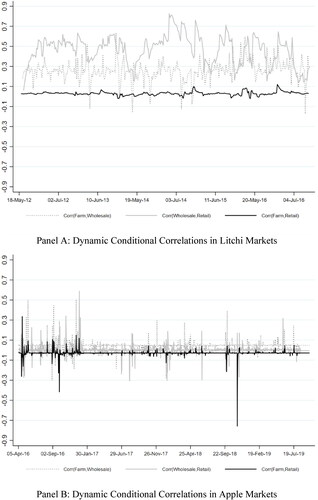
Dynamic correlation results from the DCC-MGARCH model are consistent with static correlation results from the MARCH model with the CCC specification. Specifically, we reconfirm the existence of price volatility transmission between farm and wholesale stages and between wholesale and retail stages along the litchi market chain. However, we find weak evidence of price volatility transmission in the apple market chain. To sum up, these findings further provide supportive evidence that the degree of price volatility transmission is strong for the high perishability product.
4.2. Volatility transmission analysis
4.2.1. Bekk-MGARCH estimation results
Although the results from the MGARCH models with CCC and DCC specifications document the existence of price volatility correlation at specific stages along market chains, it is unclear about the direction and magnitude of price volatility transmission. In this subsection, we further adopt the MGARCH model with the BEKK specification to estimate cross-market volatility spillover and persistence effects along the litchi and apple market chains.
Panel A of reports results from conditional variance-covariance equations. The off-diagonal coefficients gij and hij measure cross-market volatility spillovers and persistence from market i to market j, respectively. We initially investigate the litchi market chain in the first three columns. Column (1) indicates that coefficient estimates g21 and h31 are statistically significant. This evidence suggests the presence of cross volatility spillover from the litchi wholesale market to the litchi farm market and cross volatility persistence from the litchi retail market to the litchi farm market.
Table 5. BEKK-MGARCH estimates.
The results in column (2) indicate that all off-diagonal coefficient estimates are statistically significant, thereby implying cross volatility spillovers and persistence from the litchi farm and retail markets to the litchi wholesale market. Column (3) shows that coefficient estimates g13 and g23 are only statistically significant, which means the existence of cross-market volatility spillovers from the litchi farm and wholesale markets to the litchi retail market.
We further examine the apple market chain in the last three columns. The results in columns (4)–(6) indicate that all off-diagonal coefficient estimates are statistically significant except coefficient h32, suggesting the presence of cross-market volatility spillovers and persistence among apple market stages. In panel B, we conduct the Wald restriction tests to examine whether the coefficient estimates gij and hij are statistically different from zero. The test results reject all null hypotheses that cross volatility effects are jointly equal to zero with the 99 percent confidence level.
4.2.2. Volatility impulse response function
In this subsection, we follow previous studies (Gardebroek et al., Citation2016; Hernandez et al., Citation2014; Gardebroek & Hernandez, Citation2013) to adopt the VIRF to investigate the response of price volatility in one market to a price volatility shock in another market from a dynamic perspective. The price volatility data are obtained from the BEKK-MGARCH model discussed in Section 4.2.1.
Panel A of shows the responses of wholesale and retail price volatilities to one standard deviation shock in farm price volatility. In the litchi market, we find that a farm price volatility shock has a small but positive impact on the retail price volatility. Its response grows to 0.005 with small fluctuation in the first five days and gradually decreases to zero after two weeks. However, we find little response of wholesale price volatility to farm price volatility. Similarly, the results in the apple market suggest little response of wholesale and retail price volatility to the farm price volatility shock.
Figure 3. Volatility impulse response results. Notes: Each figure presents results for the response of price volatility in one market stage to a price volatility shock (one-standard deviation) in another market stage. The optimal lag length is determined by the AIC’s minimum value.
Sources: Litchi data are from the national litchi industry survey of the Modern Litchi and Longan Industrial Technology System of China. Apple data are from the agriculture product database of the Bric Global Agricultural Consulting Company.
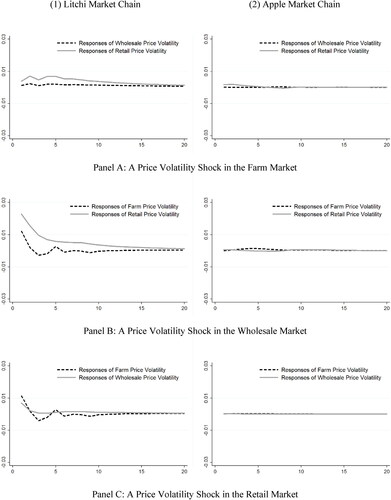
In panel B, we estimate the effects of wholesale price volatility shocks on responses of farm and retail price volatility. The results in the litchi market suggest that farm and retail price volatility are positively affected by the wholesale price volatility shock. Both responses jump to the maximum values (0.022 and 0.012) on the first day and decline rapidly in the subsequent periods. However, in the apple market, we find little evidence that the wholesale price volatility shock significantly influences responses of farm and retail price volatility.
Panel C indicates the responses of farm and wholesale price volatility to one standard deviation shock in retail price volatility. In the litchi market, we find that responses of farm and wholesale price volatility reach the maximum values on the first day. While the response of wholesale price volatility drops rapidly to zero after two days, the response of farm price volatility decreases with small fluctuations and dies away after two weeks. There is little response of farm and wholesale price volatilities to the retail price volatility shock in the apple market.
To sum up, we obtain several important findings from the VIRF analysis. First of all, responses to cross-market price volatility shocks are stronger in the litchi market chain than in the apple market chain. This evidence is consistent with the volatility correlation results from the CCC- and DCC-MGARCH models. Since litchis are more difficult to pack and store than apples, litchi market participants are less able to smooth price volatility shocks by changing the quantity strategy, thereby making more pronounced volatility transmission along the market chain. Moreover, the litchi wholesale and retail markets have higher volatility spillover effects on the farm market than vice versa.
Our findings are consistent with the existing literature (e.g., Zheng et al., Citation2020) that the litchi farmers have small bargaining powers on price setting with other market participants in China. Further, we find suggestive evidence that wholesalers play a dominant role in price volatility transmission along the litchi market chain. Due to costs caused by product perishability, information search, and transportation, most litchi farmers in China prefer door-to-door purchases from wholesalers instead of signing direct contracts with retailers. Thus, wholesales are likely to have stronger market powers that affect price volatility transmission than farmers and retailers in litchi markets.
5. Conclusion
Understanding price volatility transmission is important for designing effective mechanisms to improve agricultural market efficiency. Although empirical evidence is accumulating, the existing literature pays little attention to how price volatility is transmitted between wholesale and retail stages and the role of product perishability in price volatility transmission. Our study fills these research gaps by adopting high-frequency data on the three-stage market chain of litchis and apples in China. We adopt the MGARCH models with CCC and DCC specifications to investigate volatility correlations across chain stages. Furthermore, we use the BEKK-MGARCH model and volatility impulse response analysis to explore price volatility transmission. Our results indicate that price volatility transmission is much stronger in the litchi market chain than in the apple market chain. In particular, the litchi wholesale and retail markets have larger volatility spillover effects on the farm market. By contrast, we find weak evidence of price volatility transmission along the apple market chain.
Our findings bring several important implications for China’s agricultural commodity markets. To decrease the role of product perishability in price volatility transmission, the government could provide subsidies to help farmers build cold chain logistics facilities that extend product freshness. Additionally, the government should further strengthen financial incentives for research and development to improve product perishability. Our findings also have valuable implications for agricultural markets in other countries or regions which are characterized by the decentralized smallholder economy and the underdeveloped cold chain system. We shed light on how product perishability is related to the characteristics of price volatility transmission.
Future research could explore the following issues. For example, it is valuable to extend the coverage of products (e.g., dairy, vegetables, fruits, and seeds) and countries (e.g., newly emerging countries and low-income countries) for the existing literature. Do they differ in price volatility transmission across farm, wholesale, and retail stages? Besides, the adoption of high-quality data, such as long period daily prices, helps improve the estimation precision. Finally, it is necessary to explicitly investigate the impact of product perishability on price volatility transmission and explore other possible contextual factors.
Acknowledgements
We are grateful to the editor and four anonymous reviewers for their insightful comments and suggestions. All remaining errors are solely our own.
Additional information
Funding
Notes
1 Without specific mentions, China in our study mainly refers to Mainland China, excluding Taiwan Province (China), Hongkong (China), and Macau (China).
2 After the adoption of modern preservation technologies, litchi and apple can keep fresh for a month and six months, respectively.
3 This system was established in 2008, which had 3 laboratories under the R&D center and 12 comprehensive test stations. The major functions of the system include (1) studying, integrating, and demonstrating common and key technologies around the needs of industrial development; (2) collecting and analyzing information about the development of the industry and associated technologies; (3) providing public policy consultations, and user-level technical demonstration and information services.
References
- Abdallah, M. B., Farkas, M. F., & Lakner, Z. (2020). Analysis of meat price volatility and volatility spillovers in Finland. Agricultural Economics, 66(2), 84–91.
- Abdelradi, F., & Serra, T. (2015). Asymmetric price volatility transmission between food and energy markets: The case of Spain. Agricultural Economics, 46(4), 503–513. https://doi.org/10.1111/agec.12177
- Ahn, B. I., & Lee, H. (2015). Vertical price transmission of perishable products: The case of fresh fruits in the western united states. Journal of Agricultural and Resource Economics, 40(3), 405–424.
- Alexandri, C. (2011). Analysis of price transmission along the agri-food chains in Romania. Agricultural Economics and Rural Development, 8(2), 171–189.
- An, H., Qiu, F., & Zheng, Y. (2016). How do export controls affect price transmission and volatility spillovers in the Ukrainian wheat and flour markets? Food Policy. 62, 142–150. https://doi.org/10.1016/j.foodpol.2016.06.002
- Apergis, N., & Rezitis, A. (2003). Agricultural price volatility spillover effects: The case of Greece. European Review of Agricultural Economics, 30(3), 389–406. https://doi.org/10.1093/erae/30.3.389
- Assefa, T. T., Meuwissen, M. P., & Oude Lansink, A. G. (2015). Price volatility transmission in food supply chains: A literature review. Agribusiness, 31(1), 3–13. https://doi.org/10.1002/agr.21380
- Assefa, T. T., Meuwissen, M. P., Gardebroek, C., & Oude Lansink, A. G. (2017). Price and volatility transmission and market power in the German fresh pork supply chain. Journal of Agricultural Economics, 68(3), 861–880. https://doi.org/10.1111/1477-9552.12220
- Bakucs, Z., Fałkowski, J., & Fertő, I. (2014). Does market structure influence price transmission in the agro‐food sector? A meta‐analysis perspective. Journal of Agricultural Economics, 65(1), 1–25. https://doi.org/10.1111/1477-9552.12042
- Boyd, C. M., & Bellemare, M. F. (2020). The microeconomics of agricultural price risk. Annual Review of Resource Economics, 12(1), 149–169. https://doi.org/10.1146/annurev-resource-100518-093807
- Boyd, M. S., & Brorsen, B. W. (1988). Price asymmetry in the US pork marketing channel. North Central Journal of Agricultural Economics, 10(1), 103–109. https://doi.org/10.2307/1349239
- Buguk, C., Hudson, D., & Hanson, T. (2003). Price volatility spillover in agricultural markets: An examination of US catfish markets. Journal of Agricultural and Resource Economics, 28(1), 86–99.
- Chavas, J. P., & Pan, F. (2020). The dynamics and volatility of prices in a vertical sector. American Journal of Agricultural Economics, 102(1), 353–369. https://doi.org/10.1093/ajae/aaz038
- Ferrer-Pérez, H., & Gracia-de-Rentería, P. (2020). Asymmetric price volatility transmission in the Spanish fresh wild fish supply chain. Marine Resource Economics, 35(1), 65–81. https://doi.org/10.1086/707786
- Fousekis, P., Katrakilidis, C., & Trachanas, E. (2016). Vertical price transmission in the US beef sector: Evidence from the nonlinear ARDL model. Economic Modelling, 52, 499–506. https://doi.org/10.1016/j.econmod.2015.09.030
- Frey, G., & Manera, M. (2007). Econometric models of asymmetric price transmission. Journal of Economic Surveys, 21(2), 349–415. https://doi.org/10.1111/j.1467-6419.2007.00507.x
- Gardebroek, C., & Hernandez, M. A. (2013). Do energy prices stimulate food price volatility? Examining volatility transmission between US oil, ethanol and corn markets. Energy Economics, 40, 119–129. https://doi.org/10.1016/j.eneco.2013.06.013
- Gardebroek, C., Hernandez, M. A., & Robles, M. (2016). Market interdependence and volatility transmission among major crops. Agricultural Economics, 47(2), 141–155. https://doi.org/10.1111/agec.12184
- Guo, Y., Hu, X., Wang, Z., Tang, W., Liu, D., Luo, Y., & Xu, H. (2021). The butterfly effect in the price of agricultural products: A multidimensional spatial-temporal association mining. Agricultural Economics, 67(11), 457–467.
- Hafner, C. M., & Herwartz, H. (2006). Volatility impulse responses for multivariate GARCH models: An exchange rate illustration. Journal of International Money and Finance, 25(5), 719–740. https://doi.org/10.1016/j.jimonfin.2006.04.006
- Hassouneh, I., Serra, T., Bojnec, Š., & Gil, J. M. (2017). Modelling price transmission and volatility spillover in the Slovenian wheat market. Applied Economics, 49(41), 4116–4126. https://doi.org/10.1080/00036846.2016.1276273
- Hernandez, M. A., Ibarra, R., & Trupkin, D. R. (2014). How far do shocks move across borders? Examining volatility transmission in major agricultural futures markets. European Review of Agricultural Economics, 41(2), 301–325. https://doi.org/10.1093/erae/jbt020
- Jiang, H., Todorova, N., Roca, E., & Su, J. J. (2019). Agricultural commodity futures trading based on cross-country rolling quantile return signals. Quantitative Finance, 19(8), 1373–1390. https://doi.org/10.1080/14697688.2019.1571682
- Khan, M. A., & Helmers, G. A. (1997). Causality, input price variability, and structural changes in the US livestock-meat industry [Paper presentation]. Paper Submitted to Western Agricultural Economics Association Meeting, Reno, Nevada.
- Khiyavi, P. K., Moghaddasi, R., Eskandarpur, B., & Mousavi, N. (2012). Spillover effects of agricultural products price volatilities in Iran (Case Study: Poultry Market). Journal of Basic and Applied Scientific Research, 2(8), 7906–7914.
- Koop, G., Pesaran, M. H., & Potter, S. M. (1996). Impulse response analysis in nonlinear multivariate models. Journal of Econometrics, 74(1), 119–147. https://doi.org/10.1016/0304-4076(95)01753-4
- Li, M., & Xiong, T. (2019). Do bubbles alter contributions to price discovery? Evidence from the Chinese soybean futures and spot markets. Emerging Markets Finance and Trade, 55(15), 3417–3432. https://doi.org/10.1080/1540496X.2019.1608178
- Lin, W. L. (1997). Impulse response function for conditional volatility in GARCH models. Journal of Business and Economic Statistics, 15(1), 15–25.
- Liu, Y., Chen, X., & Rabinowitz, A. N. (2019). The role of retail market power and state regulations in the heterogeneity of farm‐retail price transmission of private label and branded products. Agricultural Economics, 50(1), 91–99. https://doi.org/10.1111/agec.12468
- Lloyd, T. (2017). Forty years of price transmission research in the food industry: Insights, challenges and prospects. Journal of Agricultural Economics, 68(1), 3–21. https://doi.org/10.1111/1477-9552.12205
- Mehta, A., & Chavas, J. P. (2008). Responding to the coffee crisis: What can we learn from price dynamics? Journal of Development Economics, 85(1-2), 282–311. https://doi.org/10.1016/j.jdeveco.2006.07.006
- Meyer, J., & Cramon-Taubadel, S. (2004). Asymmetric price transmission: A survey. Journal of Agricultural Economics, 55(3), 581–611. https://doi.org/10.1111/j.1477-9552.2004.tb00116.x
- Natcher, W. C., & Weaver, R. D. (1999). The transmission of price volatility in the beef markets: A multivariate approach [Paper presentation]. Annual Meeting of the American Agricultural Economics Association, Nashville, Tennessee.
- Rezitis, A. (2003). Mean and volatility spillover effects in Greek producer-consumer meat prices. Applied Economics Letters, 10(6), 381–384. https://doi.org/10.1080/1350485032000081299
- Rezitis, A. N. (2012). Modelling and decomposing price volatility in the Greek meat market. International Journal of Computational Economics and Econometrics, 2(3/4), 197–222. https://doi.org/10.1504/IJCEE.2012.053321
- Rezitis, A. N., & Stavropoulos, K. S. (2011). Price volatility and rational expectations in a sectoral framework commodity model: A multivariate GARCH approach. Agricultural Economics, 42(3), 419–435. https://doi.org/10.1111/j.1574-0862.2010.00521.x
- Santeramo, F. G., & von Cramon-Taubadel, S. (2016). On perishability and vertical price transmission: Empirical evidences from Italy. Bio-Based and Applied Economics Journal, 5(2), 199–214.
- Serra, T. (2011). Food scare crises and price volatility: The case of the BSE in Spain. Food Policy. 36(2), 179–185. https://doi.org/10.1016/j.foodpol.2010.11.006
- Serra, T. (2015). Price volatility in Niger millet markets. Agricultural Economics, 46(4), 489–502. https://doi.org/10.1111/agec.12176
- Shrinivas, A., & Gómez, M. I. (2016). Price transmission, asymmetric adjustment and threshold effects in the cotton supply chain: A case study for Vidarbha, India. Agricultural Economics, 47(4), 435–444. https://doi.org/10.1111/agec.12242
- Tan, Y., & Zeng, H. (2019). Price transmission, reserve regulation and price volatility. China Agricultural Economic Review, 11(2), 355–372. https://doi.org/10.1108/CAER-04-2017-0062
- Tomek, W. G., & Kaiser, H. M. (2014). Agricultural product prices. Cornell University Press.
- Uchezuba, I. D., Jooste, A., & Willemse, J. (2010). Measuring asymmetric price and volatility spillover in the South African broiler market [Paper presentation]. 2010 AAAE Third Conference/AEASA 48th Conference, Cape Town, South Africa.
- Ward, R. W. (1982). Asymmetry in retail, wholesale, and shipping point pricing for fresh vegetables. American Journal of Agricultural Economics, 64(2), 205–212. https://doi.org/10.2307/1241124
- Yang, Y., & Karali, B. (2021). How far is too far for volatility transmission? Journal of Commodity Markets, 26, 100198.
- Zheng, X., & Pan, Z. (2022). Responding to import surges: Price transmission from international to local soybean markets. International Review of Economics & Finance, 82, 584–597. https://doi.org/10.1016/j.iref.2022.07.001
- Zheng, X., Pan, Z., & Zhuang, L. (2020). Price volatility and price transmission in perishable commodity markets: Evidence from Chinese lychee markets. Applied Economics Letters, 27(9), 748–752. https://doi.org/10.1080/13504851.2019.1644444
- Zhou, D., & Koemle, D. (2015). Price transmission in hog and feed markets of China. Journal of Integrative Agriculture, 14(6), 1122–1129. https://doi.org/10.1016/S2095-3119(14)60995-3