
 ?Mathematical formulae have been encoded as MathML and are displayed in this HTML version using MathJax in order to improve their display. Uncheck the box to turn MathJax off. This feature requires Javascript. Click on a formula to zoom.
Abstract
The effective identification of systemically important financial institutions (SIFIs) is key to preventing and resolving systemic financial risks; thus, it is of great research significance for emerging countries to supervise SIFIs and manage systemic financial risks. Since traditional research on identifying SIFIs does not consider emerging machine learning models, it is difficult to properly fit the characteristics of actual financial institutions’ asset distribution. This paper proposes a new method for measuring SIFIs, integrating the PSO-SVM model into the Copula-CoVaR model. This new PSO-SVM-Copula-CoVaR model is meant to evaluate China’s SIFIs based on the publicly traded price data of Chinese listed financial institutions. The empirical results show that, compared with the traditional parameter method (GARCH model) and the nonparametric method (kernel density estimation), the marginal distribution estimation method using the PSO-SVM method can better fit the distribution of an institution’s financial asset return sequence. That is, the model proposed in this paper helps regulatory authorities improve the list of SIFIs more reasonably and implement effective regulatory measures.
1. Introduction
The global financial crisis of 2008 demonstrated that, when SIFIs get into trouble or go bankrupt, the whole financial system suffers great damage due to the spillover effect, which may eventually lead to a serious economic crisis (Fan et al., Citation2018; Johnson & Mamun, Citation2012; Zhang et al., Citation2021). Thus the effective identification of SIFIs is key for regulators hoping to deal with the systemic risks of the financial system (Chen et al., Citation2021).
As of now, this paper is one of the few studies that attempting to introduce machine learning models into the identification of SIFIs. The main identification methods of SIFIs relevant in this task are the indicator-based approach and the market-based approach (Li et al., Citation2021; Xu, Citation2011). The indicator-based approach involves constructing a corresponding index system to evaluate the importance of financial institutions based on the core concepts of SIFIs.
The market-based approach measures a single financial institution’s risk contribution to the whole system based on financial market data, determining its systemic importance; compared with the indicator-based approach’s index method, it can effectively overcome the problem of data lag and improve the accuracy of measuring institutional spillover risk. Among this series of market model methods, the CoVaR method, which considers the spillover effects of financial institutions, has received widespread attention (Bernal et al., Citation2014).
However, CoVaR is essentially a linear correlation function between returns, and there has yet to be discussion of the specific dependency structure, which has some drawbacks when it comes to describing the tail risk dependency (Benoit et al., Citation2013; Kleinow et al., Citation2014; López-Espinosa et al., Citation2012). Considering the complex structure of interdependence between financial institutions, scholars have introduced different copula functions to capture the linear and non-linear tail-related characteristics of such institutions and the entire financial system (Bernardi et al., Citation2017; Jaeger-Ambrozewicz, Citation2013; Liu, Citation2015)
The main difference between the indicator-based approach and the market-based approach lies in their perspective for understanding the meaning of systemically important financial institutions and their related data. Although it is intuitive and simple to measure SIFIs with an indicator-based approach (Lu & Hu, Citation2014), such an approach needs more comprehensive data (Brämer & Gischer, Citation2013); additionally, the frequency of statistical data involved is usually low, so it is difficult to capture the changing characteristics of high-frequency data. As a result, the dynamic spillover effect of systemic risk is not considered. Compared with the indicator-based approach, the market-based approach is more forward-looking because it can adopt higher frequency data.
In summary, the market-based approach based on publicly traded data is more suitable for the identification of systematic financial institutions, and the CoVaR model combined with the copula function has the advantage of portraying the dependence of tail risk (Sun et al., Citation2020; Wu et al., Citation2021).
Despite this approach’s suitability, the existing research still has several shortcomings. Firstly, with the development and complexity of the financial market, the traditional marginal distribution model based on parametric and nonparametric methods has difficulty fitting the distribution characteristics of actual financial assets. Secondly, while the rapidly internationalized and liberalized Chinese stock market is becoming increasingly important for global financial markets (Yao et al., Citation2018; Zhang, Citation2017), few studies have explored China’s financial markets. Finally, with the asset structure of China’s financial market changing, it is difficult to properly conduct financial stability supervision by focusing only on the banking market.
Compared with traditional statistical or simulation methods, machine learning can optimize loss or return functions by using historical data, which can better quantify the complex and changeable characteristics of financial risks. Among the available frameworks, support vector machine (SVM) is a theoretical framework and general method for establishing machine learning with limited samples (Dutta, Citation2022; Luo et al., Citation2020; Vapnik, Citation1995, Citation1998). Not only does SVM have a strict theoretical basis, it can better solve practical problems (e.g., small sample, nonlinearity, high dimension and local minimum point) (Kim, Citation2003; Lee, Citation2007). This paper introduces SVM to model the edge distribution.
Therefore, this paper endeavors to make up for the deficiencies in the existing research and to make a more accurate and reasonable evaluation of China’s SIFIs, based on the publicly traded price data of 27 listed financial institutions in China’s capital market from January 2011 to March 2021. To do so, this paper constructs a new PSO-SVM-Copula-CoVaR model for research. Firstly, the PSO-SVM model, which is optimized by the particle swarm optimization algorithm (PSO) (Eberhart & Kennedy, Citation1995), is used to model the edge distribution of stock price data, and the estimation results are compared with the traditional edge distribution modeling estimation methods (such as the GARCH model and kernel density estimation). Secondly, the Copula-CoVaR function is used to describe the multivariate distribution and tail-dependent risks of financial variables completing the risk assessment of systemically important financial institutions. The results show that the risk estimation model incorporating the PSO-SVM algorithm can effectively improve the accuracy of SIFI recognition.
This paper contributes by filling the gaps in the existing literature on the identification of systemically important financial institutions, introducing machine learning algorithm into the traditional Copula-CoVaR model, and exploring the application of machine learning algorithms in the field of financial risk management. In addition, most existing studies are focused on the banking sector, and few have explored the identification of systemically important financial institutions in China’s financial market. The research in this paper provides a unique reference for financial market risk research in emerging countries.
The remaining parts of this paper are arranged as follows: Section 2 is a review of the current literature. Section 3 briefly introduces the sub-models that constitute the PSO-SVM-Copula-CoVaR model and the specific steps for constructing the PSO-SVM-Copula-CoVaR model. Section 4 conducts an empirical analysis based on the actual data of China’s financial market. Section 5 is the conclusion of this paper.
2. Literature review
This part reviews the existing literature on the identification of SIFIs by focusing on three aspects: indicator-based approach, market-based model approach, and Copula-CoVaR method.
Research on the indicator-based approach has shown that the index system for identifying global systemically important financial institutions (G-SIFIs) used by the Financial Stability Board (FSB) considers cross-border transaction activities, business scale, relevance, substitutability, and complexity. Lo (Citation2009) analyzed the systemic risks of institutions based on factors such as business concentration, financial leverage, relevance, risk sensitivity, and closeness between institutions. Billio et al. (Citation2012) used the Granger causality test to establish a financial network based on the stock price data of major financial institutions around the world; they then measured the systemic importance of financial institutions based on indicators such as transmittance and acceptance. Guo (Citation2013) ranked China’s systemically important banks based on different evaluation index systems used in China and internationally. Thomson (Citation2015) pointed out that assessing the importance of financial institutions should include factors such as scale, concentration, relevance, contagion, and environment.
The research into the market-based approach showed that studies commonly used market model methods including the Shapley value (Tarashev et al., Citation2009), systematic impact index (SII), vulnerability index (VI) (Zhou, Citation2010), conditional value at risk (CoVaR) (Adrian & Brunnermeier, Citation2009), marginal expected shortfall (MES) (Acharya et al., Citation2017), component expected shortfall (CES) (Banulescu & Dumitrescu, Citation2015), and SRISK (Banulescu-Radu et al., Citation2021; Brownlees & Engle, Citation2017).
Furthermore, in the research based on the Copula-CoVaR model, Karimalis and Nomikos (Citation2018) and Hakwa et al. (Citation2012) proposed a model to measure the contribution of marginal system risk based on the copula theory and the CoVaR method; this model not only characterizes the linear correlation between financial institutions and the entire financial system but also captures nonlinear tail correlation characteristics. Reboredo and Ugolini (Citation2015) and Boako and Alagidede (Citation2018) applied the Copula-CoVaR method to the European debt market and African stock market, respectively. Compared with other methods of estimating CoVaR (e.g., quantile regression, tail risk network, and multivariate GARCH model), the Copula-CoVaR method can estimate the dynamic and asymmetric tail correlation between data more flexibly (Bernardi et al., Citation2017; Mainik & Schaanning, Citation2014; Patton, Citation2006; Reboredo & Ugolini, Citation2015).
Furthermore, in the research based on the Copula-CoVaR model, Karimalis and Nomikos (Citation2018) and Hakwa et al. (Citation2012) proposed a model to measure the contribution of marginal system risk based on the copula theory and the CoVaR method; this model not only characterizes the linear correlation between financial institutions and the entire financial system but also captures nonlinear tail correlation characteristics. Reboredo and Ugolini (Citation2015) and Boako and Alagidede (Citation2018) applied the Copula-CoVaR method to the European debt market and African stock market, respectively. Compared with other methods of estimating CoVaR (e.g., quantile regression, tail risk network, and multivariate GARCH model), the Copula-CoVaR method can estimate the dynamic and asymmetric tail correlation between data more flexibly (Bernardi et al., Citation2017; Mainik & Schaanning, Citation2014; Patton, Citation2006; Reboredo & Ugolini, Citation2015).
3. Methodology
This section briefly describes the PSO-SVM model and Copula-CoVaR model that constitute the PSO-SVM-Copula-CoVaR model; it also, introduces the main steps for constructing the PSO-SVM-Copula-CoVaR model.
3.1. The PSO-SVM model
Determining edge distribution estimation is equivalent to solving the following integral equation:
(1)
(1)
This article uses independent and identically distributed data
to construct the following empirical distribution function::
(2)
(2)
At the same time, the boundary conditions (0,0), (1,1) are added to solve the problem of edge distribution by using a support vector machine.
The objectives for this paper are as follows: firstly, define the corresponding regression problem in image space. Secondly, construct the kernel function by using the support vector machine method. Thirdly, construct the cross kernel function
Fourthly, according to the kernel function
use the support vector method to solve the regression problem-that is, find out the support vector
and the corresponding coefficients
in which
is the desired edge distribution.
(3)
(3)
3.2. The Copula-CoVaR model
Firstly, is the value in the
quantile.
(4)
(4)
is defined as the
of institution
(or the financial system) under the condition that
when certain events occur in institution
is the value of the
quantile under the conditional probability distribution.
(5)
(5)
In Formula (5), and
are the returns sequence of sequence
and
respectively. The following is for solving
by analyzing the copula function.
(6)
(6)
According to Sklar’s theorem:
(7)
(7)
Based on Formula (7), can be obtained, and then:
(8)
(8)
Here,
and
are the marginal distributions of
and
respectively.
3.3. The PSO-SVM-Copula-CoVaR model
Based on the sub-model introduced above, this paper constructs a new PSO-SVM-Copula-CoVaR model to identify systemically important financial institutions in China. is a flowchart of the PSO-SVM-Copula-CoVaR model, which involves the following four main steps:
Figure 1. The flow chart of PSO-SVM-Copula-CoVaR model.
Source: Authors.
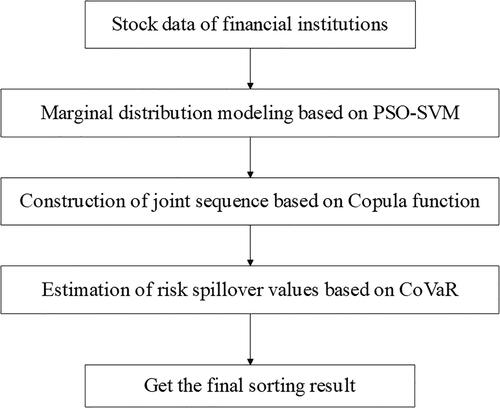
Step 1: Model the marginal distribution of the stock price data of financial institutions. The PSO-SVM marginal distribution estimation method of is used to model the marginal distribution of the stock price data of each listed financial institution, and the copula data of each financial institution is obtained through probability integral conversion.
Step 2: The union sequence of financial institution assets is constructed, and the union sequence
is obtained by using the definition of the copula function, where
Step 3: Estimate the risk spillover value of institution
Step 4: Sort the estimated CoVaR values of each financial institution to get the final result.
4 Empirical results
4.1. Data selection and basic analysis
In an efficient market, the roles, statuses, and interrelationships of institutions in the financial system can be fully reflected in the volatility and interrelationship patterns of returns in the stock market. At the same time, the daily return rates of stocks haves the beneficial characteristics of easy access and large sample size, which can better reflect the financial system’s real situation.
China’s financial institutions can be divided into four categories (i.e., banking, insurance, securities, and trust) according to their industries, among which banking and insurance are the two most important pillars. With the development of interest rate marketization, the traditional asset-liability business of commercial banks has been overtaken by increasingly diversified investment and financing channels; this also makes the business dealings among financial institutions in the system closer. Therefore, this paper uses 28 financial institutions as samples, choosing the daily stock return rate of each listed financial institution as its research object. The total sample is comprised of 16 banks and 12 insurance/securities/trust institutions.
In addition, considering the balance of the sample number (which covers more listed companies) and sample size (which accounts for a longer time interval), the sample time period is from January 4, 2011 to June 30, 2022, covering a total of 2,191 trading days. In this sample, the stock price rate of return
where
is the rate of return, and
is the closing price at time
The analysis data comes from Wind Information; R and Matlab software are used to process the data. shows the basic information of the selected financial institutions, and in Appendix A shows the results of the descriptive statistical analysis of the data.
Table 1. Basic information of financial institutions.
The results in in Appendix A show that the maximum value of the daily stock return of financial institutions is ±0.1, which is determined by the ups and downs of the Chinese stock market. The standard deviation results show that the volatility of non-bank financial institutions, especially securities institutions, is significantly greater than that of banking institutions; it also demonstrates that, the volatility of small-and medium-sized joint-stock banks is greater than that of state-owned commercial banks. In the data’s distribution pattern, the skewness of the yield data of all financial institutions is greater than 0, and the kurtosis values of most financial institutions are greater than 3. These distributions are representative of the typical ‘peak and thick tail’ distribution characteristics of financial assets, which is confirmed again by the value of the Jarque-Bera statistics.
4.2. Construction and comparison of different marginal distribution models
In the calculation of the Copula-CoVaR model, it is particularly important to establish a suitable marginal distribution model for financial assets. At present, the modeling of marginal distribution is mainly achieved through the parametric method and non-parametric method. The parametric method mainly refers to the introduction of parameter distributions (e.g., normal distribution and I distribution) based on the GARCH model. This method, used to describe the residual distribution of yield series, reflects the series’s characteristics of peak, thick tail, aggregation, and asymmetry. The non-parametric method refers to directly using the kernel density function or the empirical distribution function to describe the marginal distribution of the return sequence. In the interest of effective econometric modeling, the marginal distribution that best reflects the distribution characteristics of financial assets should be selected for research. If the fitting result of the selected marginal distribution model is quite different from the actual financial asset distribution characteristics, it will result in greater errors during the selection of the subsequent copula model, the estimation of parameters, and the calculation of CoVaR. Thus, this paper seeks the marginal distribution closest to the distribution characteristics of financial assets using three methods: the GJR-GARCH model, kernel density estimation, and the PSO-SVM algorithm.
4.2.1. The GJR-GARCH model
The development of the GARCH model in structural form and distribution is meant to better describe the characteristics of asset return series. The empirical data shows the advantages of the asymmetric GARCH model in the GARCH model (Abad et al., Citation2014); the GJR-GARCH model is found to be more effective than other asymmetric models in describing the behavior of asymmetric fluctuations in the financial market. Therefore, this paper adopts the GJR-GARCH model as the representative model of the GARCH model in the parametric method.
The GJR-GARCH (1,1,1) model proposed by Glosten et al. is as follows:
(9)
(9)
(10)
(10)
In these formulas, is an independent and identically distributed random variable, and
represents the set of all available information in the
period. If
then
otherwise
The parameters
and
are all non-random real numbers, and
is a parameter that reflects the asymmetry of fluctuations. In order to ensure a positive conditional variance, the parameters must adhere to the following constraints:
and
Additionally,
is a necessary and sufficient condition for the wide-sense stationarity of the GJR-GARCH model.
4.2.2. The kernel estimation method
In the research of kernel density estimation method, the minimum square error of candidate distribution and empirical distribution is taken as the reference for selecting the optimal kernel function and window width. Firstly, under the condition of the same window width, the optimal kernel function is selected as Gaussian kernel function, rather than a box kernel function, epanechnikov kernel function, or and triangle kernel function. Secondly, the optimal window width is found to be 0.0001 in the neighborhood (0,5) with the default window width of 0.003 as the center.
4.2.3. The PSO-SVM estimation method
Although the non-parametric kernel density estimation method overcomes the shortcomings of the historical simulation method, problems still persist, including its heavy dependence on sample data selection and slow response to emergencies. The support vector machine is a novel small sample learning method with a solid theoretical foundation. The SVM’s goal is to obtain the optimal solution in accordance with the existing information rather than just the optimal value when the number of samples tends to infinity. The algorithm converts the actual problem into a high-dimensional feature space through nonlinear transformation, which can ensure that the algorithm has good generalizability. A small number of support vectors determine the final result, which basically does not involve probability measures and the law of large numbers. These vectors, can grasp key samples and eliminate a large number of redundant samples.
Consider the study of the marginal distribution of the SVM estimation method. In the parameter-setting scenario with penalty coefficient and window width
the error rate of three-fold cross-validation is taken as the reference to select the optimal kernel function and window width; the radial basis kernel is also selected as the estimation function of marginal distribution in this scenario. Secondly, the PSO algorithm is used to find the optimal parameter combination, and the search intervals of the penalty coefficient and window width are [0.5,3] and [10,20], respectively. Finally, the optimal parameter combination is found as penalty coefficient
and window width
4.3. Comparison of the results of different marginal distribution estimation methods
The purpose of using the above three methods to estimate the marginal distribution of the return rate series is to find the marginal distribution that best reflects the distribution characteristics of financial assets. The other purpose of the marginal distribution estimation is to estimate the parameters of the copula function. Therefore, this paper adopts the maximum likelihood method to estimate the six types of copula functions (Gaussian copula, t-copula, Clayton copula, Gumbel copula, Frank copula, and Joe copula), as well as investigating the optimal copula function form by using the information criterion. Relevant copula functions are described in the Appendix. It is estimated that the minimum mean square error considers the optimal joint distribution under different methods. The specific estimation results are shown in .
Table 3. CoVaR results of different marginal distribution estimation methods (calculation results based on Shanghai Securities Composite Index).
As can be seen from , the accuracy of the model’s analysis results are affected by the limitations of the econometric model itself, such as the need to assume the conditional distribution of the residuals in advance, and its inability to adapt well to the characteristics of the financial price data. However, the edge distribution estimation method based on PSO-SVM has an absolute advantage in both the performance of marginal distribution and the results of copula function. The marginal distribution estimation of PSO-SVM does not just avoid the loss of data volume caused by excluding some samples (like the traditional nonparametric method), but it also obtains a distribution that is closer to the return series of financial assets than the parametric method’s distribution. In addition, because of the existence of support vectors, the method is not limited by the sample data. In view of these findings, this paper uses an integrated system composed of a machine learning method (PSO-SVM) and copula function to further study the identification of systemically important financial institutions at the micro level.
Table 2. Mean square error of different marginal distribution methods.
4.4. Result analysis based on the Copula-CoVaR model
shows CoVaR values calculated through different edge distribution estimation methods based on the Shanghai Securities Composite Index. shows the CoVaR values of the top five financial institutions calculated under different methods. According to the weak-form efficient market hypothesis, market prices fully reflect all available information, thus capturing more micro-level information while taking into account the ever-changing market risks.
The table makes it evident that, due to the special characteristics of China’s financial market, commercial banks were born out of the ‘universal’ national banking system in the early days of the founding of the People’s Republic of China. Even though the financial system has diversified, large commercial banks still occupy the dominant position in China’s financial system, making them systemically important. The results of different estimation methods consistently show that the banking industry’s listed companies have an advantage in systemic importance, indicating that the financial system is still bank-led; some joint-stock commercial banks and city commercial banks also have systemic importance that cannot be ignored and should also be considered in the important matters of financial supervision.
Furthermore, in order to verify the robustness of the model, shows the value of CoVaR calculated based on the Shenzhen Securities Component Index. A comparison of and reveals that the ranking of SIFIs is consistent, which proves the robustness of the model constructed in this paper.
Table 4. CoVaR results of different marginal distribution estimation methods (calculation results based on Shenzhen Securities Component Index).
Our results prove that, more than other types of financial institutions, banks are still the main contributors to financial systemic risks. Since the risk contagion between financial institutions is experiencing evolving and dynamic change, the estimation may deviate from the actual figure if the size of financial institutions is considered the most important determinant in identifying SIFIs. In the practice of financial supervision, we should not only focus on the traditional large-scale state-owned commercial banks with systematic importance; we should also strengthen the supervision of financial institutions with high vulnerability, potential damage and high debt ratios, even if the asset scale is not large enough.
5. Conclusions
Since the global financial crisis in 2008, accurately identifying SIFIs has become an increasingly prominent concern, especially considering that traditional methods of identifying SIFIs ignore the application of machine learning models. Traditional measurement models have requirements for stable data and sample size, and their recognition capabilities are limited.
The empirical results show that, on the one hand, the marginal distribution estimation method based on PSO-SVM can better fit the distribution of financial asset return sequences (both in terms of the performance of marginal distribution and the results of the copula function); in short, the method can effectively identify China’s systemically important financial institutions. Findings indicate that the ranking of SIFIs is roughly the same as the ranking in reality, meaning that the PSO-SVM-Copula-CoVaR model constructed in this paper can more effectively identify China’s SIFIs and provide a new method for the regulatory authorities to identify SIFIs and improve regulatory efficiency.
However, due to the varying levels of information disclosure from financial institutions, this study is limited by the fact that the data used is single stock price data. Once the financial market information disclosure system is improved, future studies can include other types of financial data in the research of the model, which would better realize the dynamic identification of SIFIs.
Disclosure statement
The authors declare that they have no conflict of interest.
Additional information
Funding
References
- Abad, P., Benito, S., & López, C. (2014). A comprehensive review of value at risk methodologies. The Spanish Review of Financial Economics, 12(1), 15–32. https://doi.org/10.1016/j.srfe.2013.06.001
- Acharya, V. V., Pedersen, L. H., Philippon, T., & Richardson, M. (2017). Measuring systemic risk. Review of Financial Studies, 30(1), 2–47. https://doi.org/10.1093/rfs/hhw088
- Adrian, T., & Brunnermeier, M. K. (2009). CoVaR. Journal of Labor Economics, 55(6), 301–348.
- Banulescu, G. D., & Dumitrescu, E.-I. (2015). Which are the SIFIs? A component expected shortfall approach to systemic risk. Journal of Banking & Finance, 50, 575–588. https://doi.org/10.1016/j.jbankfin.2014.01.037
- Banulescu-Radu, D., Hurlin, C., Leymarie, J., & Scaillet, O. (2021). Backtesting marginal expected shortfall and related systemic risk measures. Management Science, 67(9), 5730–5754. https://doi.org/10.1287/mnsc.2020.3751
- Benoit, S., Colletaz, G., & Hurlin, C. (2013). A theoretical and empirical comparison of systemic risk measures. HEC Paris Research Paper.
- Bernal, O., Gnabo, J. Y., & Guilmin, G. (2014). Assessing the contribution of banks, insurance and other financial services to systemic risk. Journal of Banking & Finance, 47, 270–287. https://doi.org/10.1016/j.jbankfin.2014.05.030
- Bernardi, M., Durante, F., & Jaworski, P. (2017). CoVaR of families of copulas. Statistics & Probability Letters, 120, 8–17. https://doi.org/10.1016/j.spl.2016.09.005
- Billio, M., Getmansky, M., Lo, A. W., & Pelizzon, L. (2012). Econometric measures of connectedness and systemic risk in the finance and insurance sectors. Journal of Financial Economics, 104(3), 535–559. https://doi.org/10.1016/j.jfineco.2011.12.010
- Boako, G., & Alagidede, P. (2018). Systemic risks spillovers and interdependence among stock markets: International evidence with CovaR-copulas. South African Journal of Economics, 86(1), 82–112. https://doi.org/10.1111/saje.12182
- Brämer, P., & Gischer, H. (2013). An assessment methodology for domestic systemically important banks in Australia. Australian Economic Review, 46(2), 140–159. https://doi.org/10.1111/j.1467-8462.2013.12008.x
- Brownlees, C. T., & Engle, R. F. (2017). Srisk: A conditional capital shortfall measure of systemic risk. Review of Financial Studies, 30(1), 48–79. https://doi.org/10.1093/rfs/hhw060
- Chen, H., Li, Z., & Liu, K. (2021). Research on identification of systemically important financial institutions from the perspective of macro-prudential based on the index model. In Proceedings—2nd International Conference on E-Commerce and Internet Technology, ECIT (pp. 325–330).
- Dutta, H. (2022). A consensus algorithm for linear support vector machines. Management Science, 68(5), 3703–3725. https://doi.org/10.1287/mnsc.2021.4042
- Eberhart, R., & Kennedy, J. (1995). New optimizer using particle swarm theory. In Proceedings of the International Symposium on Micro Machine and Human Science (pp. 39–43).
- Fan, H., Amalia, A., & Gao, Q. (2018). The assessment of systemic risk in the Kenyan banking sector. Complexity, 2018, 1–15. https://doi.org/10.1155/2018/8767836
- Guo, W. (2013). Assessment of the systematic importance of Chinese listed banks: Indicator approach based positive analysis. Modern Economic Science, 35(2), 28–35.
- Hakwa, B., Jäger-Ambrożewicz, M., & Rüdiger, B. (2012). Measuring and analysing marginal systemic risk contribution using CoVaR: A copula approach. Working Paper.
- Jaeger-Ambrozewicz, M. (2013). A critical note on delta-CoVaR. SSRN Electronic Journal. https://doi.org/10.2139/ssrn.2210045
- Johnson, M., & Mamun, A. (2012). The failure of Lehman brothers and its impact on other financial institutions. Applied Financial Economics, 22(5), 375–385. https://doi.org/10.1080/09603107.2011.613762
- Karimalis, E. N., & Nomikos, N. K. (2018). Measuring systemic risk in the European banking sector: A copula CoVaR approach. The European Journal of Finance, 24(11), 944–975. https://doi.org/10.1080/1351847X.2017.1366350
- Kim, K. J. (2003). Financial time series forecasting using support vector machines. Neurocomputing, 55(1–2), 307–319. https://doi.org/10.1016/S0925-2312(03)00372-2
- Kleinow, J., Horsch, A., & Garcia, M. (2014). Determinants of systemically important banks in Latin America. SSRN Electronic Journal. https://doi.org/10.2139/ssrn.2441868
- Lee, Y. C. (2007). Application of support vector machines to corporate credit rating prediction. Expert Systems with Applications, 33(1), 67–74. https://doi.org/10.1016/j.eswa.2006.04.018
- Li, H., Wu, Y. J., Zhang, S., & Zou, J. (2021). Temporary rules of retail product sales time series based on the matrix profile. Journal of Retailing and Consumer Services, 60, 102431. https://doi.org/10.1016/j.jretconser.2020.102431
- Liu, G. W. (2015). Simulating risk contributions of credit portfolios. Operations Research, 63(1), 104–121. https://doi.org/10.1287/opre.2015.1351
- Lo, A. W. (2009). Hedge funds, systemic risk, and the financial crisis of 2007–2008: Written testimony for the house oversight committee hearing on hedge funds. SSRN Working Paper Series.
- López-Espinosa, G., Moreno, A., Rubia, A., & Valderrama, L. (2012). Short-term wholesale funding and systemic risk: A global CoVaR approach. Journal of Banking & Finance, 36(12), 3150–3162. https://doi.org/10.1016/j.jbankfin.2012.04.020
- Lu, J., & Hu, X. (2014). Novel three-bank model for measuring the systemic importance of commercial banks. Economic Modelling, 43, 238–246. https://doi.org/10.1016/j.econmod.2014.08.007
- Luo, J., Yan, X., & Tian, Y. (2020). Unsupervised quadratic surface support vector machine with application to credit risk assessment. European Journal of Operational Research, 280(3), 1008–1017. https://doi.org/10.1016/j.ejor.2019.08.010
- Mainik, G., & Schaanning, E. (2014). On dependence consistency of CoVaR and some other systemic risk measures. Statistics & Risk Modeling, 31(1), 49–77. https://doi.org/10.1515/strm-2013-1164
- Patton, A. J. (2006). Modelling asymmetric exchange rate dependence. International Economic Review, 47(2), 527–556. https://doi.org/10.1111/j.1468-2354.2006.00387.x
- Reboredo, J. C., & Ugolini, A. (2015). Systemic risk in European sovereign debt markets: A CoVaR-copula approach. Journal of International Money and Finance, 51(C), 214–244. https://doi.org/10.1016/j.jimonfin.2014.12.002
- Sun, X., Liu, C., Wang, J., & Li, J. (2020). Assessing the extreme risk spillovers of international commodities on maritime markets: A GARCH-Copula-CoVaR approach. International Review of Financial Analysis, 68, 101453. https://doi.org/10.1016/j.irfa.2020.101453
- Tarashev, N., Borio, C., & Tsatsaronis, K. (2009). The systemic importance of financial Institutions. BIS Quarterly Review.
- Thomson, J. B. (2015). On systemically important financial institutions and progressive systemic mitigation. DePaul Business and Commercial Law Journal, 8(2), 135.
- Vapnik, V. (1995). The nature of statistical learning theory (pp. 988–999). Springer.
- Vapnik, V. (1998). Statistical learning theory. John Wiley and Sons.
- Wu, F., Zhang, Z., Zhang, D., & Ji, Q. (2021). Identifying systemically important financial institutions in China: new evidence from a dynamic copula-CoVaR approach. Annals of Operations Research. https://doi.org/10.1007/s10479-021-04176-z
- Xu, C. (2011). Review on the identification methods of systemically important financial institutions. International Financial Research, 11, 57–64.
- Yao, S. J., He, H. B., Chen, S., & Ou, J. H. (2018). Financial liberalization and cross-border market integration: Evidence from China’s stock market. International Review of Economics & Finance, 58, 220–245. https://doi.org/10.1016/j.iref.2018.03.023
- Zhang, D. (2017). Oil shocks and stock markets revisited: Measuring connectedness from a global perspective. Energy Economics, 62, 323–333. https://doi.org/10.1016/j.eneco.2017.01.009
- Zhang, Z., Zhang, D., Wu, F., & Ji, Q. (2021). Systemic risk in the Chinese financial system: A copula-based network approach. International Journal of Finance & Economics, 26(2), 2044–2063. https://doi.org/10.1002/ijfe.1892
- Zhou, C. (2010). Are banks too big to fail? Measuring systemic importance of financial institutions. International Journal of Central Banking, 6, 205–250.
Appendix A
The binary distribution joint distribution of copula function consists of two parts: distribution function of variables and copula function representing variables. The form of the joint distribution function of the corresponding strength parameters and
is as follows:
In this formula, and
are the distribution functions of strength parameters, and
is the parameter of copula function. shows the relevant information of the six functions involved in this study.
Table A1. Six different copula functions.
See .
Table A2. Descriptive statistics of financial institutions’ yield series.