
 ?Mathematical formulae have been encoded as MathML and are displayed in this HTML version using MathJax in order to improve their display. Uncheck the box to turn MathJax off. This feature requires Javascript. Click on a formula to zoom.
Abstract
As a new urbanization mode, smart cities provide a way to achieve the mutually beneficial situation of both economic development and environmental protection. As such, the question of whether and how smart-city construction can promote the high-quality development of urban economies is worth considering. By measuring the green total factor productivity (GTFP) of 233 cities in China from 2004–2019, this paper adopts the national pilot smart cities of China as a quasi-experiment and constructs a time-varying DID model to explore the direct, dynamic, and heterogeneity influence of smart-city construction on GTFP. The results indicate the following: (1) Smart-city construction can significantly promote the urban GTFP, which is mainly caused by the progress of green technology, and the effect is robust after a series of robustness tests; (2) smart-city construction can contribute to GTFP improvement primarily through accelerating technological innovation, promoting industrial upgrading, and realizing resource allocation optimization; and (3) smart cities that are larger in scale, have a higher administrative rank, and lie in eastern regions have stronger positive effects on GTFP. This study aims to contribute to the promotion of urban sustainable development.
1. Introduction
The world has faced large-scale urbanization over the past few decades. In particular, China’s urbanization rate reached 63.89% in 2020, which is 27.67% higher than that of 2000.Footnote1 However, the rapid development of urbanization has been accompanied by ecological damage, environmental pollution, traffic congestion, and other types of urban disease that seriously impact the effective development of cities. Technological innovation is an important focus for achieving pollution reduction, and cities, as the basic unit of a country, are the core medium for promoting green technological innovation. In the context of the global technological revolution, the smart city program, which supports urban development with advanced technology, has emerged. In 2008, IBM proposed the Smarter Planet strategy for the first time, and in 2009 China proposed the concept of smart-city construction, advocating for the in-depth application of information technology to urban construction. Since 2012, Chinese governments have announced three sets of national pilot smart cities, which focus on the transition of the urban development mode by relying on information technology including the Internet of Things, cloud computing, big data, and urban innovation ecology nurtured by the knowledge environment. Therefore, smart-city construction is, to some extent, regarded as the fundamental approach to the green and low-carbon transformation of cities. Consequently, it is a critical path for exploring the sustainable development of cities. Sustainable development should include economic development, ecological environment improvement, and related aspects. Green total-factor productivity (GTFP) incorporates non-desired outputs like environmental pollution into the total-factor productivity analysis framework. It also measures the green productivity of an economy to produce desired outputs from a given set of inputs while minimizing negative ecological consequences and can more comprehensively reflect the effective and sustainable development of a regional economy (Xia & Xu, Citation2020). Accordingly, this paper will consider whether smart-city construction can promote GTFP, explore the impact mechanism, and discuss the heterogeneous effect of the influence of smart-city construction on GTFP.
This paper makes three main contributions to current research. First, we measured the GTFP using the epsilon-based-measure-Malmquist-Luenberger (EBM-ML) index. Most existing literature calculates GTFP based on the traditional radial and angle DEA model or the SBM model (Tone, Citation2001). On the one hand, traditional DEA-CCR and DEA-BCC models ignore the existence of undesired output and neglect the input-output slack problem. On the other hand, the SBM model does not consider the input and output variables of both radials and their characteristics. Meanwhile, the SBM model simultaneously increases the optimal relaxation contrast between the input and output variables and discards the front projection proportion of the original information, which leads to deviations in the calculation results. Tone and Tsutsui (Citation2010) proposed an improved model that accounts for the compatibility proportion and radial distance functions: the epsilon-based measure (EBM) model. It includes related elements into the target and practical value between the radial scale and considers the differentiation of radial slack variables. The EBM model better reflects the environmental efficiency level of DMUs and effectively solves the deficiency of the SBM model (Li & Wu, Citation2017; Tone & Tsutsui, Citation2010). Therefore, we use the EBM model combined with the Malmquist-Luenberger (ML) index to measure the GTFP of cities. Second, most of the existing literature uses only the first batch of pilot smart cities as the treatment group to identify the impact of smart-city construction on GTFP using the standard DID, which cannot comprehensively identify the impact of all three batches of pilot smart cities on GTFP. As such, we select these three batches of pilot smart cities as the treatment group and use the time-varying DID model to divide the control group and the experimental group year by year to identify the influence of smart-city construction on GTFP. Additionally, the existing literature also treats prefecture-level cities containing counties or districts that are smart-city pilots as the experimental group, which underestimates the impact effect of smart-city policy on GTFP. Therefore, this study discounts prefecture-level cities containing counties or districts that are smart-city pilots and ultimately includes 233 prefecture-level cities as the research sample. Third, this study explores the mechanism of smart-city construction influencing GTFP from the perspective of accelerating technological innovation, promoting industrial structure upgrading, and realizing resource allocation optimization. Furthermore, this paper discusses the heterogeneity effect of smart-city construction on GTFP using the factors of urban size, geographical location, and administrative level to provide targeted theoretical guidance for the revision and improvement of smart city policies.
The paper is organized as follows: Section 2 presents a review of the literature, Section 3 describes model settings, variables, and data, Section 4 outlines the empirical analysis, and Section 5 discusses conclusions and policy implications.
2. Literature review
There is no clear definition of smart cities, and earlier scholars believed that technology was at the heart of smart cities. For example, Gibson et al. (Citation1992) first introduced the ‘smart city’ concept and believed that smart-city construction could improve quality of life through the adoption of new technologies. Eger (Citation2009) also highlighted the role of information communication technologies (ICTs) in smart-city construction. However, according to Kourtit et al. (Citation2012) as well as Kandt and Batty (Citation2021), the smart city is a new development model where information technology and urbanization are integrated to a high degree. Furthermore, the application of information technology is as important as the effective use of social capital, entrepreneurship, and innovation capabilities. Accordingly, Neirotti et al. (Citation2014) have argued that smart-city construction should combine intelligent computer technology with urban production and life, emphasizing that smart cities must reflect people’s expectations for a better life (Papa et al., Citation2013). Likewise, Giffinger and Gudrun (Citation2010) stressed that smart-city construction should contain six elements, including smart people, smart mobility, smart governance, smart environment, smart economy, and smart living. Lee et al. (Citation2014) also emphasizes that the motivations for smart city development should include knowledge, humans, technology, environment, education, and many other factors.
Additionally, a significant number of studies have evaluated the effects of smart-city construction on economic and social structures.
Smart-city construction can boost economic growth and plays an important role in optimizing resource allocation and improving economic productivity (Ahvenniemi et al., Citation2017). Specifically, the application of the Internet of Things, artificial intelligence, cloud computing, and other technologies promotes the digital transformation of enterprises, which can improve their innovation capacity and productivity (Dewan & Kraemer, Citation2000; Jiang et al., Citation2021). Furthermore, smart-city construction can reduce the average costs of companies, including production costs, transportation costs, and transaction costs, while directly stimulating demands and investment to achieve urban economic development (Bustos, Citation2011; Nikitas et al., Citation2020; Xu et al., Citation2022; Song et al., Citation2022). However, this effect is heterogeneous, with the promotion effect of the United States and other developed countries being the most significant (Gust & Marquez, Citation2004).
Smart-city construction can also accelerate technological innovation. The infrastructure of ICT and other technologies may have several effects. It can change the way resources are combined and connected; reduce transaction, contract, agency, and governance costs; reduce cognitive innovation differences in the innovation process, leading to the gathering, learning, and sharing of knowledge and creativity; and enhance the innovation capability of each subject (Meijer & Thaens, Citation2018; Appio et al., Citation2019; Su et al., Citation2022). Angelidou (Citation2017) analyzed the plans of 15 representative smart cities worldwide and argued that most smart cities emphasize the contribution of information and communication technologies and focus on knowledge transfer and innovation. Caragliu and Del Bo (Citation2019) collected a dataset of smart-city policy intensity and urban innovation outputs in 309 European metropolitan areas using the Propensity Score Matching (PSM) method to explore the urban innovation effect of smart-city policies. They found that cities engaging in smart-city policies above the EU average also tend to patent more. Furthermore, the implementation of smart-city construction policy can also boost urban innovation output in China (Wang & Deng, Citation2022).
Furthermore, smart-city construction can improve environmental quality. Specifically, it may reduce traffic congestion and achieve sustainable transportation by creating a smart transportation system that includes shared bicycles or cars as well as the monitoring of vehicle emissions in real time (Jamil et al., Citation2015; Zawieska & Pieriegud, Citation2018). Smart-city construction also provides intellectual support for urban development with the siphon effect of talents, the diffusion effect of knowledge and guides, the demonstration effect of role models, and green changes in residents’ lifestyles based on the concept of ecological civilization (Chu et al., Citation2021; Su et al., Citation2022). Furthermore, smart-city construction can significantly promote industrial transformation and upgrading, which are fundamental for energy-saving and emission reduction, to achieve a reduction of pollution and carbon emissions (Gao & Yuan, Citation2022; Yigitcanlar & Kamruzzaman, Citation2018). However, Winters (Citation2011) has argued that urban population migration resulting from smart city development both exacerbates urban environmental management pressure and reduces the resilience of cities to future climate risks.
In the relevant literature to date, a significant number of studies have explored the economic or environmental consequences of smart-city construction. Nonetheless, there is room for further research, and several gaps have emerged. As a new urban development model, smart cities specifically emphasize environment-inclusive growth, which entails achieving a mutually beneficial situation of economic growth and the improvement of environmental quality (Albino et al., Citation2015; Tao et al., Citation2022; Qin et al., Citation2022). Therefore, the evaluation of smart-city construction policy should give more consideration to their contribution to the sustainable development goals of cities. However, few studies have explored the impact of smart-city construction on economic development and environmental protection. To our knowledge, Xin and Qu (Citation2019) and Jiang et al. (Citation2021) are the only two works that explore the impact of smart-city construction on GTFP, so further study remains necessary. First, the two works primarily calculated GTFP using the SBM model. However, the SBM model does not consider the input and output variables of both radials and their characteristics. Meanwhile, the SBM model simultaneously increases the optimal relaxation contrast between input and output variables and discards the proportion of front projection from the original information. This leads to deviations in the calculation results. Second, the impact mechanism and heterogeneous effects have not yet been studied in depth. The two works only investigated the mechanism of smart-city policies that influence GTFP through technological innovation and only discussed the heterogeneous effects of urban size. Thus, they neglected the differences of geographical location and administrative level. Third, the existing literature explored the influence of smart-city construction on GTFP based on the first or second batch of pilot smart cities using the DID method. However, China has announced three batches of pilot smart cities in different years, and the standard DID model is not applicable. Furthermore, the existing literature treated prefecture-level cities containing counties or districts that are smart-city pilots as the experimental group, which underestimates the impact effect of smart-city policy on GTFP. Therefore, in this paper, we remove prefecture-level cities containing counties or districts that are smart-city pilots and calculate the GTFP of 233 cities in China from 2004–2019 using the EBM-ML index. Subsequently, relying on the quasi-experiment of the national smart-city construction policies established in China, a time-varying DID model is used to explore the direct, dynamic, and heterogeneity impact of smart-city construction on GTFP.
3. Model settings, variables, and data
3.1. Model setting
The smart-city construction pilot cities were not approved in the same year, and there are differences in time and pilot cities. Accordingly, this study treats the three batches of national smart-city pilot construction as a quasi-experiment and uses the time-varying DID model to explore the impact of smart-city policy on GTFP. The model is set up as follows:
(1)
(1)
where lngtfpit is the logarithm of GTFP of city i at time t, sccit denotes the dummy variable of smart-city construction pilot cities, Xit indicates other control variables,
indicates the random disturbance term,
denotes the urban fixed effect,
indicates the year fixed effect, and
reflects the impact of the smart-city policy on the improvement of GTFP. If
> 0, smart-city policy can promote GTFP improvement, otherwise inhibit.
3.2. Variable description
1. Explained variable: green total-factor productivity (gtfp). We use the EBM model combined with the ML index to measure GTFP.
We suppose that every city in China is a production decision-making unit (DMU), and each DMU constructs an optimal production frontier in each period, t = 1, 2, ···T. Supposing that each DMU uses N inputs, x = (x1, x2, ···, xN) produces M desirable outputs y = (y1, y2, ···, yM)
and I undesirable outputs b=(b1, b2, ···, bI)
As such, the production possibility sets P(x), as shown in EquationEquation (2)
(2)
(2) :
(2)
(2)
Simultaneously, the EBM model put forward by Tone and Tsutsui (Citation2010) is employed to establish the distance directional function and to measure static efficiency:
(3)
(3)
In EquationEquation (3)(3)
(3) ,
denotes the directional distance function of the variable returns to scale (VRS).
represents the optimal efficiency, 0≤
≤1, and
refers to the i input of k DMU.
refers to the r desirable output of k DMU, and
refers to the p desirable output of k DMU. Furthermore, m, s, and q represent a series of inputs, desirable outputs, and undesirable outputs, respectively.
denotes the radial efficiency value, and
represents the parameters of the efficiency value of the radial model and efficiency value of the non-radial model.
denotes the non-radial efficiency value, and
and
indicate the slack vector of r desirable outputs and p desirable outputs, respectively. Additionally,
is the slack vector of i input. Finally,
and
denote the weight of r desirable outputs, the weight of p desirable outputs, and the weight of inputs, while
= 1.
indicates the weight of each district section.
Subsequently, we use the ML index to measure dynamic GTFP. Based on the analysis of Chung et al. (Citation1997), the ML productivity index of t-t + 1 is as follows:
(4)
(4)
In EquationEquation (4)(4)
(4) , ML denotes the green ML productivity index, TECH stands for green technology progress, and EFFCH represents green technology efficiency. Given that the ML productivity index reflects the growth rate of GTFP and the change of GTFP relative to the previous year, it is impossible to compare the size of GTFP simply from the index. As such, we use the cumulative form of GTFP, and the decomposition indexes are treated similarly.
The input and output indicators of the gtfp measures are as follows:
Input indicators
First, we consider labor input. As there are no statistical data on labor time in the cities of China, this paper uses the number of employees at the end of each year in each city as the indicator of labor input. Second, we consider capital input. The fixed capital stock of the city obtained by the perpetual inventory method is used to characterize the indicator of capital factor input, which is calculated as follows:
(5)
(5)
In Formula (5), indicates the capital stock of city i in year t,
indicates the capital stock of city i in year t-1,
indicates the amount of new fixed assets investment for city i in year t, and
indicates the rate of depreciation. This paper sets the depreciation rate (
) of urban fixed assets at 10.96% and converts investment and the capital stock of urban fixed assets into constant price for 2003 using the fixed asset price index of each province.
2. Output indicators
First, we consider expected output. Due to the lack of a GDP deflator at the prefecture-level city level, this paper uses the provincial GDP deflator to adjust the GDP of the prefecture-level city to the actual value based on 2003. Second, we consider undesirable output. Undesirable output mainly refers to various pollutants, such as sulfur dioxide, smoke and dust, solid waste, which are produced in the process of urban industrial production and residents’ lives. Given the availability of data, this paper selects the emissions of industrial sulfur dioxide, industrial wastewater, and industrial smoke and dust to represent the undesirable output of the city.
2. Explanatory variable: Smart-city construction pilot policy (scc). China announced three batches of national smart-city construction pilot lists in January 2013, August 2013, and April 2015, respectively. In this paper, the first round of pilot cities announced in January 2013 takes 2013 as the year for the pilot, the second round of pilot cities announced in August 2013 takes 2014 as the year for the pilot, and the third round of pilot cities announced in April 2015 takes 2015 as the year for the pilot. If city i is the smart-city pilot in year t, then scc in and after year t is assigned a value of 1. Otherwise, it is 0.
3. Control variables: The following variables were selected in this paper. ① Economic agglomeration (agg) is measured by the ratio of the GDP of each city to the GDP of the entire province. ② Industrial structure (sgdp) is measured by the GDP of the tertiary industry. ③ Population density (popden) is measured by the size of population per unit area. ④ Fiscal expenditure on science and technology (te) refers to the budget expenditure on science and technology/GDP. ⑤ Infrastructure construction (inf) is measured by the number of public vehicles. ⑥ Fiscal expenditure on education (edu) is expressed by the budget expenditure on education/GDP. ⑦ Social investment rate(invest)is measured by the proportion of urban fixed assets investment to GDP. ⑧ Opening-up level (fdi) is measured by the amount of foreign direct investment utilized. ⑨ Government intervention (gov) refers to the general public budget expenditure for GDP. In this paper, the above variables are logarithmically processed, and the variables’ descriptive statistics are shown in .
Table 1. Variable descriptive statistics.
3.3. Data
On the one hand, considering that some of the national smart-city pilot lists established in the three rounds only include a county or district under a prefecture-level city, if we consider this prefecture-level city as a pilot city the impact of smart-city policy on GTFP would be underestimated. Consequently, this study removes the category of prefecture-level cities and selects 233 prefecture-level cities as the study sample. On the other hand, each prefecture-level city will no longer publish fixed asset investment data after 2017, and this paper calculated the fixed asset investment data based on the published growth rate of fixed asset investment. Unfortunately, the National Bureau of Statistics has not published the price index of fixed asset investment after 2019, so we cannot accurately estimate the capital stock of each prefecture-level city after that year. Using predicted capital stock to measure GTFP may produce significant errors. Fortunately, the dynamic effect of smart-city construction can be more effectively evaluated following the four-year implementation period after the third round of pilot cities was announced in 2015. Therefore, this paper sets the sample period from 2004–2019.Footnote2 The original data used in the study comes from the ‘China Statistical Yearbook’, ‘China Environmental Yearbook’, ‘China Urban Statistical Yearbook’, the statistical yearbooks of each province, and the statistical bulletins of each prefecture-level city.
4. Results and discussion
4.1. The mutually beneficial effect of smart-city construction
The improvement of GTFP is directly reflected in the mutually beneficial effect of economic growth and pollution emissions reduction, and this paper examines this effect of smart-city construction. The results indicate smart-city construction can not only significantly improve the expected output level, such as GDP and per capita GDP, but also significantly reduce undesirable outputs, including the pollution emissions of industrial sulfur dioxide, industrial wastewater, industrial smoke, and the pollutant composite index (see ).Footnote3 As such, the results suggest that smart-city construction can have a mutually beneficial effect.
Table 2. Mutually beneficial effect of smart city construction.
4.2. The impact of smart-city construction on GTFP
The results of the impact of scc on GTFP are shown in . Model (1) includes the prefecture-level cities where the pilot counties or districts are located, while Model (2) and Model (3) exclude the prefecture-level cities where the pilot counties or districts are located. The results indicate that, despite whether the control variables are added, the estimated coefficient of scc on GTFP is positive, which is significant at the level of 1%. Additionally, the estimated coefficient value of Model (3) is 0.034, which is higher than the estimated coefficient value of Model (1) of 0.020. Consequently, the impact of scc on GTFP would be underestimated if the prefecture-level cities where the pilot counties or districts are located were included in the study sample as described previously. The results also indicate that the smart-city pilot policy will increase GTFP by 3.4% on average. Simultaneously, this paper further examined the impact of scc on the green technology efficiency index and green technology progress index. The results demonstrate that the estimated coefficient of scc on green technology efficiency is not significant, while the estimated coefficient of scc on green technology progress is significantly positive at the level of 1%. These results imply that the positive effect of scc on GTFP is mainly due to the progress of green technology. Therefore, scc not only directly promotes enterprises to increase the R&D of green technologies but also promotes the use of advanced technologies such as ICT, cloud computing, and AI to promote green technology progress. However, scc does not bring innovation to environmental management systems to achieve a significant improvement in green technology efficiency.
Table 3. Direct impact of smart city construction on GTFP.
4.3. Robustness test
4.3.1. Common trend test
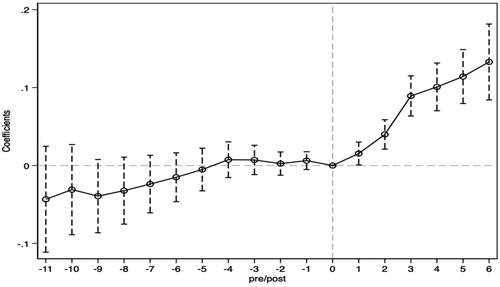
An important prerequisite for the validity of the DID method is that the treatment group and the control group meet a common trend before the policy is implemented. That is, if the smart-city construction pilot policy is not implemented, the changing trend toward GTFP in smart pilot cities and other cities should be parallel. Referring to Li et al. (Citation2016), this paper establishes the following model to test whether there is a common trend before the smart-city construction pilot and to dynamically examine the impact of the pilot policy on the growth of GTFP:
(6)
(6)
where
denotes dummy variables indicating implementation of the smart-city construction pilot policy. Suppose that the year when city I was announced as a smart-city construction pilot area is policyi, setting k = t- policyi. when k = −11, −5, ···, 2,6, then
= 1, otherwise = 0. Taking the current year to the implementation of policy as the base group, shows the changing trend of the estimated coefficients of each dummy variable. According to the results, the estimated coefficients are not significant before the implementation of the scc pilot policy, which shows that there is no significant difference in GTFP between the pilot and non-pilot cities before the implementation of the scc pilot policy, thus meeting the common trend. However, after the implementation of the policy, the estimated coefficients become larger and are significantly positive, indicating that the policy of smart-city construction has significantly contributed to the growth of GTFP.
Figure 1. common trend test.
Source: Author’s estimation.
4.3.2. Reverse test
Is the choice of pilot cities for smart-city construction influenced by the GTFP level of cities? Referring to studies by Beck et al. (Citation2010), the following risk model is constructed to test whether this reverse effect exists:
(7)
(7)
where Tit denotes the survival time of city i in the year t, which is assumed to obey the Weibull distribution in the study, lngtfpit is the logarithm of GTFP of city i at time t, and X denotes a controlled variable, which is consistent with Formula (1). The results show that, regardless of whether the control variables are added, the estimated coefficients of lngtfp are not significant. This outcome indicates that the GTFP of a city does not have significant impact on whether it can become a pilot city for a smart city and further verifies that the results are robust and reliable. ()
Table 4. Results of the survival analysis.
4.3.3. PSM-DID
Considering that the DID method ignores the systematic differences between the control and treatment group, this paper rematches the treatment group according to kernel matching, nearest neighbor matching, and radius matching methods.Footnote4 reports the results of PSM-DID estimation, and they indicate that the estimated coefficient of scc on GTFP remains significantly positive at the 1% level after PSM method matching.
Table 5. Results of PSM-DID.
4.3.4. Excluding the possible effects of other policies
Several of the 100 scc pilot cities covered in this paper are also affected by policies including national-environmental-model cities, innovative pilot cities, new-energy pilot cities, and emission-trading pilot cities. To eliminate the interference of the policies mentioned above, re-estimation is conducted by excluding their pilot cities. reports the estimated results of excluding the possible effects of other policies. The results show that the estimated coefficient of scc remains significantly positive, indicating that the benchmark regression is robust and smart city policies have a significant effect on GTFP.
Table 6. Results of excluding other policies.
4.3.5. Other robust tests
(1) Change the measurement method of GTFP. In this paper, the original input and output indicators are used to re-measure GTFP using the SBM-ML index model, and re-estimated EquationEquation (1)(1)
(1) results suggest that the estimated coefficient of scc is positively significant at the 1% level (see , Model 1), further indicating that smart city policies can significantly promote GTFP.
Table 7. Results of other tests.
(4) Considering time-varying DID heterogeneous treatment effects. Some scholars have found that using time-varying DID models to identify policy effects may result in significant estimation bias due to ‘heterogeneous treatment effects’ (De Chaisemartin & d’Haultfoeuille, Citation2020). Accordingly, this paper uses the method suggested by De Chaisemartin and d’Haultfoeuille (Citation2020) to conduct robustness tests on the heterogeneity treatment effect. The estimated robustness index of heterogeneity treatment is 0.73, which is close to 1, indicating that the effect of heterogeneity treatment does not have a substantial effect on the estimation results of this study. As such, the conclusion is robust.
4.4. Mechanism analysis
Theoretically, scc can promote GTFP improvement by accelerating technological innovation, promoting industrial structure upgrading, and realizing resource allocation optimization. To further verify the theoretical influence mechanism, this paper sets three mechanism variables as explained variables. Technological innovation is measured by the number of patents granted per capita, industrial structure upgrading is expressed by the GDP of the tertiary industry/GDP of the secondary industry, and resource allocation is measured by the ratio of capital-to-labor. The estimated results are shown in .
The results indicate that, regardless of the number of patents granted per capita, industrial structure upgrading, and the ratio of capital-to-labor, the estimated coefficients of scc are significantly positive at a significant level of 1% or 5%. First, smart-city construction depends on the integration of advanced technology into urban management and services. Such integration will undoubtedly increase investment in innovation of enterprises, universities, and other innovative subjects, promote technological innovation, and improve the progress of green technology. Second, smart cities can realize the transformation and upgrading of traditional industries by applying modern information technology. They can also take advantage of the continuous development of information technology to actively develop new sectors based on the internet or AI and promote a more rationalized and advanced industrial structure. In doing so, they would finally realize the change of economic development mode and the improvement of GTFP. Third, smart-city construction can significantly improve resources allocation optimization. The development of new information technology, such as big data and the internet, has provided an essential means for smart-city construction that not only facilitates enterprises to more effectively perceive the changes of various types of information in the market but also promotes enterprises and other market entities to carry out flexible scheduling and achieve optimal allocation of capital, labor, and other production resources.
Table 8. Mechanism analysis of smart city construction on GTFP.
(2) Refine the pilot time of the policy. Considering the differences in the pilot time of the three rounds of national smart cities, this paper draws on Lu et al. (Citation2017). As such, for the first round of smart cities announced on January 29, 2013, the value of scc’ is set to 0 before 2013, 5/6 in 2013, and 1 after 2013. Similarly, for the second round of smart cities announced on August 1, 2013, the value of scc’ is set to 0 before 2014, 4/3 in 2014, and 1 after 2014. For the third round of smart cities announced on April 7, 2015, the value of scc’ is set to 0 before 2015, 2/3 in 2015, and 1 after 2015. The results show that there is no difference between the estimated coefficients and the basic estimated coefficients, which further indicates that the results of the basic estimation are robust (see , Model 2).
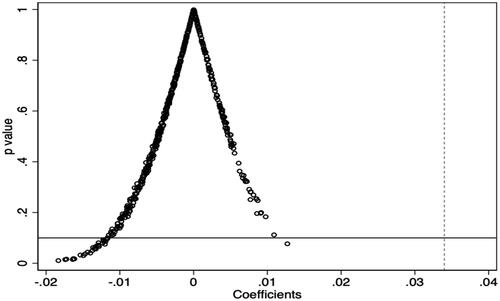
(3) Placebo test. To further test whether the impact of scc on GTFP is not due to other unobservable factors, we conducted a placebo test referring to Li et al. (Citation2016). First, 100 pilot cities for virtual smart-city construction are randomly selected from all prefecture-level cities as an ‘artificial treatment group’. One year is then randomly selected from 2004–2019 as the year of policy implementation for each artificial treatment group, and the above process is repeated 500 times to obtain 500 estimated coefficients of scc. The results show that the mean estimated coefficient value of scc is −0.003 (see ), which is much lower than the 0.034 estimated by Model 3 in Table3, and the P-values are mostly higher than 0.1. Therefore, the possibility that smart-city construction for GTFP growth is derived from other unobservable factors can be excluded.
Figure 2. Placebo test.
Source: Author’s estimation.
4.5. Heterogeneity
To achieve the improvement effect of smart-city construction on GTFP, we must fully account for the differences among cities in population size, geographical location, and administrative level rather than adopting a ‘one-size-fits-all’ policy. Therefore, the heterogeneity effect of smart-city construction must be discussed.
4.5.1. Heterogeneity of city size
First, we set the dummy variable for the city size, assigning a value of 1 to cities with an urban resident population of more than 5 million and 0 to other cities. On this basis, we add the interaction items scc × scale to explore whether the effect of smart-city construction policy results in significant differences depending on city size. The results are shown in Column (1) in : The coefficient of scc × scale is significantly positive, indicating that the impact on the GTFP of a large-scale smart city is stronger than that of the small-scale city. The larger the scale of the city, the higher the degree of industrial agglomeration and the more smart cities can fully enjoy the enhancement and diffusion effect of pollution-control technology brought by the economy of scale. Thus, compared to small- and medium-sized cities, smart-city construction in large-scale smart cities is more conducive to achieving economic growth, promoting environmental quality, and improving GTFP.
Table 9. Heterogeneity results of the impact of smart city construction on GTFP.
4.5.2. Heterogeneity of administrative levels
We then set the administrative rank dummy variable, assigning 1 to municipalities, sub-provincial cities, provincial capital cities, and special economic zone cities and 0 to other cities. On this basis, we added the interaction items scc × rank to explore the heterogeneous effect of administrative level on GTFP. The results are shown in Column (2) in : The coefficient of scc × rank is significantly positive, indicating that the impact on GTFP of a smart city with a higher administrative rank is stronger than that with a lower administrative rank. Compared to low-administrative-rank cities, smart cities with a high administrative rank can fully enjoy the advantages of scale economy, industrial agglomeration, and high-quality factor-resource agglomeration and allocation. They can do so by relying on the tools of executive orders and the benefits of administrative rank, which can realize rapid transformation of the green economy and improvement of GTFP. However, smart cities with low administrative rank may face many obstacles, such as the insufficient supply of high-skilled labor, low financial subsidies, and a low level of industrial agglomeration, so the promotion effect on GTFP is significantly smaller than that in high-administrative-rank cities.
4.5.3. Heterogeneity of geographical location
The impact of smart-city pilot policies on GTFP may have regional heterogeneity due to the imbalance of economic development among regions in China. This paper sets region dummy variables, assigning a value of 1 to the eastern region and 0 to the central and western regions. The results in Column (3) in show that the coefficient of scc × region is significantly positive, indicating that the impact of smart cities on GTFP in the eastern region is greater than that of smart cities in central and western regions. Additionally, considering the major differences in geographical environment and climate suitability of the different regions, this paper also sets the dummy variable of huline, assigning the cities on the northwest side of the Hu-huanyong line to 1 and the cities passing through the Hu-huanyong line and those on the southeast side to 0. The results in Column (4) in indicate that the coefficient of scc × huline is significantly negative, indicating that the impact of smart cities on GTFP on the northwest side of the Hu-huanyong line is lower than that of smart cities on the southeast side of the Hu-huanyong line. Compared with cities in the eastern region and east of the Hu-huanyong line, cities in the central and western regions and those west of the Hu-huanyong line have more significant disadvantages in terms of industrial agglomeration, production factors inflow, and optimal resource allocation. To some extent, such shortcomings limit the improvement effect of smart-city policy on GTFP.
5. Conclusions and policy implications
Based on the panel data of 233 prefecture-level cities in China from 2004–2019, this paper takes the national pilot smart cities in China as a quasi-experiment. It constructs a time-varying DID model to identify the direct and dynamic impact, explore the influence mechanism, and discuss the heterogeneity effect of smart-city construction on GTFP. Our findings show the following. (1) Smart-city construction can significantly promote GFTP, which is mainly caused by the progress of green technology. The estimated coefficient value is 0.034, indicating that smart city policies may significantly increase GTFP by 3.4% on average compared with non-pilot smart cities. The results remain robust after a series of robustness tests. (2) The estimation results of the influence mechanism of smart-city construction on GTFP show that smart-city construction promotes GTFP mainly through three channels: accelerating technological innovation, promoting industrial upgrading, and realizing resource allocation optimization. (3) The impact of smart-city construction on GTFP is heterogeneous depending on cities’ differences in population scale, administrative rank, and geographical location. The larger the city, the higher the administrative rank level. Similarly, the more eastern the geographical location is, the greater the influence of smart-city construction on GTFP.
The above findings are equally economically significant. Total-factor productivity growth is an essential source of long-term economic growth. GTFP, which incorporates non-desired outputs like environmental pollution into the traditional analytical framework of total-factor productivity, is an important indicator of the degree of sustainable urban development and the level of high-quality economic development. Ahvenniemi et al. (Citation2017) also argued that the ‘general goal of smart cities is to improve sustainability with the help of technologies’. Our findings indicate that smart cities can significantly promote GTFP, and the result is consistent with Ahvenniemi et al. (Citation2017). Given the global economic recession and climate change, as well as increasing carbon emissions, promoting GTFP to achieve a mutually beneficial situation of both economic development and environmental protection will be an increasingly important concern in constructing smart cities.
There are also several policy implications based on our findings. First, the results show that smart-city construction can promote GTFP. As such, the scope of the pilot smart cities in China can be expanded based on existing national pilot smart cities by adopting new indicator systems or new development concepts. Meanwhile, considering the differences in population size, administrative rank, and geographic location of cities, local governments should make full use of their development characteristics and advantages and put forward targeted and reasonable strategies for smart-city construction to avoid an excessive homogenization of ‘smart projects’. Second, the results show that smart-city construction promotes GTFP mainly through accelerating technological innovation. Therefore, the governments in China should continuously strengthen the construction of digital information infrastructures, such as the Internet of Things, big data, and AI, thus releasing the innovation dividend of new infrastructure construction. Furthermore, it is essential to improve the innovation incentive furtherly and assessment mechanism and provide more incentives and autonomy to science and technology workers to stimulate their innovation initiative and enthusiasm. Third, the governments in China should rely on the advantages of smart-city pilot policy, and consistently promote the upgrading of industrial structures. For highly polluting and energy-intensive enterprises, it is necessary to guide them to change their traditional production methods and increase investment in green technology innovation. For regional leading enterprises, it is necessary to encourage them to play a leading demonstration effect in green and digital transformation. Moreover, the government should make full use of big data, cloud computing, and other information technology in the progress of smart-city construction to promote the transformation of industrial development towards intelligence, and continuously breed ‘Internet +’, smart industry, smart services, and other new industries, and then achieve industrial restructuring and upgrading.
Disclosure statement
No potential conflict of interest was reported by the authors.
Additional information
Funding
Notes
1 Data source:China Statistical Yearbook 2021.
2 If possible,given the timely update of data from listed companies, future analysis of the impact of smart city policies on TFP of firms based on microdata could be conducted over a more extended period,including the shocks of COVID-19 and the Russian-Ukrainian War.
3 The pollutant composite index is obtained by summing up the initial data of three pollutants after standardization.
4 The nearest neighbor matching is 1:1, the radius of radius matching is set to 0.01, and the kernel matching defaults to the quadratic kernel with a bandwidth of 0.01.
References
- Ahvenniemi, H., Huovila, A., Pinto-Seppä, I., & Airaksinen, M. (2017). What are the differences between sustainable and smart cities? Cities, 60, 234–245. https://doi.org/10.1016/j.cities.2016.09.009
- Albino, V., Berardi, U., & Dangelico, R. M. (2015). Smart cities: Definitions, dimensions, performance, and initiatives. Journal of Urban Technology, 22(1), 3–21.https://doi.org/10.1080/10630732.2014.942092
- Angelidou, M. (2017). The role of smart city characteristics in the plans of fifteen cities. Journal of Urban Technology, 24(4), 3–28. https://doi.org/10.1080/10630732.2017.1348880
- Appio, F. P., Lima, M., & Paroutis, S. (2019). Understanding Smart Cities: Innovation ecosystems, technological advancements, and societal challenges. Technological Forecasting and Social Change, 142, 1–14. https://doi.org/10.1016/j.techfore.2018.12.018
- Beck, T., Levine, R., & Levkov, A. (2010). Big bad banks? The winners and losers from bank deregulation in the United States. The Journal of Finance, 65(5), 1637–1667. https://doi.org/10.1111/j.1540-6261.2010.01589.x
- Bustos, P. (2011). Trade liberalization, exports, and technology upgrading: Evidence on the impact of MERCOSUR on Argentinian firms. American Economic Review, 101(1), 304–340. https://doi.org/10.1257/aer.101.1.304
- Caragliu, A., & Del Bo, C. F. (2019). Smart innovative cities: The impact of Smart City policies on urban innovation. Technological Forecasting and Social Change, 142, 373–383. https://doi.org/10.1016/j.techfore.2018.07.022
- Chu, Z., Cheng, M., & Yu, N. N. (2021). A smart city is a less polluted city. Technological Forecasting and Social Change, 172, 121037. https://doi.org/10.1016/j.techfore.2021.121037
- Chung, Y. H., Färe, R., & Grosskopf, S. (1997). Productivity and undesirable outputs: a directional distance function approach. Journal of Environmental Management, 51(3), 229–240. https://doi.org/10.1006/jema.1997.0146
- De Chaisemartin, C., & d’Haultfoeuille, X. (2020). Two-way fixed effects estimators with heterogeneous treatment effects. American Economic Review, 110(9), 2964–2996. https://doi.org/10.1257/aer.20181169
- Dewan, S., & Kraemer, K. L. (2000). Information technology and productivity: Evidence from country-level data. Management Science, 46(4), 548–562. https://doi.org/10.1287/mnsc.46.4.548.12057
- Eger, J. M. (2009). Smart growth, smart cities, and the crisis at the pump a worldwide phenomenon. I-WAYS-The Journal of E-Government Policy and Regulation, 32(1), 47–53. https://dl.acm.org/doi/abs/10.5555/1552005.1552016
- Gao, K., & Yuan, Y. (2022). Is the sky of smart city bluer? Evidence from Satellite Monitoring Data.Journal of Environmental Management, 317, 115483. https://doi.org/10.1016/j.jenvman.2022.115483
- Gibson, D. V., Kozmetsky, G., & Smilor, R. W. (Eds.). (1992). The technopolis phenomenon: Smart cities, fast systems, global networks. Rowman & Littlefield.
- Giffinger, R., & Gudrun, H. (2010). Smart cities ranking: An effective instrument for the positioning of the cities? ACE: Architecture, City and Environment, 4(12), 7–26. https://doi.org/10.5821/ace.v4i12.2483
- Gust, C., & Marquez, J. (2004). International comparisons of productivity growth: The role of information technology and regulatory practices. Labour Economics, 11(1), 33–58. https://doi.org/10.1016/S0927-5371(03)00055-1
- Jamil, M. S., Jamil, M. A., Mazhar, A., Ikram, A., Ahmed, A., & Munawar, U. (2015). Smart environment monitoring system by employing wireless sensor networks on vehicles for pollution free smart cities. Procedia Engineering, 107, 480–484. https://doi.org/10.1016/j.proeng.2015.06.106
- Jiang, H., Jiang, P., Wang, D., & Wu, J. (2021). Can smart city construction facilitate green total factor productivity? A quasi-natural experiment based on China’s pilot smart city. Sustainable Cities and Society, 69, 102809. https://doi.org/10.1016/j.scs.2021.102809
- Kandt, J., & Batty, M. (2021). Smart cities, big data and urban policy: Towards urban analytics for the long run. Cities, 109, 102992. https://doi.org/10.1016/j.cities.2020.102992
- Kourtit, K., Nijkamp, P., & Arribas, D. (2012). Smart cities in perspective–a comparative European study by means of self-organizing maps. Innovation: The European Journal of Social Science Research, 25(2), 229–246. https://doi.org/10.1080/13511610.2012.660330
- Lee, J. H., Hancock, M. G., & Hu, M. C. (2014). Towards an effective framework for building smart cities: Lessons from Seoul and San Francisco. Technological Forecasting and Social Change, 89, 80–99. https://doi.org/10.1016/j.techfore.2013.08.033
- Li, B., & Wu, S. (2017). Effects of local and civil environmental regulation on green total factor productivity in China: A spatial Durbin econometric analysis. Journal of Cleaner Production, 153, 342–353. https://doi.org/10.1016/j.jclepro.2016.10.042
- Li, P., Lu, Y., & Wang, J. (2016). Does flattening government improve economic performance? Evidence from China. Journal of Development Economics, 123, 18–37. https://doi.org/10.1016/j.jdeveco.2016.07.002
- Lu, Y., Tao, Z., & Zhu, L. (2017). Identifying FDI spillovers. Journal of International Economics, 107, 75–90. https://doi.org/10.1016/j.jinteco.2017.01.006
- Meijer, A., & Thaens, M. (2018). Urban technological innovation: Developing and testing a sociotechnical framework for studying smart city projects. Urban Affairs Review, 54(2), 363–387. https://doi.org/10.1177/1078087416670274
- Neirotti, P., De Marco, A., Cagliano, A. C., Mangano, G., & Scorrano, F. (2014). Current trends in Smart City initiatives: Some stylised facts. Cities, 38, 25–36. https://doi.org/10.1016/j.cities.2013.12.010
- Nikitas, A., Michalakopoulou, K., Njoya, E. T., & Karampatzakis, D. (2020). Artificial intelligence, transport and the smart city: Definitions and dimensions of a new mobility era. Sustainability, 12(7), 2789. https://doi.org/10.3390/su12072789
- Papa, R., Gargiulo, C., & Galderisi, A. (2013). Towards an urban planners’ perspective on Smart City. TeMA Journal of Land Use, Mobility and Environment, 6(01), 5–17. https://doi.org/10.6092/1970-9870/1536
- Qin, M., Su, C. W., Zhong, Y., Song, Y., & Oana-Ramona, L. Ţ. (2022). Sustainable finance and renewable energy: Promoters of carbon neutrality in the United States. Journal of Environmental Management, 324, 116390. https://doi.org/10.1016/j.jenvman.2022.116390
- Song, M., Tan, K. H., Wang, J., & Shen, Z. (2022). Modeling and evaluating economic and ecological operation efficiency of smart city pilots. Cities, 124, 103575. https://doi.org/10.1016/j.cities.2022.103575
- Su, C. W., Li, W., Umar, M., & Lobonţ, O. R. (2022). Can green credit reduce the emissions of pollutants? Economic Analysis and Policy, 74, 205–219. https://doi.org/10.1016/j.eap.2022.01.016
- Su, C. W., Pang, L. D., Tao, R., Shao, X., & Umar, M. (2022). Renewable energy and technological innovation: Which one is the winner in promoting net-zero emissions? Technological Forecasting and Social Change, 182, 121798. https://doi.org/10.1016/j.techfore.2022.121798
- Tao, R., Su, C. W., Naqvi, B., & Rizvi, S. K. A. (2022). Can Fintech development pave the way for a transition towards low-carbon economy: A global perspective. Technological Forecasting and Social Change, 174, 121278. https://doi.org/10.1016/j.techfore.2021.121278
- Tone, K. (2001). A slacks-based measure of efficiency in data envelopment analysis. European Journal of Operational Research, 130(3), 498–509. https://doi.org/10.1016/S0377-2217(99)00407-5
- Tone, K., & Tsutsui, M. (2010). An epsilon-based measure of efficiency in DEA–a third pole of technical efficiency. European Journal of Operational Research, 207(3), 1554–1563. https://doi.org/10.1016/j.ejor.2010.07.014
- Wang, J., & Deng, K. (2022). Impact and mechanism analysis of smart city policy on urban innovation: Evidence from China. Economic Analysis and Policy, 73, 574–587. https://doi.org/10.1016/j.eap.2021.12.006
- Winters, J. V. (2011). Why are smart cities growing? Who moves and who stays. Journal of Regional Science, 51(2), 253–270. https://doi.org/10.1111/j.1467-9787.2010.00693.x
- Xia, F., & Xu, J. (2020). Green total factor productivity: A re-examination of quality of growth for provinces in China. China Economic Review, 62, 101454. https://doi.org/10.1016/j.chieco.2020.101454
- Xin, B., & Qu, Y. (2019). Effects of smart city policies on green total factor productivity: Evidence from a quasi-natural experiment in China. International Journal of Environmental Research and Public Health, 16(13), 2396. https://doi.org/10.3390/ijerph16132396
- Xu, N., Ding, Y., & Guo, J. (2022). Do Smart City policies make cities more innovative: Evidence from China. Journal of Asian Public Policy, 15(1), 1–17. https://doi.org/10.1080/17516234.2020.1742411
- Yigitcanlar, T., & Kamruzzaman, M. (2018). Does smart city policy lead to sustainability of cities? Land Use Policy, 73, 49–58. https://doi.org/10.1016/j.landusepol.2018.01.034
- Zawieska, J., & Pieriegud, J. (2018). Smart city as a tool for sustainable mobility and transport decarbonisation. Transport Policy, 63, 39–50. https://doi.org/10.1016/j.tranpol.2017.11.004