
 ?Mathematical formulae have been encoded as MathML and are displayed in this HTML version using MathJax in order to improve their display. Uncheck the box to turn MathJax off. This feature requires Javascript. Click on a formula to zoom.
Abstract
A sustainable economy is a complex issue related to economic, social and environmental areas. For European Union (E.U.) countries, it is closely linked to the issues of sustainable industry, infrastructure and innovation in R&D. Thus, the article is specifically focused on identifiers of Sustainable Development Goal 9 (S.D.G. 9) created by E.U. To meet the main targets based on sustainable development and The European Green Deal strategy, it is necessary to have an idea of the possible future development of the S.D.G. 9 indicators. The main aim of this article is to create a semi-deep prediction model using cluster analysis and fuzzy approach. The contribution of this article is the use of a fuzzy approach to create a multivariate prediction model that allows to circumvent the limitations of classical regression analysis. The E.U. countries were divided into five clusters. A semi-deep prediction model was created for each cluster using fuzzy approach.
JEL CODES:
1. Introduction
Sustainable development forms one of the main pillars of the European Union (E.U.). Sustainable development goals (S.D.G.s) have been anchored in European policy for a long time. The 2030 Agenda for Sustainable Development created by the E.U. includes the set of 17 S.D.G.s and their related 169 targets.
The ninth S.D.G. 9 is focused on industry, innovation and infrastructure. Sustainable industrialisation is the key factor that improves standards of living of all people and reduces poverty. Innovation is a core driver for finding lasting solutions. Technical progress and innovation enhance the social, economic and ecological environment of human beings.
Green innovations include ecological and environmental aspects (Franceschini et al., Citation2016). As innovation, the concept implies new initiatives, changes, approaches or proposals dealing with social challenges as well (Sánchez-Martínez et al., Citation2020). Sustainable and digital innovation occurs in different fields such as products, processes and services. The aim of sustainable innovation is to decrease environmental impact (Schiederig et al., Citation2012). Ecological aspect is connected with the term eco-efficiency. Eco-efficiency is striving to add maximum value with the minimum use of resources and minimum pollution (Welford & Casagrande, Citation1997). Green industry will form tahe future technologies in manufacturing and will generate high added value solutions. (Stock & Seliger, Citation2016). These solutions will have a significant impact on economy and ecology. From an ecological point of view the allocation of resources such as materials, energy or water will be possible to realise more efficiently (Kagermann et al., Citation2015). Moreover, digital transformation and green industry has a great potential to improve social dimension of mankind. The core idea of green industry and digital transformation is to improve the deteriorating economic, ecological and social conditions in the world by using new industrial technologies and integrating more efficient processes (Stock & Seliger, Citation2016).
Climate change and environmental degradation pose an existential threat to Europe. The E.U.’s response has been to create the European Green Deal, a comprehensive strategy that effectively addresses the impacts of climate change and environmental degradation (Fetting, Citation2020). The main objectives of the European Green Deal include no net greenhouse gas emissions by 2050 and economic growth decoupled from resource use (Gautier et al., Citation2022). The cooperation across E.U. countries is necessary to overcome these challenges. It will be necessary for European countries to invest massively in green innovation and infrastructure development and ensure the most efficient allocation of resources. It can be assumed that some E.U. countries are better able to meet the objectives of The European Green Deal and can transfer their experience to other European countries. Based on this assumption, the following research question was established:
1.1. Are there any differences in the development of individual S.D.G. 9 variables across E.U. countries?
In order to answer this question, it is necessary to identify differences between countries and develop prediction models. Cluster analysis can be used to identify differences between countries. One way to formulate a prediction model given the uncertainty of the input data is to use probability theory and statistical methods. A widely used statistical method in these cases is regression analysis.
The unilateral dependence of one variable on other variables is called multivariate regression. Then the dependence of the mean value of the dependent variable on the values of the independent variables is expressed by a regression function/model. In cases where the observed variables are represented by time series, the regression results may be biased by the presence of a trend in these time series, the dependence between the observed variables, and the volatility of the variance. This is referred to as autocorrelation, multicollinearity, and heteroskedasticity. Moreover, if multiple regression were to be used to describe the dependence of one of the observed variables on the remaining variables (as in this article), this would imply the creation of several separate models (for each observed variable) (Fumo & Biswas, Citation2015; Qi & Roe, Citation2016).
Another way to work with uncertainty is to use fuzzy set theory and fuzzy logic. Fuzzy logic is a multidimensional discipline that focuses on the problems of approximate inference and fuzzy approximation. This allows us to circumvent the limitations in the use of classical regression analysis and formulate a single model for all the observed variables. The issue of fuzzy sets and fuzzy logic, specifically fuzzy similarity, is discussed in the following part.
2. Theoretical framework
2.1. Sustainable industry
Sustainable industry is connected with the fourth stage of industrialisation called Industry 4.0. This stage builds on the third industrial revolution which began in the 1970s and its principal stones were electronics, information and communication technologies and automation (Winter, Citation2020). Sustainable industry is seen as the production of goods or services through the implementation of integration systems that support the optimisation of the efficiency of production systems based on quality data. The main goal is to create sustainable value and economic growth (Chauhan et al., Citation2021). Smart factories, smart products, smart services anchored in the Internet of things form Industry 4.0 (Kagermann et al., Citation2015). Smart industry and digitalisation of business allows to streamline the consumption of scarce resources, reduce waste, streamline the management of production systems, maximise outputs and minimise resource utilisation, reduce overproduction and save energy (Kamble et al., Citation2020). These solutions will have a significant impact on the economy and ecology. According to Kamble et al. (Citation2018) sustainable industry 4.0 framework consists of the following technologies – Internet of things, big data analytics, cloud computing, simulation and prototype, 3D printing, augmented reality and robotic systems. The framework takes into account that the integration of innovation, industrial and economic processes enable a more flexible, economical and environmentally-friendly manufacturing system (Duarte & Cruz-Machado, Citation2018).
2.2. Sustainable innovation
In the twenty-first century there has been an increasing interest in sustainable innovation (Aghion et al., Citation2009). It is mainly caused by numerous long term challenges such as climate change, water scarcity, pollution, population ageing, etc. (Montalvo et al., Citation2007). Sustainable innovation is defined as the activity of creating new ideas, behaviour, products, processes that enable the decrease of negative impacts on the environment and ecology (Rennings, Citation2000). Sustainable innovation includes green, ecological and environmental aspects (Franceschini et al., Citation2016). Sustainable innovation occurs in different fields such as products, processes, services and business models. Sustainable innovation takes into account the economic and ecological aspects. Ecological aspect is connected with the term eco-efficiency. Norberg-Bohm (Citation1999) regards environmental innovation as the reduction of ecological impact through waste minimisation. However, sustainable innovation has to be understood in a broader sense. For instance, new products could not only reduce the environmental burden but also improve human life factors. Sustainable innovation also contains new markets and new systems, for example, new means of transport (Blättel-Mink, Citation1998). Sustainable innovation also contains a social aspect and tries to find the solutions for social challenges. New technologies based on sustainable innovation concepts have a high impact on the daily life of society and the standard of living of the population. Technological innovation has to be encouraged by an evolution of social and institutional structures (Freeman, Citation1996). In general, existing technologies are improved gradually. However, radical innovation is needed to achieve ecological, economical and social targets (Huesemann, Citation2003). Sustainable innovation often responds to complex challenges, which requires the development of complex solutions and therefore close relationships with a complex network of stakeholders are needed (Adams et al., Citation2016).
2.3. Sustainable infrastructure
The world is mainly urban and more than 50% of the population lives in urban areas (Diaz-Sarachaga et al., Citation2016). This number has been steadily increasing and it is expected that 70% of the global population will live in cities and towns by the year 2050 (Angel et al., Citation2012). The significance of urban areas is also proved by the emergence of new conglomerations with more than 20 million inhabitants (Berardi, Citation2015). The level of infrastructure is expected to rise all over the world in the next few years and decades. The thing is that all mankind has to strive to use the limited resources efficiently and protect the environment as a whole. This idea is the cornerstone of sustainable infrastructure. Sustainable infrastructure could be defined as a system that is able to last a long time, ensuring the human-build environment to flourish and enable human society to increase its quality of life without restricting availability of natural, economic and social assets for future generations (Hendricks et al., Citation2018). Predominantly, building and expanding cities represent the highest consumption of limited resources. Urbanisation is the principal engine of economic progress and building infrastructure significantly increases G.D.P. and investment. The efficient use of limited resources and sustainable infrastructure development can ensure economic growth, the protection of ecology and improvement of social welfare of human beings (Hendricks et al., Citation2018).
3. Materials and methods
Decision-making in the field of sustainable economies is linked to the study of real phenomena that require knowledge. The spectrum of knowledge about each phenomenon contains data of a diverse nature (deep and shallow). Shallow knowledge is obtained by non-numerical heuristics, qualitative interpretation of experiments, engineering intuition, etc. In an economy, time records are often used, which are traditionally used for time series analysis, and represent the most accurate information. Such a type of information is a typical example of shallow knowledge. Shallow knowledge is rather weak and very specific, but it is obtainable relatively easily. Shallow knowledge is transferred into a semi-deep oriented model through statistical methods. If there is a strong dependence between the input variables, the use of classical statistical methods is problematic.
3.1. Cluster analysis
Cluster analysis is a statistical method used for dividing a set of elements into clusters. Each group is homogeneous with respect to certain characters based on either the similarity or the dissimilarity metric. Therefore, cluster analysis is widely used as a suitable tool for marketing segmentation (Liu & Ong, Citation2008; Mentzer et al., Citation2004; van Raaij et al., Citation2003). Clustering differs from simple ordering in following terms: Simple ordering would be possible if the data were one-dimensional. But still, this procedure would not classify the data samples into classes. Nevertheless, more-dimensional cases cannot be simply ordered, because the decision-maker would have to choose the pivot dimension and omit the rest. If all the dimensions should be taken into account, then some kind of aggregate function would have to be employed. Such function could be arbitrary, for instance linear, i.e.:
(1)
(1)
where the coefficients were chosen by the user or by the character of j-th dimension data range. But such function is already included in Ward’s clustering method.
Hierarchical clustering algorithms were developed to avoid some disadvantages in terms of flat or partition-based clustering approaches. Partial methods in general need a user predefined parameter K to gain a clustering solution and so they are nondeterministic. Hierarchical algorithms were developed in order to create more deterministic and flexible attitude for data clustering (Jain et al., Citation1999).
A cluster hierarchy uses the standard binary tree terminology. The roots include all the sets of data objects for clustering and thus the apex of hierarchy is formed. The entries in each cluster could be defined by traversing the tree from the current cluster to the base singleton data points. Every level in the hierarchy equals some amount of clusters. The hierarchical base contains all singleton points which create the leaves of the tree. This hierarchy of clusters is called dendrogram. The biggest advantage of the hierarchical clustering method is the fact that it is possible to cut the hierarchy at any given level and to get the number of clusters correspondingly (Aggarwal & Reddy, Citation2018). There are two general proposals for hierarchical clustering:
Agglomerative – It is a bottom up approach where each observation begins in its own cluster, and pairs of clusters are merged on until the final maximal cluster is obtained.
Divisive – It is a top down approach where all observations begin in one cluster, and splits are done recursively as it moves down the hierarchy (Maimon et al., Citation2005).
One of the basic marketing concepts is the concept of segmentation, i.e., classification of segmented subjects into groups according to their similarity of attributes. This concept however does not possess particular mathematical representation. On the other hand, there is a well elaborated concept of clustering, which is analogical to segmentation. When the problem of classification is tackled, having only a raw data set of n dimensions (n ≥ 1), there has to be metrics (or criterion), which determine the size and the composition of classes (or clusters). The metrics decide whether various data samples within the data set are close to each other enough, in respect to n dimensions, to be classified as members of the same class. Such metrics are included in Ward’s method.
The Ward’s criterion was chosen to be used within the article. The advantage of Ward’s criterion is that it produces a cluster tree that is compact and monotonic. It is caused by its incremental design in the definition of distance and it means (in contrast of non-monotonic tree) that the sections of the dendrogram do not change direction (Alikhanian et al., Citation2013). The Ward‘s criterion was suggested to figure out the distance between two clusters within the agglomerative hierarchy clustering method. The K-means sum of squared error criterion is used to determine the distance. Sum of squared error criterion for any two clusters Ca and Cb is computed by measuring the increase in the value of Ward’s criterion for the clustering gained by merging them into Ca ∪ Cb (Ward, Citation1963). There are few implementations of Ward’s criterion which differ in distance metric δ.
The distance metric used in this article is defined as the squared Euclidean distance between the two centroids of the merged clusters Ca and Cb weighted by a proportional factor to the product of cardinalities of the merged clusters (Aggarwal & Reddy, Citation2018) and is defined as follows:
(2)
(2)
and
are the cardinalities of the cluster Ca and Cb.
and
are elements of
and
respectively.
iterates up to total number of elements in cluster union
is squared Euclidean distance between the two centroids.
3.2. Fuzzy theory
Fuzzy set theory is based on the premise that the key elements in human thinking are not numbers but words. The most important feature of human thinking is the ability to extract from a mass of input data only such items of knowledge which are relevant to the solved task. The theory of fuzzy sets allows the existence of a type of uncertainty due to vagueness, e.g., Dubois et al. (Citation1999, Citation2014) and Zadeh (Citation1965).
A linguistic value is a ‘value’ that is given by words, e.g., low, medium, high. To quantify expert knowledge a set of verbal values, i.e., a dictionary, is needed. For example, a ‘verbal dictionary’ could be the following set:
(3)
(3)
The fuzzy set A in U is a prescription (function) that assigns to each element x ∈ U a single number from [0, 1]. If an element x is assigned the number a in this way, then a is called the degree of membership of element a to A and is written a = A(x). The prescription of A is called the membership function and denoted by the symbol µ.
In the sense of the fuzzy set definition, the fuzzy set A is identified with its membership function.
The linguistic value is transformed into the fuzzy set by the specification of membership function.
Along with the definition, the interpretation of the meaning of ‘degree of membership’ is very important: The closer the value of µ(x) is to 1, the higher (also stronger) the membership of element x to a fuzzy set A, the closer the value of µ(x) is to 0, the lower (also weaker) the affiliation of element x to a fuzzy set A.
A fuzzy set can be specified in a variety of ways, but most often by a combination of verbal, graphical and mathematical descriptions. The specification must of course be correct, accurately describing the characteristics of the set of elements under consideration and the subjective idea of the user.
You can specify a fuzzy set using verbal, graphical and mathematical descriptions. The specification must of course be correct, accurately describing the characteristics of the set of elements under consideration and the subjective idea of the user. Often a graphical description is just used in a computer software, e.g., Matlab, Scilab, Octave and Julia.
For example, a verbal value around 5 °C of the variable temp is transformed into a fuzzy set 5 C by the grade of membership function μ given in .
Figure 1. Membership function.
Source: own processing.
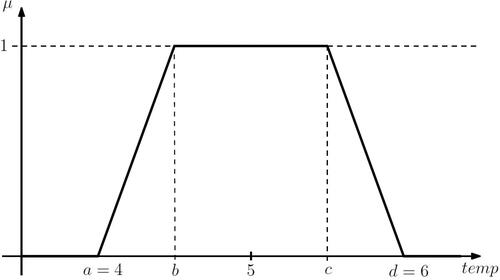
The intervals a < temp < b, c < temp < d represent such numerical values temp, which belong partially to the fuzzy set 5 C.
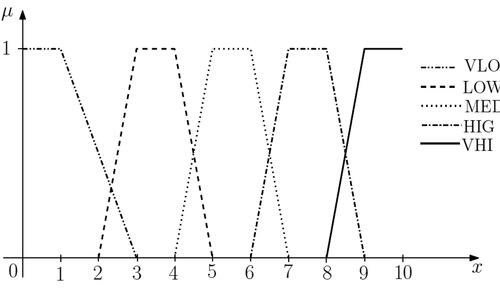
For example, the graphical description of the fuzzy set A defined by the verbal dictionary is shown in .
Figure 2. Fuzzy set A.
Source: own processing.
3.3. Fuzzy description of time series
A time behaviour of a system under study, e.g., a performance of a country’s economics, is described in a digitised form. It means that a sample period is chosen if the frequency is too high (e.g., currency exchange rates) or unemployment rates and inflation values are evaluated on monthly bases and not daily, for example. Each variable has Z different numerical values for Z sample intervals. The example given below illustrates the usage of super and subscripts:
(4)
(4)
The observation is either not accurate or, more likely, its relevance of this observation exceeds its accuracy. The triangle shape grade of membership is often used to characterise the fuzziness of the corresponding observation. In other words each observation is fuzzyfied by a triplet of numerical values a, b = c, d (see ). The meaning of the triplet is as follows:
b = c—a numerical value of observation,
(5)
(5)
where the accuracy ε reflects not only the actual accuracy of the information item but the fact that each observation is always partially specific/local and partially of general significance.
A time window length is a number of sample intervals. If numerical values are known within L sample intervals then a correct (not bad) choice of the decision variable D can be made by the experienced human managers. Let us suppose that the system under study is (partially) controlled by an experienced controller, e.g., by a group of top experts. Their experience allows them to evaluate fairly accurately the length L of a time window.
The general form of the simple conditional statement is:
(6)
(6)
where A is a multidimensional set and B is a decision or output variable(s).
The time series can be used to generate many statements (EquationEquation [6](6)
(6) ) keeping in mind that only sequences of L observations are required to make a decision or to reason.
(7)
(7)
where an ‘layman interpretation’ of the symbol ∧ is fuzzy ‘and’.
The length of the time window is L. The total length of time series is Z. Therefore:
(8)
(8)
statements like (EquationEquation [7](7)
(7) ) can be easily created to generate the required set of conditional statements.
If a set of conditional statements is available, the fuzzy reasoning can be used to answer different queries. It means that the fuzzy model represented by a set of conditional statements can be used in a similar way as a conventional mathematical model.
The set of statements (EquationEquation [7](7)
(7) ) is a fuzzy model. There are many different fuzzy reasoning algorithms how to solve this fuzzy model. Transparency and simplicity of the reasoning algorithm is important for practical use and result interpretation.
A transparent fuzzy reasoning/answering formalism:
(9)
(9)
is based on fuzzy similarity. A set R of fuzzy sets and similarities is an answer to a given (chosen) n-dimensional fuzzy query Q, see (Schüller & Doubravský, Citation2019).
A similarity s of two n-dimensional fuzzy sets V, W is:
(10)
(10)
where j = 1, 2, …, n and xj is a concrete value of a monitored variable Xj.
The similarity s ∈ [0;1], s = 0 means there is no similarity of the fuzzy sets V a W, s = 1 means there is 100% similarity, i.e., the fuzzy sets V and W are identical see (Pavláková Dočekalová et al., Citation2017).
Defuzzification is a special operation that transforms a fuzzy set R into a specific number. The most commonly used defuzzification method is the Centre of Gravity (C.O.G.) method.
(11)
(11)
The resulting value represents the position of the C.O.G. of the area that defines the graphical representation of the degree of membership.
4. Results and discussion
The ninth S.D.G.s of the E.U. includes industry, innovation and infrastructure sector. Sustainable industrialisation is the key factor that improves standards of living of all people and reduces poverty. Innovation is a core driver for finding lasting solutions. Technical progress and innovation enhance the social, economic and ecological environment of human beings. Monitoring S.D.G. 9 in an E.U. context aims to make progress in strengthening research and development (R&D), innovation and in promoting sustainable transport. S.D.G. 9 includes seven variables that the statistical office of the European Union (E.U.R.O.S.T.A.T.) monitors. The variables are presented in .
Table 1. Observed variables.
For the purpose of this article, data of before mentioned variables have been used for 23 E.U. countries, see . Bulgaria, Cyprus, Malta and Romania, which are also E.U. states, had to be excluded due to missing data for some variables. The data dates from 2004 to 2019 from EUROSTAT.
In the first phase, all states had to be ranked according to the results of the seven variables before mentioned. For the first variable (CO2 emissions), the lowest-emission state was the best-rated. For the other six variables, on the other hand, the countries with the highest values were the best rated. The countries were then ranked from best to worst by each variable. shows the ranking of countries for each variable.
Table 2. Ranking of countries.
Based on the rankings obtained for each variable, the total order of the states was calculated using the arithmetic mean.
In the second phase, a hierarchical cluster analysis was used to further understand the data collected and to identify possible strategies for sustainable development for each cluster. The Ward’s criterion was suggested to figure out the distance between two clusters within the agglomerative hierarchy clustering method. The K-means sum of squared error criterion is used to determine the distance. The advantage of Ward’s criterion is that it produces a cluster tree that is compact and monotonic (Alikhanian et al., Citation2013). All seven variables of the data set were standardised to a range of [0, 1]. Five clusters were identified as an appropriate number at the rescaled distance 4. Moreover, this number of clusters allows logical breakdown of countries from a geo-economic perspective. shows the membership of each country to each cluster.
Table 3. Cluster membership for each country.
4.1. Cluster 1
This cluster is formed by the following countries – Austria, Germany, Finland and Sweden. These countries belong to the E.U. and are considered to be very high-income economies. Austria, Finland and Sweden can be classified as high performers in waste management, especially globally (Wilson et al., Citation2015). Germany is also able to handle urban household solid waste very well and is continuously trying to improve its waste management (Azevedo et al., Citation2021). These countries also invest heavily in research and development and are able to apply for an above-average number of patents by the European Patent Office.
4.2. Cluster 2
This cluster includes the highest number of countries. Ireland, Luxembourg, Denmark, Belgium, France, the Netherlands and Slovenia belong to developed countries with high G.D.P. per capita (Worldbank, 2021). All countries except Denmark belong to the eurozone and thus have a common monetary policy. All the countries that make up Benelux belong to this cluster, reflecting their similar policies on sustainable innovation. Luxembourg and Denmark invest the most in technology, research and development of all the countries surveyed. Economic growth per capita in the eurozone is significantly influenced by innovation and entrepreneurship and vice versa (Pradhan et al., Citation2020).
4.3. Cluster 3
This cluster consists of the following countries – Estonia, Latvia and Lithuania. These three states have similar geo-economic characteristics and belong to the Baltic States. These states are both members of the E.U. and the eurozone. They are regarded as high-income economies by the World Bank and are also members of the Organisation for Economic Co-operation and Development. The important areas of cooperation among the Baltic States are energy, innovations, transportation and infrastructure (Kropinova, Citation2021).
4.4. Cluster 4
Cluster 4 contains countries that belong to the Visegrád Group, which is a cultural and political alliance of four countries of Central Europe – Czech Republic, Hungary, Poland and Slovakia. These states work together primarily in the economic sphere (Ivanová & Masárová, Citation2018). Visegrad Group co-operates predominantly in the field of information, energy infrastructure, information infrastructure, transport infrastructure, science and education (Khúlová & Šprochová, Citation2016). All the activities of the group focus on strengthening stability in the Central European region. Under the Regional Partnership, the V4 works with Austria, Germany and Slovenia.
4.5. Cluster 5
This cluster includes countries located in the southern part of Europe. Specifically, they are Croatia, Greece, Italy, Portugal and Spain. These countries are situated around the Mediterranean Sea and form a popular tourist region. This has a positive effect on their economy (Ren et al., Citation2019). These countries work together on energy infrastructure and electricity generation. This is primarily a transition to renewable energy production with a focus on increasing the G.D.P. of these countries (Esseghir & Khouni, Citation2014; Kagiannas et al., Citation2003).
For each cluster, a fuzzy description of the time series of each variable is used. For each cluster, a set of statements is created (Equation [7]). Each time series value was fuzzified by Equation (5). The value of b = c corresponds each measured value. The accuracy ε corresponds to the standard deviation of each observed variable. These values were chosen because the resulting fuzzy model gave consistent results. Predictions of indicators calculated for each cluster based on fuzzy similarities are shown in the following tables ().
Table 4. Predictions for cluster 1 countries.
Table 5. Predictions for cluster 2 countries.
Table 6. Predictions for cluster 3 countries.
Table 7. Predictions for cluster 4 countries.
Table 8. Predictions for cluster 5 countries.
For countries in cluster 1 (see ), there is a gradual decline in the variables X1–X3 (Average CO2 emissions per km from new passenger cars, Gross domestic expenditure on R&D, Human resources in science and technology).
The X4 (Patent applications to the European Patent Office) variable tends to stagnate. In contrast, for variables X5–X7 (R&D personnel by sector of all active population, Share of busses and trains in total passenger transport, Share of rail and inland waterways in total freight transport) a gradual increase is predicted.
For countries in the second cluster, the variables X1 (Average CO2 emissions per km from new passenger cars), X4 (Patent applications to the European Patent Office) and X7 (Share of rail and inland waterways in total freight transport) are slightly increasing. Variables X2 (Gross domestic expenditure on R&D), X3 (Human resources in science and technology), X5 (R&D personnel by sector of all active population) and X6 (Share of busses and trains in total passenger transport) stagnate.
In the third cluster, the variables X2 (Gross domestic expenditure on R&D), X3 (Human resources in science and technology), X5 (R&D personnel by sector of all active population) and X6 (Share of buses and trains in total passenger transport) decrease slightly. The variable X4 (Patent applications to the European Patent Office) on the other hand, increases. Variables X1 (Average CO2 emissions per km from new passenger cars) and X7 (Share of rail and inland waterways in total freight transport) stagnate.
In a cluster 4 variables X4 (Patent applications to the European Patent Office), X6 (Share of busses and trains in total passenger transport) and X7 (Share of rail and inland waterways in total freight transport) a gradual decline is predicted. Variable X1 (Average CO2 emissions per km from new passenger cars) is predicted to stagnate. Variables X2 (Gross domestic expenditure on R&D), X3 (Human resources in science and technology), X5 (R&D personnel by sector of all active population) are predicted to have a gradually increasing trend.
In cluster 5, the variables X1 (Average CO2 emissions per km from new passenger cars) X2 (Gross domestic expenditure on R&D), X3 (Human resources in science and technology), X5 (R&D personnel by sector of all active population) and X6 (Share of busses and trains in total passenger transport) and X7 (Share of rail and inland waterways in total freight transport) have a slightly decreasing trend. and X4 (Patent applications to the European Patent Office) are predicted to be stagnant.
In relation to the research question (Are there any differences in the development of individual S.D.G. 9 variables across E.U. countries?), it is clear from the result of the cluster analysis of the prediction of each variable using the fuzzy approach that there are differences between the E.U. countries. Each cluster of countries shows a slight increase, decrease or stagnation in some variables. However, the clusters differ from one another.
Countries in the first and fifth cluster are succeeding in reducing CO2 emissions, which is one of the objectives of The European Green Deal. For the second and third cluster of countries, the increasing trend for the variable – Patent applications to the European Patent Office will have positive effect to economic development, which is another objective of the E.U. within Grean Deal strategy. In the cluster 4 the variables – Gross domestic expenditure on R&D, Human resources in science and technology and R&D personnel by sector of all active population are predicted to have a gradually increasing trend, which will support economic growth decoupled from resource use in Europe.
5. Conclusion
A sustainable economy is a complex issue related to economic, social, and environmental areas. Sustainable development is one of the main pillars of the E.U. and it has been anchored in European policy for a long time. For the countries of the E.U., it is closely linked to the issues of sustainable industry, sustainable infrastructure, innovation and investment in R&D. The main target of this article was to use the fuzzy approach to create a semi-deep predictive model. This approach was demonstrated by predicting the evolution of sustainable development identifiers for E.U. countries.
For countries in cluster 1, there is a gradual decline in the human resources in science and technology, R&D personnel by sector of all active population and gross domestic expenditure on R&D. Countries in cluster 1 should increase overall investment in R&D because of the geopolitical situation in Europe, which has a major impact on energy and security sector. These countries are able to respond very flexibly to energy, security and other challenges and can stimulate other E.U. states to invest more in research and development as well.
For countries in the second cluster, the variables human resources in science, average CO2 emissions per km from new passenger cars and share of rail and inland waterways in total freight transport are slightly increasing. A problematic area is CO2 emissions, where countries within cluster 2 should strive to take measures that will lead to a downward trend because European Commission plans to meet 55% emission reduction by 2030 and to set the carbon neutrality by 2050.
In the third cluster, the variables gross domestic expenditure on R&D, human resources in science and technology, R&D personnel by sector of all active population and share of buses and trains in total passenger transport are slightly decreasing. Baltic states ought to invest more into research and development and also into the infrastructure and thus support an increase in G.D.P.
In a cluster of 4 variables share of busses and trains in total passenger transport and share of rail and inland waterways in total freight transport are predicted to decline. The countries that belong to the Visegrád Group should invest more in public transport infrastructure. These states are predicted to have a gradually increasing trend in gross domestic expenditure on R&D, human resources in science and technology and R&D personnel by sector of all active population. These countries should invest as much as possible in research and development to boost their economic performance.
In cluster 5, the variables gross domestic expenditure on R&D, gross domestic expenditure on R&D, human resources in science and technology, R&D personnel by sector of all active population, share of busses and trains in total passenger transport and share of rail and inland waterways in total freight transport have a slightly decreasing trend. However, these countries are now forced to respond to the geopolitical situation caused mainly by the war in Ukraine. Therefore, it can be expected that the cluster 5 states will invest more in research and development as well as in infrastructure.
We are aware of the limits associated with prediction modelling. Variables of an extreme nature, such as the war in Ukraine, may enter the data for individual years. These kinds of variables can slow down or accelerate the development in sustainable innovation, industry and infrastructure.
It is possible to combine the above-mentioned fuzzy approach with trend modelling in cases where variables that are difficult to quantify (i.e., insufficiency in data, market sentiment or political situation), need to be included in the model.
Prediction of sustainable development in innovation, industry and infrastructure is also significant for macroeconomic analysis. The obtained results are an important basis for managerial decision-making in the economic field.
Future research will focus on creating semi-deep predictive model with the use of the fuzzy approach for the whole of Europe and other regions of the world such as North America (N.O.R.A.M.), Latin and South America (L.A.T.A.M.), the Middle East and Africa (M.E.A.) or Asia and the Pacific (A.P.A.C.). Further research will also focus on using a semi-deep predictive model in combination with shallow modelling, which may lead to more accurate prediction results. Today’s world is characterised by a turbulent and accelerating environment (e.g., COVID-19, climate change or the War in Ukraine). These aspects need to be taken into account in prediction models, where the use of Markov chains may be a suitable for future research.
Disclosure statement
No potential conflict of interest was reported by the authors.
Additional information
Funding
References
- Adams, R., Jeanrenaud, S., Bessant, J., Denyer, D., & Overy, P. (2016). Sustainability-oriented innovation: A systematic review. International Journal of Management Reviews, 18(2), 180–205. https://doi.org/10.1111/ijmr.12068
- Aggarwal, C. C., & Reddy, C. K. (2018). Data clustering: Algorithms and applications. CRC Press.
- Aghion, P., Veugelers, R., & Hemous, D. (2009). No green growth without innovation. Bruegel, Policy Briefs.
- Alikhanian, H., Crawford, J. D., DeSouza, J., Cheyne, D., & Blohm, G. (2013). Adaptive cluster analysis approach for functional localization using magnetoencephalography. Frontiers in Neuroscience, 7, 73. https://doi.org/10.3389/fnins.2013.00073
- Angel, S., Parent, J., Civco, D. L., & Blei, A. M. (2012). Atlas of urban expansion. Lincoln Institute of Lang Policy.
- Azevedo, B. D., Scavarda, L. F., Caiado, R. G. G., & Fuss, M. (2021). Improving urban household solid waste management in developing countries based on the German experience. Waste Management (New York, N.Y.), 120, 772–783. https://doi.org/10.1016/j.wasman.2020.11.001
- Berardi, U. (2015). Chapter 15—Sustainability assessments of buildings, communities, and cities. In J. J. Klemeš (Ed.), Assessing and measuring environmental impact and sustainability (pp. 497–545). Butterworth-Heinemann. https://doi.org/10.1016/B978-0-12-799968-5.00015-4
- Blättel-Mink, B. (1998). Innovation towards sustainable economy—The integration of economy and ecology in companies. Sustainable Development, 6(2), 49–58. https://doi.org/10.1002/(SICI)1099-1719(199808)6:2 < 49::AID-SD84 > 3.0.CO;2-I
- Chauhan, A., Jakhar, S. K., & Chauhan, C. (2021). The interplay of circular economy with industry 4.0 enabled smart city drivers of healthcare waste disposal. Journal of Cleaner Production, 279, 123854.
- Diaz-Sarachaga, J. M., Jato-Espino, D., Alsulami, B., & Castro-Fresno, D. (2016). Evaluation of existing sustainable infrastructure rating systems for their application in developing countries. Ecological Indicators, 71, 491–502. https://doi.org/10.1016/j.ecolind.2016.07.033
- Duarte, S., & Cruz-Machado, V. (2018). Exploring linkages between lean and green supply chain and the industry 4.0. In Proceedings of the Eleventh International Conference on Management Science and Engineering Management (pp. 1242–1252). https://doi.org/10.1007/978-3-319-59280-0_103
- Dubois, D., Fargier, H., Ababou, M., & Guyonnet, D. (2014). A fuzzy constraint-based approach to data reconciliation in material flow analysis. International Journal of General Systems, 43(8), 787–809. https://doi.org/10.1080/03081079.2014.920840
- Dubois, D., Prade, H., & Klement, E. P. (1999). Fuzzy sets, logics and reasoning about knowledge (Vol. 15). Springer Science & Business Media. ISBN 978-0792359777.
- Esseghir, A., & Khouni, L. (2014). Economic growth, energy consumption and sustainable development: The case of the Union for the Mediterranean countries. Energy, 71, 218–225. https://doi.org/10.1016/j.energy.2014.04.050
- Fetting, C. (2020, December). The European Green Deal. ESDN Report.
- Franceschini, S., Faria, L. G. D., & Jurowetzki, R. (2016). Unveiling scientific communities about sustainability and innovation. A bibliometric journey around sustainable terms. Journal of Cleaner Production, 127, 72–83. https://doi.org/10.1016/j.jclepro.2016.03.142
- Freeman, C. (1996). The greening of technology and models of innovation. Technological Forecasting and Social Change, 53(1), 27–39. https://doi.org/10.1016/0040-1625(96)00060-1
- Fumo, N., & Biswas, M. R. (2015). Regression analysis for prediction of residential energy consumption. Renewable and Sustainable Energy Reviews, 47, 332–343.
- Gautier, C., Tasca, A., & Vestad, T. K. (2022). Local expectations of the European Green Deal.
- Hendricks, M. D., Meyer, M. A., Gharaibeh, N. G., Van Zandt, S., Masterson, J., Cooper, J. T., & Berke, P. (2018). The development of a participatory assessment technique for infrastructure: Neighborhood-level monitoring towards sustainable infrastructure systems. Sustainable Cities and Society, 38, 265–274. https://doi.org/10.1016/j.scs.2017.12.039
- Huesemann, M. (2003). The limits of technological solutions to sustainable development. Clean Technologies and Environmental Policy, 5, 21–34. https://doi.org/10.1007/s10098-002-0173-8
- Ivanová, E., & Masárová, J. (2018). Performance evaluation of the Visegrad Group countries. Economic Research-Ekonomska Istraživanja, 31(1), 270–289. https://doi.org/10.1080/1331677X.2018.1429944
- Jain, A. K., Murty, M. N., & Flynn, P. J. (1999). Data clustering: A review. ACM Computing Surveys, 31(3), 264–323. https://doi.org/10.1145/331499.331504
- Kagermann, H., Lukas, W.-D., Schlüsseltechnolo, A., & Wahlster, W. (2015). Die „Väter “von Industrie 4.0. 1.
- Kagiannas, A. G., Askounis, D., Th., Anagnostopoulos, K., & Psarras, J. (2003). Energy policy assessment of the Euro-Mediterranean cooperation. Energy Conversion and Management, 44(16), 2665–2686. https://doi.org/10.1016/S0196-8904(03)00012-8
- Kamble, S., Gunasekaran, A., & Dhone, N. C. (2020). Industry 4.0 and lean manufacturing practices for sustainable organisational performance in Indian manufacturing companies. International Journal of Production Research, 58(5), 1319–1337.
- Kamble, S. S., Gunasekaran, A., & Gawankar, S. A. (2018). Sustainable Industry 4.0 framework: A systematic literature review identifying the current trends and future perspectives. Process Safety and Environmental Protection, 117, 408–425. https://doi.org/10.1016/j.psep.2018.05.009
- Khúlová, L., & Šprochová, L. (2016). Importance of TEN-T corridors in the development of infrastructure example of Visegrad group countries. Studia Commercialia Bratislavensia, 9(33), 49–57. https://doi.org/10.1515/stcb-2016-0005
- Kropinova, E. (2021). Transnational and cross-border cooperation for sustainable tourism development in the Baltic Sea Region. Sustainability, 13(4), 2111. https://doi.org/10.3390/su13042111
- Liu, H. H., & Ong, C. S. (2008). Variable selection in clustering for marketing segmentation using genetic algorithms. Expert Systems with Applications, 34(1), 502–510. https://doi.org/10.1016/j.eswa.2006.09.039
- Maimon, O., Maimon, O. Z., & Rokach, L. (2005). Data mining and knowledge discovery handbook. Springer Science & Business Media.
- Mentzer, J. T., Myers, M. B., & Cheung, M.-S. (2004). Global market segmentation for logistics services. Industrial Marketing Management, 33(1), 15–20. https://doi.org/10.1016/j.indmarman.2003.08.005
- Montalvo, C., Tang, P., Mollas-Gallart, J., Vivarelli, M., Marsilli, O., Hoogendorn, J., Butter, M., Jansen, G., & Braun, A. (2007). Driving factors and challenges for EU industry and the role of R&D and innovation. Institute for Prospective Technological studies (IPTS), Final Report SC06_05R&D Innovation, European Techno-Economic Policy Support Network (ETEPS AISBL).
- Norberg-Bohm, V. (1999). Stimulating ‘green’ technological innovation: An analysis of alternative policy mechanisms. Policy Sciences, 32(1), 13–38. https://doi.org/10.1023/A:1004384913598
- Pavláková Dočekalová, M., Doubravský, K., Dohnal, M., & Kocmanová, A. (2017). Evaluations of corporate sustainability indicators based on fuzzy similarity graphs. Ecological Indicators, 78, 108–114. https://doi.org/10.1016/j.ecolind.2017.02.038
- Pradhan, R. P., Arvin, M. B., Nair, M., & Bennett, S. E. (2020). The dynamics among entrepreneurship, innovation, and economic growth in the eurozone countries. Journal of Policy Modeling, 42(5), 1106–1122. https://doi.org/10.1016/j.jpolmod.2020.01.004
- Qi, D., & Roe, B. E. (2016). Household food waste: Multivariate regression and principal components analyses of awareness and attitudes among US consumers. PLoS One, 11(7), e0159250.
- Ren, T., Can, M., Paramati, S. R., Fang, J., & Wu, W. (2019). The impact of tourism quality on economic development and environment: Evidence from Mediterranean countries. Sustainability, 11(8), 2296. https://doi.org/10.3390/su11082296
- Rennings, K. (2000). Redefining innovation—Eco-innovation research and the contribution from ecological economics. Ecological Economics, 32(2), 319–332. https://doi.org/10.1016/S0921-8009(99)00112-3
- Sánchez-Martínez, J. D., Rodríguez-Cohard, J. C., Garrido-Almonacid, A., & Gallego-Simón, V. J. (2020). Social innovation in rural areas? The case of Andalusian olive oil co-operatives. Sustainability, 12(23), 10019.
- Schiederig, T., Tietze, F., & Herstatt, C. (2012). Green innovation in technology and innovation management – an exploratory literature review. R&D Management, 42(2), 180–192. https://doi.org/10.1111/j.1467-9310.2011.00672.x
- Schüller, D., & Doubravský, K. (2019). Fuzzy similarity used by micro-enterprises in marketing communication for sustainable development. Sustainability, 11(19), 5422. https://doi.org/10.3390/su11195422
- Stock, T., & Seliger, G. (2016). Opportunities of sustainable manufacturing in industry 4.0. Procedia CIRP, 40, 536–541. https://doi.org/10.1016/j.procir.2016.01.129
- van Raaij, E. M., Vernooij, M. J. A., & van Triest, S. (2003). The implementation of customer profitability analysis: A case study. Industrial Marketing Management, 32(7), 573–583. https://doi.org/10.1016/S0019-8501(03)00006-3
- Ward, J. H. (1963). Hierarchical grouping to optimize an objective function. Journal of the American Statistical Association, 58(301), 236–244. https://doi.org/10.1080/01621459.1963.10500845
- Welford, R., & Casagrande, E. (1997). Hijacking environmentalism: Corporate responses to sustainable development. Earthscan Publications Limited.
- Wilson, D., Rodic-Wiersma, L., Modak, P., Soós, R., Rogero, A., Velis, C., & Simonett, O. (2015). Global waste management outlook. United Nations Environment Programme (UNEP) and International Solid Waste Association (ISWA).
- Winter, J. (2020). The evolutionary and disruptive potential of Industrie 4.0. Hungarian Geographical Bulletin, 69(2), 83–97.
- Worldbank. (2022). GDP per capita, PPP (current international $) | Data. Retrieved May 17, 2022, from https://data.worldbank.org/indicator/NY.GDP.PCAP.PP.CD
- Zadeh, L. A. (1965). Fuzzy sets. Information and Control, 8(3), 338–353. https://doi.org/10.1016/S0019-9958(65)90241-X