
 ?Mathematical formulae have been encoded as MathML and are displayed in this HTML version using MathJax in order to improve their display. Uncheck the box to turn MathJax off. This feature requires Javascript. Click on a formula to zoom.
Abstract
The current study aims to analyze the influence of technological innovation, economic growth, tourism and renewable energy consumption on the carbon emissions in four South Asian economies covering the period 1990-2020. This study employed the cross-sectionally augmented autoregressive distributed lag model – a the third-generation estimator as it tackles the issues of slope heterogeneity, panel cross-section dependency, endogeneity, and stationarity. Also, this study uses the augmented mean group as a robustness test and Granger panel causality heterogeneity test. The results display that economic growth significantly enhances emissions level, whereas achievement of the threshold income level significantly reduces environmental degradation – validating the environmental Kuznets curve hypothesis in the region. Besides, tourism, renewable energy consumption, and technological innovation substantially reduces carbon emissions in the regions in short- and long-run. These findings are robust, and a bidirectional causal association exists between the explanatory variables and carbon emissions. The findings suggest policy concerning the adoption of renewable energy, considering industrial sector’s structural transformation, investment in technological innovation and promotion of tourism in the region.
JEL CODES:
1. Introduction
This research examines the environmental sustainability through tourism and economic growth, where the former is among the world’s biggest and most rapidly expanding sectors. Although being a substantial contributor to local and national economies throughout the world, tourism’s fast expansion has had an influence on worldwide emissions of greenhouse gases.
Industrialization is widely recognized as a significant contributor to global warming and, by extension, climate change, mostly owing to its growing demand for energy and intensities, which create a substantial quantity of carbon (CO2) emissions (Liu & Bae, Citation2018). Concerning the pre-industrialization period, Bernardini and Galli (Citation1993) argued that agriculture and associated activities, which have a lower energy intensity dominate the economy. Following this, the modernization process occurs, which resulted in a significant rise in CO2 emissions due to the fast expansion in energy and fuel consumption and demand and this trend is expected to continue (Hussain et al., Citation2020). At a certain point, the progress will shift the economy into one that is more contemporary and service-oriented; this is known as the post-industrialization period (Bernardini & Galli, Citation1993). As a vital service industry, the tourist industry would subsequently be anticipated to substitute for the industrial as well as agricultural sectors, resulting in decreased energy usage, energy intensity, and consequently CO2 emissions (Alam & Paramati, Citation2017). Numerous studies have looked into the impact of the tourist industry on emissions, (see, for instance Katircioglu, Citation2014; Zaman et al., Citation2016; Cavallaro et al., Citation2017; Azam et al., Citation2018). The economics of tourism must be included within a comprehensive social sciences paradigm to analyze tourism sustainability (Buckley, Citation2012; Song et al., Citation2012). According to the literature, tourism is a significant source of emissions (Gössling, Citation2013). However, there are country-specific differences in the consequences of tourism on pollution [such as Singapore vs Malaysia (Azam et al., Citation2018)], indicating the requirement for a broader thorough model and assessment methodology on this topic. Tourism, being a service industry, has a lower energy intensity compared to industrialization, and hence creates fewer emissions (Azam et al., Citation2018). In the meantime, Bernardini and Galli (Citation1993) stated that the organizational modifications that occur throughout the transition from pre-industrialization to industrial to post-industrialization result in ecologically beneficial approaches. Nevertheless, since technical advancement is inextricably linked to economic growth, which differs from country to country, the expansion of tourism might have varying consequences on global as well as regional emissions. This issue requires broader research of the impacts of tourism on emissions while specifically focusing on the emerging (the South Asian) economies that have immense importance in the field of global tourism, which can be seen in . Whereas the CO2 emission in these economies can be depicted in .
Figure 1. International tourist arrival to four South Asian economies (1995–2019).
Source: World Bank (Citation2022)
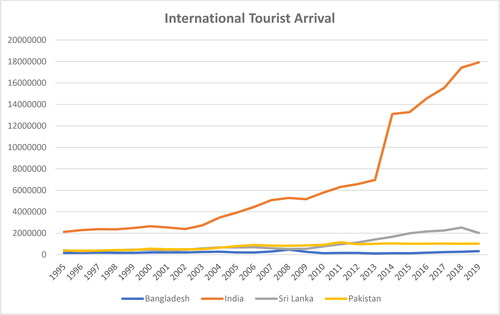
Figure 2. CO2 emissions from Four South Asian economies (1995–2019).
Source: World Bank (Citation2022)
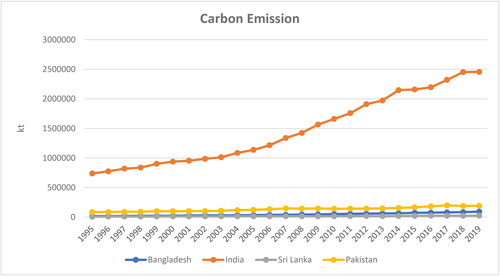
From the above-mentioned figures, it is noted that the tourism and CO2 emissions are both increasing since the last 25 years. Specifically, the average international tourist arrivals to four South Asian (Bangladesh, India, Pakistan, and Sri Lanka) economies were 3072000 in 1995, while it reached to 21285748.06 in 2019 and reports the annual tourist arrival of 8622090.059 to these countries combinedly. Similarly, the CO2 emissions are recorded 842970 kt in 1995, which is increased to 2761390.055 kt in 2019, with an annual average of 1660602.8 kt. Both the tourist arrivals as well as emissions are noted increased during the last few decades. Therefore, these economies holds importance in terms of analyzing the empirical relationship between the two variables.
Concerns about the progressively worsening climate change difficulties have spurred a sense of panic in reducing global CO2 emissions in the modern period. Previously, traditional development plans have primarily concentrated on increasing the global economy’s growth rate. The environmental challenges that have followed the economic accomplishments: however, remained ignored (Murshed & Dao, Citation2020). Yet, the notion of “growing up now and cleaning up later” had attained a saturation point, and failing to acknowledge the strategically essential environmental well-being concern might undermine the global economy’s overall sustainability. As a result, reducing greenhouse gas (GHG) emissions is becoming a top priority for governments throughout the world. In this framework, current environmental policies are frequently conceived to stimulate economic growth even while protecting environmental wellbeing. Notably, as CO2 emissions account for more than two-thirds of global total GHG emissions, lowering the CO2 emissions’ intensity has been a central target of such initiatives (Field & Barros, Citation2014).
CO2 emissions have long been connected to economic growth, which the Environmental Kuznets Curve (EKC) hypothesis claims to explain (Grossman & Krueger, Citation1991). The EKC paradox proposes that in the earlier phases of economic expansion, environmental degradation is accelerated by increasing CO2 emissions level. Conversely, after a certain level of growth has been reached, the rate of environmental degradation is likely to slow (Narayan & Narayan, Citation2010). As a result, this theory explicitly identifies economic development or growth as a cause as well as a remedy for CO2 emissions-induced environmental problems. To adjust for the growth-CO2 emissions nexus, previous research on the EKC hypothesis examined a broad range of macroeconomic parameters. For instance, many empirical studies have suggested that energy investment, energy use, foreign direct investment, and electricity consumption are the important factors that significantly the nexus between economic growth and CO2 emissions (Destek et al., Citation2020; Li & Li, Citation2020; Petrović-Ranđelović et al., Citation2020; Saidi & Omri, Citation2020). To be more specific, rise in the industrial expansion, and investment in the in the energy sector encourages the use of traditional energy resources, which are then adversely affecting environmental quality. However, Studies have named few factors that could help achieve higher economic growth and could also influence environmental quality. Such factors include renewable energy consumption and technological innovation, which have a stimulating effect on economic growth (Hu et al., Citation2022; Yang et al., Citation2021). However, little attention has been paid to the environmental impact of these instruments, which could also essential in an economic-environment nexus.
Following the backdrop, the major objective of this research study is to empirically reinvestigate the association of economic growth and environmental quality. Particularly, this study attempts to analyze whether economic growth influences environmental quality or not? Albeit there are numerous studies that investigated economic growth and environmental quality of various countries and regions (see Section-2). However, the panel of four South Asian economies including India, Bangladesh Sri Lanka, and Pakistan still remained ignored in such extensive literature. Therefore, additional objective of this study is to test the EKC hypothesis in these economies. Since the South Asian economies are highly dependent on the tourism sector, which covers a significant portion of their GDP. Consequently, another objective of this study is to analyze the nexus of tourism industry and environmental quality. Nonetheless, there are many studies that empirically examine the said nexus (Eyuboglu & Uzar, Citation2020; Gao et al., Citation2021). Still, these studies have provided mixed findings and also lacks the specific association in the panel of study economies. Therefore, it is important to examine the association via using the extended dataset for the mentioned emerging economies. Following the recent trend of increasing investment in environmentally effective energy resources, this study aims to analyze the influence of renewable energy consumption and technological innovation on the quality of environment. Although there are many studies available in the literature that cover these objectives in the context of developed as well as developing economies. Still, the specific investigation of both short and long-run associations in the selected economies are missing in the literature, which could be important for the policy-makers and scholars.
This study is novel and contributes to the existing studies in three dimensions. Firstly, this study is among the first studies that analyzes EKC hypothesis in four South Asian economies. Though the developed and developing countries are widely investigated: still, these countries are out of focus in the academic research, which are emerging economies and could be Asian tigers in the near future. Secondly, this study provides empirical evidence regarding the influence of tourism industry on environmental quality. Albeit the existing studies have provided empirical evidence for the said nexus. Yet the contradictory and mixed findings may not lead to adopt respective policies confidently. Therefore, these estimates could be used as innovative policy tool, which particularly focuses on the South Asian economies. Lastly, the specific influence of renewable energy and technological innovation are missing for the selected panel economies, and such variables are now important economic as well as environmental indicators. Therefore, this study is playing a substantial role in displaying the empirical evidence regarding the nexus. Moreover, this study utilized the extended dataset available and provides innovative policy suggestions that could provide a path for maintaining economic growth as well as environmental sustainability in these economies.
The remaining of the study of is organized in the following parts: Section-2 delivers review of literature; Section-3 provides data and methodology used for empirical investigation; Section-4 represents the estimated results and discussion; Section-5 concludes the study along with the policy implications.
2. Review of literature and hypothesis development
Since the last few decades, scholars and policy-makers have provided extensive literature regarding the association of economic growth and carbon (CO2) emissions for various countries and regions (Akram & Umar, Citation2022; Hao et al., Citation2021; Umar et al., Citation2021; Wang et al., Citation2021). In this regard, the recent studies that evaluated extended time periods are discussed here. Specifically, the recent study of Yang et al. (Citation2021) examined 78 economies between 2000 and 2017 via Tapio model with a comprehensive decomposition framework. The estimated results reveal that economic growth as well as population expansion significantly promote environmental degradation that also restricts the global decoupling process. However, production efficiency, technological advancement and energy structure optimization significantly leads to low carbon economy. Also, the study of Song (Citation2021) investigated China (30 Chinese Provinces) covering the period of 2001-2016 and employed fixed effect threshold regression model. The examined results reveal that higher economic growth maintenance along with the investment in technology and environmental protection significantly leads to low carbon emissions. In addition, Li et al. (Citation2021) used common correlated effect mean group and augmented mean group estimating tool to conclude that economic growth as well as energy consumption significantly enhances CO2 emissions in group of 20 economies. Besides, the study validates bidirectional causal nexus between economic growth, energy consumption, and CO2 emissions. Similar impact of income is also delivered in the study of Wang and Zhang (Citation2021). However, the authors claimed that high oil prices and renewable energy could be significant factors to lower CO2 emissions in 182 countries. Besides, the influence of trade openness is found heterogenous, i.e., negative association with CO2 emissions in the developed and positive association in developing economies. Beside the positive association of income and environmental degradation, Akadiri and Adebayo (Citation2021) and Tufail et al. (Citation2021) asserted that economic growth, financial development, and non-renewable energy promote CO2 emissions, while renewable energy helps reduce CO2 emissions. Whereas studies asserted that enhancement in the CO2 emissions in the developing economies is due to their high reliance on fossil energy consumption (Nathaniel et al., Citation2021). Based on the above discussion, this study assumed the null hypothesis regarding economic growth-environment nexus, given as:
Economic growth positively affect environmental degradation.
Increased economic growth promote environmental sustainability (EKC is valid).
Tourism adversely affect the emissions level.
Renewable energy reduces the carbon emissions level.
Technological innovation enhances environmental sustainability.
2.1. Literature summary and research gap
In the earlier section of this study, extensive literature is provided covering the association between tourism-environment, economic growth-environment, renewable energy-environment, and technological innovation-environment. However, from the given literature, this study noted that the empirical results concerning the tourism-environment, renewable energy-environment, and technological innovation-environment are contradictory, where several studies posits their increasing role in environmental degradation, while other claimed their importance in environmental sustainability. Since, the contradictory evidence is a prevailing issue in the literature reporting the research gap and a need for extensive empirical research to examine the real association between them. Besides, the economic growth is observed as increasing the CO2 emissions level. Whereas the increased economic growth up to the threshold level, the CO2 emissions tend to decline, which leads to environmental sustainability. Further, the existing literature for various developed and emerging economies, this study observed no study that empirically analyzes the EKC paradox in the South Asian economies. To bridge this gap, this study uses various advanced panel data approaches as discussed in the next section.
3. Methodology
3.1. Theoretical framework and model specification
The theoretical framework regarding the association of environmental quality (CO2) and variables such as tourism (TOUR), economic growth (GDP) (along with the EKC: GDP squared/GDPS), renewable energy consumption (REC) and technological innovation (TI) is discussed in this section. With reference to the TOUR-CO2 nexus, there are several empirical studies available as discussed above. Initially, the development of tourism may enhance public infrastructure and services optimize traffic site circumstances, increase the exposure of destinations, and broaden the opening-up process. In addition, as essential components of the tourism sector, business and MICE tourism may provide prospective investors with first-hand knowledge about the location and attract new investment prospects, therefore boosting its openness (Tong et al., Citation2022). Since the emerging economies are still relying on the non-renewable energy consumption, which is the backbone of industrial sector. However, TOUR is a services-based sector, which is reduces the economy’s dependence on industrial sector and contribute to economic growth. However, the decline of the industrial sector reduces the traditional energy use, which further improves environmental quality, given as: which leads to the assumption of negative (
) sign of the variable. Besides, the literature is comprehensive literature is available, which asserted that increase in economic growth enhances the level of investment and consumption, that further boost the industrial activities and enhance demand for energy obtained from fossil fuel: hence, positively influencing the CO2 emission level, given as:
However, after attaining a threshold level of income, the economies are shifted towards environmentally friendly investments such as energy efficiency and renewables’ utilization via research as development (R&D) and TI. As a result, the industrial sector reduces the consumption of fossil fuel, which improves environmental quality by reducing the CO2 emission level, such as:
On the other hand, the use of two control variables, i.e., REC and TI are also expected to have adverse impact on the CO2 emissions level as these factors increase the culture of R&D, knowledge about environmental sustainability, reduces traditional energy consumption, and encourages the use of environmentally friendly energy, given as:
and
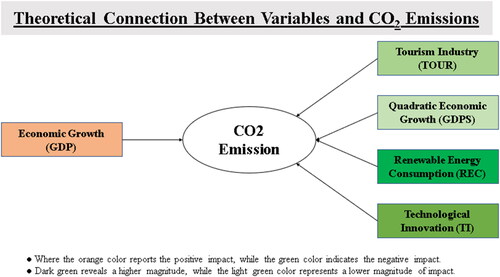
For brevity, the influence of each variable on CO2 emissions is displayed in .
Figure 3. Theoretical representation of variables’ association.
Source: Authors own work based on the theoretical Framework.
Based on the above discussion and objectives, this study used six variables, where the primary focus variable is CO2 that captures environmental degradation motivated by the recent study of Sun et al. (Citation2020) and Xue et al. (Citation2022), that also uses CO2 emissions as an indicator of environmental quality and environmental sustainability. However, economic growth is proxies with the gross domestic product (GDP) since it denotes the economy’s health. Besides, this study uses the squared GDP (GDPS) as a proxy for increased economic growth to analyze whether the EKC paradox is valid for the South Asian economies. On the other hand, the tourism industry is represented with the number of international tourist arrival, which can also be seen in the recent study of Oad et al. (Citation2022). Whereas renewable energy consumption and technological innovation are used as control variables to avoid estimation biasedness. Data for all these mentioned variables are extracted from the World Development Indicators (World Bank, Citation2021)Footnote1. Besides, the data covers the previous 31 years’ data, i.e., from 1990 to 2020). Moreover, the data is collected for four South Asian developing economies including India, Bangladesh, Sri Lanka, and Pakistan. Variables’ specifications and data sources are presented in the .
Table 1. Variables specification and data sources.
Following the studies of Eyuboglu and Uzar (Citation2020) and Sharif et al. (Citation2017), this study constructed the following models:
Model-1
Model-2
The primary reason for constructing two separate models is clarity in the examination of EKC paradox in the selected panel economies, which is based on the model development of Beşe and Kalayci (2021). These two models can be transformed into regression model for an econometric analysis, given as:
(1)
(1)
(2)
(2)
Where the above equations reveal that is the intercept and
is the estimated slopes for each explanatory variable. Whereas CO2 indicates carbon emissions, GDP represents economic growth, GDPS is the square term of GDP, TOUR demonstrates tourism industry, REC presents renewable energy consumption and
identifies technological innovation of the South Asian economies. Besides, “i" and “t” in the subscript represents the cross-sections and time series for the selected panel economies. Moreover,
is the random error term of the regression equation.
3.2. Estimation strategy
3.2.1. Slope heterogeneity and cross-section dependence
Current study utilizes panel data estimation strategies such as slope heterogeneity and cross-sectional dependence. A rapid improvisation in the international trade and globalization has been noted after the industrial revolution, due to which the transfer of goods and services across borders boost up. Among international trade and globalization, there are several factors that affects economic growth and performance. However, comparative advantage of a country in a particular goods and services might lead to a situation of dependence of other countries on the country. Whereas, such dependence may increase dur to attainment of various financial, environmental, or economic, technological, etc. goals. For such reason(s), one country in relation to other economies could show similarities or differences in some aspects—leading to the emergence of slope homogeneity. Since this study is dealing with the panel data, it is essential to test the slope coefficient homogeneity/heterogeneity as the econometric analysis could provide inefficient estimates if such issue like slope heterogeneity as well as cross-section dependency remained ignored (Breitung, Citation2005; Le & Bao, Citation2020). In this context, the current study uses the Pesaran and Yamagata (Citation2008) SCH test to examine the slope homogeneity/heterogeneity and the Pesaran (Citation2004) CD test analyze the cross-section dependence in the South Asian economies. With reference to the SCH test, the standard equation for estimation could be provided as follows:
(3)
(3)
Besides SCH, this test also provides evaluation for adjusted SCH, which could be given in the standard equation form as follows:
(4)
(4)
Concerning the null hypothesis, Pesaran and Yamagata (Citation2008) SCH test assumes that the slope coefficients are homogenous, whereas the alternative hypothesis is suggested if the estimates are found significant.
Similarly, the issue of cross-section dependency could not be ignored since it may provide bias estimate in an econometric investigation (Campello et al., Citation2019). In this regard, the Pesaran (Citation2004) CD test is used and the standard equation could be provided as follows:
(5)
(5)
With reference to the under-discussion test, it assumes that the panel cross-sections are independent in the selected panel economies. However, the alternate hypothesis will be accepted if the estimates are found significant at any 1%, 5%, or 10% levels.
3.2.2. Stationarity testing
The empirical estimates of the slope heterogeneity and cross-section dependency asserted that the slope are heterogeneous and the cross-section dependency is present in the panel. Therefore, it is important to utilize effective estimator that tackles the issue of earlier mentioned panel data issue. In this sense, current study employed the Pesaran (Citation2007) cross-sectionally augmented IPS—known as CIPS unit root test. Firstly, Pesaran (Citation2006) recommended a factor modelling approach while pondering cross-section dependence. In the said method, the averages of cross-sections are amalgamated like the common unobserved components in the model. The same approach is followed by Pesaran (Citation2007) and developed an additional approach for testing unit root via the expansion of Augmented Dickey-Fuller (ADF) regression model which allows not only for the mean, but also for the cross-sectional first difference lags. The under-discussion method tackles the CD issue even in dealing with the unbalanced panel, i.e., the time period and cross-sections are not equal (). The standard equation form for the cross-sectional ADF is as follows:
(6)
(6)
From EquationEq. (6)(6)
(6) ,
reveals that the average of observations. In order to deal with the serial correlation, this equation may be transformed by adding first differenced lags of
and
provided as below:
(7)
(7)
Thus, the CIPS is constructed, which this study adopted to analyze for the presence of a unit root by using the averages of t-statistics for every unit of the cross-section, termed as CADFi, and the equation form is provided as follows:
(8)
(8)
This test (CIPS) holds the null hypothesis as the unit root is present in the data, whereas the alternate hypothesis suggested stationarity of the data throughout time.
3.2.3. Testing cointegration
Since the slope heterogeneity and cross-section dependence are confirmed, while the unit toot indicates mixed order of integration. Therefore, it is important to examine the cointegration relationship between the variables under consideration. In this case, current study used the Westerlund’s (Citation2007) error correction model (ECM). In addition, this test holds power to tackle slope heterogeneity and cross-sectional dependency. Besides, this test measure both the group mean as well as panel statistics, which could be expressed as follows:
and
that evaluates group mean statistics and,
and
that quantifies panel statistics.
3.2.4. Cross-sectionally augmented autoregressive distributed lags (CS-ARDL) model
We used the CS-ARDL model established by Chudik and Pesaran (Citation2015) to predict long-run as well as the short-run coefficients. The CS-ARDL estimator’s important features are that it produces reliable findings regardless of whether the series are cointegrated or otherwise, and that the effectors are integrated at I(0), I(1), or mixed order of integration (Chudik et al., Citation2017). It incorporates cross-sectional dependency since it is an ARDL edition of Dynamic Common Correlated Estimator which is influenced by specific predictions having lagged dependent variables and averages of lagged cross-sections (Chudik & Pesaran, Citation2015). While slope coefficients are non-homogenous, it enables for mean group assessments. The CS-ARDL model’s mean group version is derived on supplementing of every ARDL cross-section’s computations with averages of cross-section, that are representations for unexplained common components as well as associated lags (Chudik et al., Citation2017). The under-discussion technique also works better in the presence of weak endogeneity issue that arises when the lagged dependent factor is applied to the structure. The authors argued that adding lagged cross-sectional averages to the model effectively eliminates the problem of endogeneity. Following is the regression model used to get the CS-ARDL estimating model.
(9)
(9)
Wherein the above equation refers to the averages of lagged cross-sections, [i.e.,
]. However, the long-run coefficients of the mean group (MG) estimates are as follows:
(10)
(10)
From the above equation, indicates each cross-section’s individual estimations. Besides, the error correction equation form of CS-ARDL model is given as:
(11)
(11)
In the EquationEq. (11)(11)
(11) ,
demonstrates the speed of adjustment error correction. As per the study of Chudik and Pesaran (Citation2013), common correlated effect mean group (CCEMG) estimator with the lags augmentation works effectively in terms of size, bias as well as power. Whereas, if T < 50, the scholars seen it as a negative bias. In order to diminish time series small sample bias, the study of Chudik and Pesaran (Citation2015) proposed the split method jackknife specification established by Dhaene and Jochmans (Citation2015). The standard equation form of the jackknife specification is given below:
(12)
(12)
In the EquationEq. (12)(12)
(12) above,
indicates the estimation of CCEMG having the first half of time dimensions (i.e.,
) and
demonstrates the predictions with the remaining time dimension’s half
In the current study, the available time dimension is 31 (reported as T < 50). This demonstrates the bias corrected results of CS-ARDL.
3.2.5. Robustness and panel causality test
Once the data is analyzed via employing the CS-ARDL approach, this tested for the robustness of the findings. In this regard, an efficient estimator is required since the traditional estimation approaches lacks the power of tackling slope heterogeneity and cross-section dependence (Çoban & Topcu, Citation2013). In this regard, current study used the augmented mean group (AMG) estimator provided by (Eberhardt, Citation2012). In comparison to the existing approaches like pooled mean group (PMG) and mean group (MG), the AMG estimator works more effectively as it also deals the issue of non-stationarity along with the cross-section dependence and heterogeneity. Therefore, it is regarded as the AMG may provide robust estimates by allowing for these mentioned panel data issues.
Since the CS-ARDL and AMG estimators lacks the property of any causal association between the study variables. Therefore, this study adopted the Dumitrescu and Hurlin (Citation2012) Granger panel causality heterogeneity test that also deal the panel data issues (slope heterogeneity and cross-section dependence issues) (Banday & Aneja, Citation2020). Moreover, this test is effective as it provides estimates even if the panel is unbalanced Hence, it is appropriate to use this test which provides the causal nexus of
emissions and other explanatory variables such as
and
4. Results and discussion
This study begins the empirical investigation section by evaluating the panel data specifications such as slope heterogeneity and cross-section dependence. Where the estimated findings of slope heterogeneity are provided in . Since we have used two models, therefore the said table reports the empirical estimates of both models. Specifically, the examined results of Pesaran and Yamagata (Citation2008) slope heterogeneity test assumes that the slopes are homogenous. Whereas the results of SCH and adjusted SCH are found highly statistically significant at 1% level, which leads to the rejection of proposition. Hence, it is concluded that both the models have heterogeneous slope coefficients.
Table 2. Slope heterogeneity.
After the slope heterogeneity, this study analyzed the panel cross-section dependence via employing the Pesaran (Citation2004) CD test and the empirical results are provided in . From the results, it is noted that all the variables hold statistically significant estimates, which are rejecting the null hypothesis of cross-sectional independence. Hence, it is concluded from the CD test that the spillover effect is present in each variable representing the panel of South Asian economies. Thus, it could be summarized that the emissions,
and
of one economy cross-sectionally dependent on other economies.
Table 3. Cross-section dependence.
Since the SCH and CD test validates that the slopes coefficients are heterogeneous and the existence of cross-section dependence in the panel of South Asian economies. Therefore, this study used a second-generation panel unit root estimator which is efficient in tackling slope heterogeneity and cross-sectional dependency. The Pesaran (Citation2007) CIPS unit root test findings are provided in . Specifically, the estimated results unveil that only is stationary at I(0), while the remaining variables are such as
and
holds the property of unit root. In addition, the under-discussion test is also run on the data at I(1), where all these latterly mentioned variables are stationary. Since all the variables holds the property of stationarity albeit following mixed integration order, this allows current study to analyze the cointegration association between the variables under study.
Table 4. Unit root testing (Pesaran, Citation2007).
reports the empirical findings of Westerlund (Citation2007) cointegration test for both Model-1 and Model-2. The estimated results reveal statistically significant estimates at 1%, 5%, and 10% levels for group mean statics ( and
) and panel statistics (
and
) in both the models. This leads to the rejection of null hypothesis of the said test that no cointegration exists among the panel and the group or the error correction term in a conditional panel error correction model being equal to zero, instead the cointegration association exists between the variables in the long-run. This further allows to examine the specific influence of each explanatory variable (i.e.,
and
) on the dependent variable (
emissions).
Table 5. Cointegration results (Westerlund, Citation2007).
After confirming the long-run cointegration association between the variables, this study examines the short-run and the long-run influence of each explanatory variable in environmental degradation of the selected panel economies. In this regard, the empirical findings of CS-ARDL approach is provided in . In order to analyze the EKC hypothesis, current study used two model where Model-1 consists only and Model-2 containing square of the
(
) The estimated results for GDP is exhibits positive and statistically significant impact on the
emissions in the region. An increase of one percent in the GDP causes increase of 0.372 (Model-1) and 0.697% (Model-2) at 1% level of significance. These findings are consistent to the existing findings of Yang et al. (Citation2021), Song (Citation2021), Akadiri and Adebayo (Citation2021), Li and Li (Citation2020) Saidi and Omri (Citation2020), which also demonstrated the positive association between economic growth and environmental dedgradation. Mostly the economic growth relied on the expansion of the industrial sector, which require more energy consumption. However, to accomplish energy demand in such sector, developing economies are majorly uses the non-renewable fossil fuel energy, which although leads to higher economic growth, but also harms environment by increasing the level of CO2 emissions in the country (Li et al., Citation2021; Nathaniel et al., Citation2021). On the other hand, the GDPS in Model-2 is found in negative association to the CO2 emissions. Specifically, increase of one percent in the GDPS significantly reduces CO2 emissions by 0.022% in the short-run. Such findings are consistent to the earlier studies of Saint Akadırı et al. (Citation2021), Balsalobre-Lorente et al. (Citation2021), Schröder and Storm (Citation2020), and Beşe and Kalayci (2021), that validate the EKC hypothesis existence in various developed and developing economies. The primary reason of the EKC validity in the South Asian economies is that these are developing economies and are highly dependent on the fossil fuel energy consumption. However, after reaching to the optimal level of income, these economies focus more on the environmental sustainability, which led them to use renewable and environmentally friendly energy resources. Therefore, the CO2 emissions will fall significantly and hence the target of environmental sustainability could be achieved.
Table 6. CS-ARDL.
In addition,
and
are found in negative association with the CO2 emissions in the South Asian economies in the short-run. Specifically, a one percent increase in the each of these mentioned variables reduces CO2 emissions by 0.020-0.024, 1.684-2.004, and 0.043-0.044% in the short-run. These results are found highly statistically significant at all (1%, 5%, and 10%) levels. Concerning the negative influence of tourism, the South Asian economies are more attracted to the travelers where millions of people around the globe are visiting these nations. However, adopting various environmentally friendly resources such as temperature control system, solar power panel, solar-powered water heaters, energy saving appliances and other environmentally friendly goods and services reduces CO2 emissions in the regions. Besides, the tourism is majorly a service-based industry, whereas enhancement in the services industry could reduce the use of energy intensive industries. As a result, the level of carbon emissions significantly reduces, which lead the economy towards environmental sustainability. Since developing economies are more dependent on fossil fuel energy consumption, therefore innovation in the technology could help these countries to promote environmentally friendly, energy efficient and energy saving products and services, which could significantly reduce emissions in the country. Similarly in this study, the empirical results asserted that enhancement in TI significantly reduces the CO2 emissions level by 0.0438-0.0428% in the short-run. Not only this study, but the earlier studies also validated the negative impact of TI on CO2 emissions in various regions (see, for instance, Yang et al., Citation2021). The advancement in technological innovation further contribute to encouragement of renewable energy. As mentioned earlier, the consumption of renewable energy resources is less polluted, which causes no harm to the environment. Renewable energy related products and services are considered as environmentally friendly since it significantly reduces emissions in both developed and developing economies. In this study, the empirical results also suggest that enhancement in the REC could reduce the CO2 emissions by 2.004-1.684% in both the models. Such findings are in line to the recent studies of Wang and Zhang (Citation2021), Balsalobre-Lorente et al. (Citation2021), Hu et al. (Citation2022), and Saidi and Omri (Citation2020). Moreover, the ECM presents the values of −0.887 and −0.930 in Model-1 and Model-2, respectively, which indicates the speed of adjustment. Yet the speed of adjustment of Model-1 having GDP is 88.7%, illustrating that each year, the model is approaching the equilibrium point. However, the Model-2 having GDPS reveals that each year the speed of adjustment to the equilibrium point is 93%, which is more than the Model-1. Hence, the higher level of income plays an essential role in the context of economy and environment.
Besides, the short-run EKS hypothesis, this study found that the EKC hypothesis also exists in the long-run in the selected South Asian economies. Specifically, the GDP is found in positive relation to the CO2 emissions in the region. Where developing economies are targeting higher economic growth, which leads to the higher usage of traditional energy resources and causes environmental degradation (Dong et al., Citation2020; Petrović-Ranđelović et al., Citation2020). However, when the income reached to the threshold level, these economies adopted structural transformation of the industries, adopt and promote renewable energy consumption which are more oriented to environmental sustainability (Bandyopadhyay & Rej, Citation2021; Murshed et al., Citation2021; Murshed & Dao, Citation2020). Besides renewable energy, these economies also invests in the energy efficiency as well as carbon capturing technologies, which reduces the use of energy intensive industries. As a result, the reduced demand for fossil fuels further reduces the CO2 emissions in the regions and consequently leads to environmental sustainability. Moreover, the coefficient values of
and
are also found negative and statistically significant, which indicates that these variables significantly promote environmental sustainability in the long-run. Since the selected South Asian economies are developing economies, that mostly depends on the conventional non-renewable energy resources and leads to higher level of CO2 emissions. Therefore, any technological innovation is indeed a remedial measure for environmental degradation. This not only promote the culture of renewable energy consumption but also helps economies in the industrial structure transformation, which helps deteriorate CO2 emissions in these regions. Besides, with the use of renewables and environmentally friendly products, services and appliance, the tourism could also help in the environmental sustainability in the long-run.
Since the CS-ARDL approach indicates that the EKC hypothesis is present in the South Asian economies where only GDP is positively associated to environmental degradation and the rest of the variables are negatively related to the CO2 emissions. This study also run the AMG estimator to revisit the empirical findings. The estimated results of the AMG are provided in . Specifically, this test also shows the existence of the EKC hypothesis in the selected panel economies. Where the GDP is positively and GDPS is negatively affecting the CO2 emissions in the long-run. Also, the empirical results suggest the similar (negative) influence of
and
on the CO2 emissions. These findings are consistent to the estimated results of CS-ARDL. Hence, our results are robust and could be essential in any policy-making of such developed economies.
Table 7. Robustness check using AMG.
Since the CS-ARDL and AMG only assist in the specific influence of each explanatory variable on the CO2 emissions while do not direct about the causal nexus exist between the dependent and explanatory variables. Therefore, current study utilizes the Dumitrescu and Hurlin (Citation2012) Granger panel causality approach and the estimates are provided in the . From the empirical results, it is noted that all the explanatory variables, i.e.,
and
rejects the null hypothesis of no Granger causality from these variables to CO2 emissions. Instead, there is a significant evidence of causality from these variables to CO2 emissions and also the feedback effect is present between them. This indicates that any policy change in any explanatory variables could significantly affect CO2 emissions and vice versa. These estimates are consistent to the existing studies of Li et al. (Citation2021) and Saidi and Omri (Citation2020) that validates the bidirectional causalities between economic growth—CO2 emissions, and renewable energy consumption—CO2 emissions in G-20 economies and major renewable energy consuming economies. Moreover, current findings are also similar to the existing study of Eyuboglu and Uzar (Citation2020) that validate the two-way causal nexus of tourism and CO2 emissions in Turkey. Based on these findings, this study provided some practical policy implications, which could be relevant to governors, scholars and policy-makers.
Table 8. Dumitrescu-Hurlin panel causality.
5. Concluding remarks
5.1. Conclusion
This study aims to analyze the nexus of economic growth, tourism and environment in the South Asian economies including India, Bangladesh Sri Lanka, and Pakistan covering the period from 1990 to 2020. This study also tested the influence of renewable energy consumption and technological innovation on CO2 emissions in these economies. In order to test for the EKC paradox, current study used the squared GDP in the separate model. The empirical findings are obtained via number of panel estimators including the slope heterogeneity and cross-section dependence. Where these findings suggest that the slopes are heterogeneous are also validates the presence of cross-sectional dependence in the panel. Due to these two panel specifications, current study used the second-generation unit root test, which provides mixed order of integration, i.e., some variables are I(0) stationary and some are I(1) stationary, that leads to the adoption of CS-ARDL approach. Besides, the cointegration has also been tested and found in existence in the study variables. The empirical results of the CS-ARDL reveals that the economic growth is positively associated to environmental degradation and the squared economic growth is negatively associated to environmental degradation, this suggest that the EKC hypothesis is valid in both the short-run and long-run in these economies. Since the selected South Asian economies are developing economies and are highly dependent on the fossil fuel energy use. Therefore, higher economic growth further encourages industrial production and expansion that surges the use of non-renewable energy use and causes environmental degradation. However, after achieving threshold level of income, these economies will consider renewable energy adaptation and structural transformation, which will help reduce CO2 emissions in the region. Moreover, tourism, renewable energy consumption and technological innovation contributes to environmental sustainability via lowering the CO2 emissions. Technological innovation promotes energy efficient and renewables adaptation, which helps transmitting non-renewable energy products and services and reduces pollution level in these economies. However, utilizing such environmentally friendly resources, the tourism sector could also lead to reduction of environmental degradation in these developing economies, which is services-based sector. Such findings are addition to the literature in terms of exploring the influence of Tourism on environmental quality of the stated developing economies. Thus, innovative policies are required to achieve environmental sustainability without disturbing economic growth of these economies.
5.2. Policy implications
Based on empirical findings, this study suggested policies that could help policy-makers to achieve environmental sustainability and low carbon economy without affecting economic growth. Specifically, economic growth should be distracted from the heavy dependence of fossil fuel energy consumption. Traditional non-renewable energy usage is regarded as the backbone of industrial sector’s expansion which although contributes to higher economic growth, but also enhances emissions and pollution level. As a consequent, this study suggested to use the higher income level for the promotion and adoption of renewable energy production as well as consumption at the industrial sector. Besides, the higher economic growth shall be utilized for the structural transformation of the industrial sector, where the traditional resources may be replaced with the energy efficient and renewable energy sources to maintain economic growth and reduce environmental hazards. In addition, policies regarding increased investment in the technological innovation shall be promoted, which further encourage the culture of energy conservation, and renewables consumption, and the use of energy efficient products and services. Since the South Asian economies are emerging economies and the tourism sector covers significant portion of their GDP. Also, being a services-based sector, this study suggest the policy-makers and governors to promote tourism by enhancing investment in the infrastructure as well as development of tourist spots, which will attract tourists and foreign investors to invest more in the host economy along with the investment in environmentally friendly energy resources. As a result, the economy will achieve environmental sustainability without compromising economic growth.
5.3. Limitations and future research recommendations
Although this study provides important findings and substantial policy implications, still this study is limited in few directions. Specifically, this study ignored the role of international trade, globalization, population, and urbanization in the empirical investigation, which could have important role in the environmental quality assessment. Therefore, the future researchers are directed to extend this study by considering these variables. Besides, this study uses the novel CS-ARDL approach to identify the short- and long-run estimates. Whereas the future researchers could use the novel method of moment quantile regression to analyze the said nexus more comprehensively. Moreover, this study could be extended in terms of time period.
Disclosure statement
No potential conflict of interest was reported by the authors.
Additional information
Funding
Notes
1 For details and Data, visit: https://databank.worldbank.org/source/world-development-indicators.
References
- Akadiri, S. S., Lasisi, T. T., Uzuner, G., & Akadiri, A. C. (2020). Examining the causal impacts of tourism, globalization, economic growth and carbon emissions in tourism island territories: bootstrap panel Granger causality analysis. Current Issues in Tourism, 23(4), 470–484. https://doi.org/10.1080/13683500.2018.1539067
- Akadiri, S. S., & Adebayo, T. S. (2021). Asymmetric nexus among financial globalization, non-renewable energy, renewable energy use, economic growth, and carbon emissions: impact on environmental sustainability targets in India. Environmental Science and Pollution Research, 29, 1–13. https://doi.org/10.1007/s11356-021-16849-0
- Akram, R., Umar, M., Xiaoli, G., & Chen, F. (2022). Dynamic linkages between energy efficiency, renewable energy along with economic growth and carbon emission. A case of MINT countries an asymmetric analysis. Energy Reports, 8, 2119–2130. https://doi.org/10.2139/ssrn.3870971
- Alam, M. S., & Paramati, S. R. (2017). The dynamic role of tourism investment on tourism development and CO 2 emissions. Annals of Tourism Research, 66, 213–215. https://doi.org/10.1016/j.annals.2017.07.013
- Azam, M., Mahmudul Alam, M., & Haroon Hafeez, M. (2018). Effect of tourism on environmental pollution: Further evidence from Malaysia, Singapore and Thailand. Journal of Cleaner Production, 190, 330–338. https://doi.org/10.1016/j.jclepro.2018.04.168
- Balsalobre-Lorente, D., Driha, O. M., Leitão, N. C., & Murshed, M. (2021). The carbon dioxide neutralizing effect of energy innovation on international tourism in EU-5 countries under the prism of the EKC hypothesis. Journal of Environmental Management, 298, 113513. https://doi.org/10.1016/j.jenvman.2021.113513
- Banday, U. J., & Aneja, R. (2020). Renewable and non-renewable energy consumption, economic growth and carbon emission in BRICS: Evidence from bootstrap panel causality. International Journal of Energy Sector Management, 14(1), 248–260. https://doi.org/10.1108/ijesm-02-2019-0007
- Bandyopadhyay, A., & Rej, S. (2021). Can nuclear energy fuel an environmentally sustainable economic growth? Revisiting the EKC hypothesis for India. Environmental Science and Pollution Research, 28(44), 63065–63086.
- Bashir, M. A., Dengfeng, Z., Bashir, M. F., Rahim, S., & Xi, Z. (2022). Exploring the role of economic and institutional indicators for carbon and GHG emissions: policy-based analysis for OECD countries. Environmental Science and Pollution Research International, 30, 32722–32736. https://doi.org/10.1007/s11356-022-24332-7
- Bernardini, O., & Galli, R. (1993). Dematerialization: Long-term trends in the intensity of use of materials and energy. Futures, 25(4), 431–448. https://doi.org/10.1016/0016-3287(93)90005-e
- Beşe, E., & Kalayci, S. (2021). Environmental Kuznets curve (EKC): empirical relationship between economic growth, energy consumption, and CO2 emissions: evidence from 3 developed countries. Panoeconomicus, 68(4), 483–506.
- Breitung, J. (2005). A parametric approach to the estimation of cointegration vectors in panel data. Econometric Reviews, 24(2), 151–173. https://doi.org/10.1081/etc-200067895
- Buckley, R. (2012). Sustainable tourism: Research and reality. Annals of Tourism Research, 39(2), 528–546. https://doi.org/10.1016/j.annals.2012.02.003
- Cai, X., Wang, W., Rao, A., Rahim, S., & Zhao, X. (2022). Regional sustainable development and spatial effects from the perspective of renewable energy. Frontiers in Environmental Science, 10, 105327. https://doi.org/10.3389/fenvs.2022.859523
- Campello, M., Galvao, A. F., & Juhl, T. (2019). Testing for slope heterogeneity bias in panel data models. Journal of Business & Economic Statistics: A Publication of the American Statistical Association, 37(4), 749–760. https://doi.org/10.1080/07350015.2017.1421545
- Cavallaro, F., Galati, O. I., & Nocera, S. (2017). Policy strategies for the mitigation of GHG emissions caused by the mass-tourism mobility in coastal areas. Transportation Research Procedia, 27, 317–324.
- Chudik, A., Mohaddes, K., Pesaran, M. H., & Raissi, M. (2017). Is there a debt-threshold effect on output growth? Review of Economics and Statistics, 99(1), 135–150.
- Chudik, A., & Pesaran, M. H. (2013). Large panel data models with cross-sectional dependence: a survey. CAFE Research Paper, 13(15).
- Chudik, A., & Pesaran, M. H. (2015). Common correlated effects estimation of heterogeneous dynamic panel data models with weakly exogenous regressors. Journal of Econometrics, 188(2), 393–420.
- Çoban, S., & Topcu, M. (2013). The nexus between financial development and energy consumption in the EU: A dynamic panel data analysis. Energy Economics, 39, 81–88. https://doi.org/10.1016/j.eneco.2013.04.001
- Destek, M. A., Shahbaz, M., Okumus, I., Hammoudeh, S., & Sinha, A. (2020). The relationship between economic growth and carbon emissions in G-7 countries: evidence from time-varying parameters with a long history. Environmental Science and Pollution Research International, 27(23), 29100–29117. https://doi.org/10.1007/s11356-020-09189-y
- Dhaene, G., & Jochmans, K. (2015). Split-panel jackknife estimation of fixed-effect models. The Review of Economic Studies, 82(3), 991–1030.
- Dong, B., Xu, Y., & Fan, X. (2020). How to achieve a win-win situation between economic growth and carbon emission reduction: empirical evidence from the perspective of industrial structure upgrading. Environmental Science and Pollution Research, 27(35), 43829–43844.
- Dubois, G., Peeters, P., Ceron, J. P., & Gössling, S. (2011). The future tourism mobility of the world population: Emission growth versus climate policy. Transportation Research Part A: Policy and Practice, 45(10), 1031–1042.
- Dumitrescu, E.-I., & Hurlin, C. (2012). Testing for Granger non-causality in heterogeneous panels. Economic Modelling, 29(4), 1450–1460. https://doi.org/10.1016/j.econmod.2012.02.014
- Eberhardt, M. (2012). Estimating panel time-series models with heterogeneous slopes. The Stata Journal, 12(1), 61–71. https://doi.org/10.1177/1536867X1201200105
- Eyuboglu, K., & Uzar, U. (2020). The impact of tourism on CO2 emission in Turkey. Current Issues in Tourism, 23(13), 1631–1645.
- Field, C. B., & Barros, V. R. (Eds.). (2014). Climate change 2014–Impacts, adaptation and vulnerability: Regional aspects. Cambridge University Press.
- Gao, J., Xu, W., & Zhang, L. (2021). Tourism, economic growth, and tourism-induced EKC hypothesis: evidence from the Mediterranean region. Empirical Economics, 60(3), 1507–1529.
- Gössling, S. (2013). National emissions from tourism: An overlooked policy challenge? Energy Policy, 59, 433–442. https://doi.org/10.1016/j.enpol.2013.03.058
- Gössling, S., Scott, D., & Hall, C. M. (2013). Challenges of tourism in a low‐carbon economy. Wiley Interdisciplinary Reviews: Climate Change, 4(6), 525–538.
- Gössling, S., Scott, D., & Hall, C. M. (2015). Inter-market variability in CO2 emission-intensities in tourism: Implications for destination marketing and carbon management. Tourism Management, 46, 203–212.
- Grossman, G. M., & Krueger, A. B. (1991). Environmental impacts of a North American free trade agreement. Working Paper. Retrieved from https://www.nber.org/papers/w3914
- Hao, L.-N., Umar, M., Khan, Z., & Ali, W. (2021). Green growth and low carbon emission in G7 countries: how critical the network of environmental taxes, renewable energy and human capital is? Science of the Total Environment, 752, 141853. https://doi.org/10.1016/j.scitotenv.2020.141853
- Hu, Y., Jiang, W., Dong, H., & Majeed, M. T. (2022). Transmission channels between financial efficiency and renewable energy consumption: Does environmental technology matter in high-polluting economies? Journal of Cleaner Production, 368, 132885.
- Hussain, J., Khan, A., & Zhou, K. (2020). The impact of natural resource depletion on energy use and CO2 emission in Belt & Road Initiative countries: a cross-country analysis. Energy, 199, 117409.
- Jermsittiparsert, K. (2019). Behavior of tourism industry under the situation of environmental threats and carbon emission. Time Series Analysis from Thailand, 9, 670216917.
- Ji, X., Umar, M., Ali, S., Ali, W., Tang, K., & Khan, Z. (2021). Does fiscal decentralization and eco‐innovation promote sustainable environment? A case study of selected fiscally decentralized countries. Sustainable Development, 29, 79–88.
- Jiang, S., Chishti, M. Z., Rjoub, H., & Rahim, S. (2022). Environmental R&D and trade-adjusted carbon emissions: evaluating the role of international trade. Environmental Science and Pollution Research International, 29(42), 63155–63170. https://doi.org/10.1007/s11356-022-20003-9
- Katircioglu, S. T. (2014). International tourism, energy consumption, and environmental pollution: The case of Turkey. Renewable and Sustainable Energy Reviews, 36, 180–187. https://doi.org/10.1016/j.rser.2014.04.058
- Khan, Z., Ali, S., Dong, K., & Li, R. Y. M. (2021a). How does fiscal decentralization affect CO2 emissions? The roles of institutions and human capital. Energy Economics, 94, 105060. https://doi.org/10.1016/j.eneco.2020.105060
- Khan, Z., Ali, M., Jinyu, L., Shahbaz, M., & Siqun, Y. (2020b). Consumption-based carbon emissions and trade nexus: Evidence from nine oil exporting countries. Energy Economics, 89, 104806. https://doi.org/10.1016/j.eneco.2020.104806
- Khan, Z., Ali, M., Kirikkaleli, D., Wahab, S., & Jiao, Z. (2020a). The impact of technological innovation and public‐private partnership investment on sustainable environment in China: Consumption‐based carbon emissions analysis. Sustainable Development, 28(5), 1317–1330. https://doi.org/10.1002/sd.2086
- Khan, Z., Ali, S., Umar, M., Kirikkaleli, D., & Jiao, Z. (2020c). Consumption-based carbon emissions and International trade in G7 countries: The role of Environmental innovation and Renewable energy. The Science of the Total Environment, 730, 138945. https://doi.org/10.1016/j.scitotenv.2020.138945
- Khan, Z., Malik, M. Y., Latif, K., & Jiao, Z. (2020d). Heterogeneous effect of eco-innovation and human capital on renewable & non-renewable energy consumption: Disaggregate analysis for G-7 countries. Energy (Oxford, England), 209, 118405. https://doi.org/10.1016/j.energy.2020.118405
- Khan, Z., Murshed, M., Dong, K., & Yang, S. (2021b). The roles of export diversification and composite country risks in carbon emissions abatement: evidence from the signatories of the regional comprehensive economic partnership agreement. Applied Economics, 53(41), 4769–4787. https://doi.org/10.1080/00036846.2021.1907289
- Khan, Z., Sisi, Z., & Siqun, Y. (2019). Environmental regulations an option: Asymmetry effect of environmental regulations on carbon emissions using non-linear ARDL. Energy Sources Part A Recovery Utilization and Environmental Effects, 41(2), 137–155. https://doi.org/10.1080/15567036.2018.1504145
- Khan, Z., Taimoor, H., Kirikkaleli, D., & Chen, F. (2023). Editorial: The role of fiscal decentralization in achieving environmental sustainability in developing and emerging economies. Frontiers in Environmental Science, 10. https://doi.org/10.3389/fenvs.2022.1102929
- Le, H. P., & Bao, H. H. G. (2020). Renewable and nonrenewable energy consumption, government expenditure, institution quality, financial development, trade openness, and sustainable development in Latin America and Caribbean emerging market and developing economies. International Journal of Energy Economics and Policy, 10(1), 242–248. https://doi.org/10.32479/ijeep.8506
- Li, K., Hu, E., Xu, C., Musah, M., Kong, Y., Mensah, I. A., … Su, Y. (2021). A heterogeneous analysis of the nexus between energy consumption, economic growth and carbon emissions: Evidence from the group of twenty (G20) countries. Energy Exploration & Exploitation, 39(3), 815–837.
- Li, J., & Li, S. (2020). Energy investment, economic growth and carbon emissions in China—Empirical analysis based on spatial Durbin model. Energy Policy, 140, 111425.
- Liu, X., & Bae, J. (2018). Urbanization and industrialization impact of CO2 emissions in China. Journal of Cleaner Production, 172, 178–186. https://doi.org/10.1016/j.jclepro.2017.10.156
- Luan, S., Hussain, M., Ali, S., & Rahim, S. (2022). China’s investment in energy industry to neutralize carbon emissions: evidence from provincial data. Environmental Science and Pollution Research International, 29(26), 39375–39383. https://doi.org/10.1007/s11356-021-18141-7
- Mehmood, U. (2021). Examining the role of financial inclusion towards CO2 emissions: presenting the role of renewable energy and globalization in the context of EKC. Environmental Science and Pollution Research, 29, 1–9.
- Murshed, M., Ali, S. R., & Banerjee, S. (2021). Consumption of liquefied petroleum gas and the EKC hypothesis in South Asia: evidence from cross-sectionally dependent heterogeneous panel data with structural breaks. Energy, Ecology and Environment, 6(4), 353–377.
- Murshed, M., & Dao, N. T. T. (2020). Revisiting the CO 2 emission-induced EKC hypothesis in South Asia: the role of export quality improvement. GeoJournal, 87, 1–29.
- Narayan, P. K., & Narayan, S. (2010). Carbon dioxide emissions and economic growth: Panel data evidence from developing countries. Energy Policy, 38(1), 661–666.
- Nathaniel, S., Barua, S., Hussain, H., & Adeleye, N. (2021). The determinants and interrelationship of carbon emissions and economic growth in African economies: fresh insights from static and dynamic models. Journal of Public Affairs, 21(1), e2141.
- Oad, S., Jinliang, Q., Shah, S. B. H., & Memon, S.-U.-R. (2022). Tourism: economic development without increasing CO2 emissions in Pakistan. Environment Development and Sustainability, 24(3), 4000–4023. https://doi.org/10.1007/s10668-021-01601-y
- Pata, U. K., & Aydin, M. (2020). Testing the EKC hypothesis for the top six hydropower energy-consuming countries: Evidence from Fourier Bootstrap ARDL procedure. Journal of Cleaner Production, 264, 121699.
- Pesaran, M. H. (2004). General diagnostic tests for cross-sectional dependence in panels. Empirical Economics, 60(1), 13–50. https://doi.org/10.1007/s00181-020-01875-7
- Pesaran, M. H. (2006). Estimation and inference in large heterogeneous panels with a multifactor error structure. Econometrica: Journal of the Econometric Society, 74(4), 967–1012. https://doi.org/10.1111/j.1468-0262.2006.00692.x
- Pesaran, M. H. (2007). A simple panel unit root test in the presence of cross-section dependence. Journal of Applied Econometrics (Chichester, England), 22(2), 265–312. https://doi.org/10.1002/jae.951
- Pesaran, M. H., & Yamagata, T. (2008). Testing slope homogeneity in large panels. Journal of Econometrics, 142(1), 50–93. https://doi.org/10.1016/j.jeconom.2007.05.010
- Petrović-Ranđelović, M., Mitić, P., Zdravković, A., Cvetanović, D., & Cvetanović, S. (2020). Economic growth and carbon emissions: evidence from CIVETS countries. Applied Economics, 52(16), 1806–1815.
- Qin, L., Hou, Y., Miao, X., Zhang, X., Rahim, S., & Kirikkaleli, D. (2021b). Revisiting financial development and renewable energy electricity role in attaining China’s carbon neutrality target. Journal of Environmental Management, 297, 113335. https://doi.org/10.1016/j.jenvman.2021.113335
- Qin, L., Raheem, S., Murshed, M., Miao, X., Khan, Z., & Kirikkaleli, D. (2021a). Does financial inclusion limit carbon dioxide emissions? Analyzing the role of globalization and renewable electricity output. Sustainable Development, 29(6), 1138–1154. https://doi.org/10.1002/sd.2208
- Rahim, S., Murshed, M., Umarbeyli, S., Kirikkaleli, D., Ahmad, M., Tufail, M., & Wahab, S. (2021). Do natural resources abundance and human capital development promote economic growth? A study on the resource curse hypothesis in Next Eleven countries. Resources, Environment and Sustainability, 4, 100018. https://doi.org/10.1016/j.resenv.2021.100018
- Ridzuan, N. H. A. M., Marwan, N. F., Khalid, N., Ali, M. H., & Tseng, M. L. (2020). Effects of agriculture, renewable energy, and economic growth on carbon dioxide emissions: Evidence of the environmental Kuznets curve. Resources, Conservation and Recycling, 160, 104879.
- Saidi, K., & Omri, A. (2020). The impact of renewable energy on carbon emissions and economic growth in 15 major renewable energy-consuming countries. Environmental Research, 186, 109567. https://doi.org/10.1016/j.envres.2020.109567
- Saint Akadırı, S., Alola, A. A., & Usman, O. (2021). Energy mix outlook and the EKC hypothesis in BRICS countries: a perspective of economic freedom vs. economic growth. Environmental Science and Pollution Research, 28(7), 8922–8926.
- Saint Akadiri, S., Alola, A. A., Olasehinde-Williams, G., & Etokakpan, M. U. (2020). The role of electricity consumption, globalization and economic growth in carbon dioxide emissions and its implications for environmental sustainability targets. The Science of the Total Environment, 708, 134653.
- Schröder, E., & Storm, S. (2020). Economic growth and carbon emissions: The road to “hothouse earth” is paved with good intentions. International Journal of Political Economy, 49(2), 153–173.
- Shahbaz, M., Nasir, M. A., Hille, E., & Mahalik, M. K. (2020). UK's net-zero carbon emissions target: Investigating the potential role of economic growth, financial development, and R&D expenditures based on historical data (1870–2017). Technological Forecasting and Social Change, 161, 120255.
- Shahzad, U., Radulescu, M., Rahim, S., Isik, C., Yousaf, Z., & Ionescu, S. (2021). Do environment-related policy instruments and technologies facilitate renewable energy generation? Exploring the contextual evidence from developed economies. Energies, 14(3), 690. https://doi.org/10.3390/en14030690
- Sharif, A., Afshan, S., & Nisha, N. (2017). Impact of tourism on CO2 emission: evidence from Pakistan. Asia Pacific Journal of Tourism Research, 22(4), 408–421.
- Song, Z. (2021). Economic growth and carbon emissions: Estimation of a panel threshold model for the transition process in China. Journal of Cleaner Production, 278, 123773.
- Song, H., Dwyer, L., Li, G., & Cao, Z. (2012). Tourism economics research: A review and assessment. Annals of Tourism Research, 39(3), 1653–1682. https://doi.org/10.1016/j.annals.2012.05.023
- Su, C.-W., Khan, K., Umar, M., & Chang, T. (2022a). Renewable energy in prism of technological innovation and economic uncertainty. Renewable Energy, 189, 467–478. https://doi.org/10.1016/j.renene.2022.02.110
- Su, C.-W., Mirza, N., Umar, M., Chang, T., & Albu, L. L. (2022b). Resource extraction, greenhouse emissions, and banking performance. Resources Policy, 79, 103122.
- Su, C.-W., Pang, L.-D., Tao, R., Shao, X., & Umar, M. (2022c). Renewable energy and technological innovation: Which one is the winner in promoting net-zero emissions? Technological Forecasting and Social Change, 182, 121798.
- Sun, Y.-Y., Lin, P.-C., & Higham, J. (2020). Managing tourism emissions through optimizing the tourism demand mix: Concept and analysis. Tourism Management, 81, 104161. https://doi.org/10.1016/j.tourman.2020.104161
- Sun, Y., Li, M., Zhang, M., Khan, H. S. U. D., Li, J., Li, Z., … Anaba, O. A. (2021). A study on China’s economic growth, green energy technology, and carbon emissions based on the Kuznets curve (EKC). Environmental Science and Pollution Research, 28(6), 7200–7211.
- Su, C.-W., Umar, M., & Khan, Z. (2021). Does fiscal decentralization and eco-innovation promote renewable energy consumption? Analyzing the role of political risk. The Science of the Total Environment, 751, 142220. https://doi.org/10.1016/j.scitotenv.2020.142220
- Tong, Y., Zhang, R., & He, B. (2022). The carbon emission reduction effect of Tourism Economy and its formation mechanism: An empirical study of china’s 92 tourism-dependent cities. International Journal of Environmental Research and Public Health, 19(3), 1824. https://doi.org/10.3390/ijerph19031824
- Tufail, M., Song, L., Adebayo, T. S., Kirikkaleli, D., & Khan, S. (2021). Do fiscal decentralization and natural resources rent curb carbon emissions? Evidence from developed countries. Environmental Science and Pollution Research International, 28(35), 49179–49190. https://doi.org/10.1007/s11356-021-13865-y
- Tufail, M., Song, L., Umut, A., Ismailova, N., & Kuldasheva, Z. (2022). Does financial inclusion promote a green economic system? Evaluating the role of energy efficiency. Economic Research-Ekonomska Istraživanja, 1–21. https://doi.org/10.1080/1331677x.2022.2053363
- Umar, M., Ji, X., Kirikkaleli, D., & Alola, A. A. (2021). The imperativeness of environmental quality in the United States transportation sector amidst biomass-fossil energy consumption and growth. Journal of Cleaner Production, 285, 124863. https://doi.org/10.1016/j.jclepro.2020.124863
- Wang, K.-H., Umar, M., Akram, R., & Caglar, E. (2021). Is technological innovation making world" Greener"? An evidence from changing growth story of China. Technological Forecasting and Social Change, 165, 120516. https://doi.org/10.1016/j.techfore.2020.120516
- Wang, Q., & Zhang, F. (2021). The effects of trade openness on decoupling carbon emissions from economic growth–evidence from 182 countries. Journal of Cleaner Production, 279, 123838. https://doi.org/10.1016/j.jclepro.2020.123838
- Wei, J., Rahim, S., & Wang, S. (2022). Role of environmental degradation, institutional quality and government health expenditures for human health: evidence from emerging seven countries. Frontiers in Public Health, 562.
- Westerlund, J. (2007). Testing for error correction in panel data. Oxford Bulletin of Economics and Statistics, 69(6), 709–748. https://doi.org/10.1111/j.1468-0084.2007.00477.x
- World Bank. (2021). World Development Indicators. Retrieved from https://databank.worldbank.org/source/world-development-indicators
- World Bank. (2022). World Development Indicators. Retrieved from https://databank.worldbank.org/source/world-development-indicators
- Xue, C., Shahbaz, M., Ahmed, Z., Ahmad, M., & Sinha, A. (2022). Clean energy consumption, economic growth, and environmental sustainability: What is the role of economic policy uncertainty? Renewable Energy, 184, 899–907. https://doi.org/10.1016/j.renene.2021.12.006
- Yang, J., Hao, Y., & Feng, C. (2021). A race between economic growth and carbon emissions: What play important roles towards global low-carbon development? Energy Economics, 100, 105327.
- Yang, S., & Umar, M. (2022). How globalization is reshaping the environmental quality in G7 economies in the presence of renewable energy initiatives? Renewable Energy, 193, 128–135. https://doi.org/10.1016/j.renene.2022.05.006
- Zaman, K., Shahbaz, M., Loganathan, N., & Raza, S. A. (2016). Tourism development, energy consumption and Environmental Kuznets Curve: Trivariate analysis in the panel of developed and developing countries. Tourism Management, 54, 275–283. https://doi.org/10.1016/j.tourman.2015.12.001