
ABSTRACT
Some prey species use hiding tactics and thus select areas that provide greater visual obstruction for predator avoidance, and vegetative characteristics that provide greater obstruction should be selected. To investigate vegetative characteristics selected by adult male white-tailed deer (Odocoileus virginianus), we compared vegetation between heavily used and unused areas within home ranges of 22 adult (2.5+ years old) males during 1 November 2017–30 January 2018, which coincides with the Mississippi modern-firearms hunting season and includes breeding season. Vegetation within heavily used cells was 20% taller and provided 56% greater Nudds screening cover and >120% greater coverage of thicket and herbaceous plants. Four of seven vegetation variables were influential towards selection in heavily used areas: canopy coverage of thicket-producing, herbaceous, live woody, and dead woody plants. Basal area, height of vegetation, and Nudds board values were not influential. Exclusion of Nudds values from the model suggests adult males selected vegetative characteristics that provided more than just physical obstruction. Forest managers can use these results in inform management actions to attract adult male deer.
Introduction
Fine-scale habitat selection influences an organism’s home range use (Bose et al. Citation2018) and creates areas that are used disproportionately to other areas in a home range (Samuel et al. Citation1985; Riedle et al. Citation2006). Fine-scale selection is dependent on several factors, such as vegetative characteristics and structural components that provide cover (Tabor and Wurtsbaugh Citation1991; Pollock et al. Citation1994; Meiners and Obermaier Citation2004; Lehtiniemi Citation2005). For example, several fish species, such as juvenile rainbow trout (Oncorhynchus mykiss) and pike (Esox lucius), select areas that contain more complex vegetation to hide from predators (Tabor and Wurtsbaugh Citation1991; Lehtiniemi Citation2005). Cervid species, such as roe deer (Capreolus capreolus), have shown similar results where foraging and bedding sites contained greater cover, suggesting that cover is important to habitat use for cervids (Tufto et al. Citation1996; Ratikainen et al. Citation2007). These studies illustrate that vegetative cover is used to enhance an organism's ability to safely inhabit an area, as the benefit of using this vegetation is increased survival (Babbitt and Tanner Citation1998).
Cover is often recognized as a critical component of animal space use trends (Davis Citation2005; Riedle et al. Citation2006; Lowrey et al. Citation2019); however, most studies simply define cover as “thick vegetation,” “complex vegetation,” or use indexes such as Nudds board values to define discrete cover categories (Nudds Citation1977; Wagner et al. Citation2000; Lehtiniemi Citation2005). While Nudds boards are easy to use and interpret, from an organism’s perspective, the characteristics defining good vegetative cover may be substantially more complex than simple screening cover. Because of this potential discrepancy, descriptions of cover for prey species should be refined to better understand fine-scale vegetative selection.
White-tailed deer (hereafter deer; Odocoileus virginianus) are popular game mammals in the United States, accounting for 8.1 million hunters nationwide (USFWS Citation2016). The popularity of deer hunting has increased interest in local habitat management for deer (Demarais et al. Citation2000) and also provides positive values and economic impacts for land (Mozumder et al. Citation2007). Because cover is a potentially important part of forest management for deer (Pollock et al. Citation1994; Lopez et al. Citation2001), understanding how it affects selection by deer is of interest to land managers. Pollock et al. (Citation1994) similarly described fine-scale vegetative selection by deer in southern Texas, the U.S., which has an annual precipitation of 55.0 cm with shrublands predominant, but a comparison with a different environment, such as annual precipitation of 138.7 cm with forests and agriculture predominant is warranted.
Our goal was to better understand vegetative characteristics important to the selection of heavily used areas. Our objective was to determine the vegetative differences between the most heavily used areas and unused areas selected at random within the home range of adult male deer. We hypothesized that deer would select areas with vegetative characteristics that increase structural cover as a means of predator avoidance (Creel and Winnie Citation2005; Doherty et al. Citation2008; Bonnot et al. Citation2013) relative to unused areas. Quantifying vegetative characteristics deer select at fine scales could inform land management actions to attract and hold deer on a landscape, thus improving land values for deer hunting.
Materials and methods
Study site
Our study was conducted on approximately 20,000 ha in Yazoo and Madison counties in west-central Mississippi () near Canton, Mississippi, U.S. Mississippi is characterized as a subtropical humid climate, with long, hot summers and short, mild winters. The study area is located within an alluvial valley with flat topography.
Figure 1. Study area (approximately 22,250 hectares) containing collared white-tailed deer in west-central Mississippi, U.S
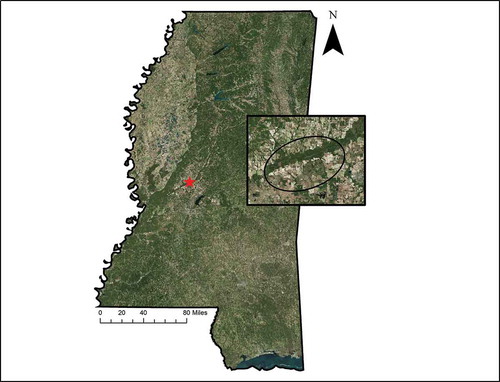
Deer were exposed to a variety of predation risk during the study. Recreational hunters recorded 7,723 hunting events during the 2017–18 hunting season. The study area had unquantified resident populations of coyotes (Canis latrans) and bobcats (Lynx rufus).
Land cover in our study area is characterized into two major groups: forest and agriculture. Coniferous forests comprise approximately 3,000 ha (15%) of the study area, mostly in commercial loblolly pine (Pinus taeda) plantations. Upland mixed deciduous forests comprise approximately 3,400 ha (17%). Within these dry sites, important understory species include American beautyberry (Callicarpa americana), Rubus spp. and Smilax spp. These species produce abundant cover and are important foraging options for deer. Bottomland hardwoods comprise approximately 7,500 ha (38%) bordering the Big Black River, which forms the border between counties and inundates the bottomland hardwoods during wet periods. The river bottom contains abundant oaks (Quercus spp.), black cherry (Prunus serotine), and red maple (Acer rubrum). Important understory species are river oats (Chasmanthium latifolium), rivercane (Arundinaria gigantean), and dwarf palmetto (Sabal minor). Commercial agriculture (cotton, corn, soybeans, and peanuts) is the second most common land cover, making up the remaining 6,000 ha (30%) of the study area.
Capture and determining deer locations
We used dart rifles (Pneu-Dart, Inc., Williamsport, Pennsylvania) and drop nets to capture adult male deer (>2.5 years or older) during 30 September 2016–31 January 2017. We anesthetized deer using a solution of butorphanol, azaperone, and medetomidine (BAM; Zoopham, Windsor, Colorado, USA; Mich et al. Citation2008). We set dosages at 2.7 cc of BAM, with additional BAM administered if necessary. We attached GPS collars (Iridium Track M 3D, Lotek Wireless, Inc., Newmarket, Ontario, Canada) and uniquely numbered plastic and metal ear tags (Allflex U.S. Inc.) to each deer. Collars uploaded location fixes that were taken at 3-hour intervals during the 2017–2018 Mississippi hunting season, specifically 1 November 2017–31 January 2018. This time frame coincided with the modern-firearms season, which is when the most hunters are in the field. While anesthetized, we estimated age (Severinghaus Citation1949), measured body mass and neck diameter, and estimated Boone and Crocket antler score for each deer. We injected each deer subcutaneously with 3 cc of Nuflor (Merck Animal Health, AN Boxmeer, Netherlands) per 45 kg of body mass to prohibit possible infections. Reversal of BAM was performed using atipamezole at twice the total amount of BAM administered coupled to constant 0.5 cc of naltrexone. All capture methods were approved by the Mississippi State University Institutional Animal Care and Use Committee (Protocol #16-621).
Home range formation and sampling procedure
We calculated 85% Kernel Density Estimate (KDE) isopleths (home ranges) using the adehabitatHR package in Program R (Calenge 2011, version 3.5.1, R Core Team 2017, Vienna, Austria) using the ad hoc method for bandwidth estimation. We chose an 85% KDE to reduce the sampling area to areas located near the majority of deer’s locations and to reduce the overlap with other deer’s home ranges, to minimize male-male competition. Additionally, the ad hoc method is known to over-smooth the KDE (Rodgers and Kie Citation2010), which for our purposes produces a more liberal estimate of home range and provides more opportunity to identify areas of high and low intensity of use. We then loaded the home ranges into ArcMap v. 10.5 (ESRI, Environmental Systems Research Institute: Redlands, California, U.S.), with the locations of each deer overlaid with the home ranges. We calculated the number of GPS locations within each 50-m grid cell overlain on the home range to identify the most used and unused areas of each individual. We defined the most used areas as the two grid cells with the most locations of each specific buck, indicative of the most frequent and intense deer selection. We defined unused areas as two randomly selected grid cells within the home range that contained no locations. Potential unused cells had to be adjacent to at least one other unused cell, and we excluded unused cells located in fallow agricultural fields, roads, or open water.
We sampled vegetation at the geographic center, identified by latitude and longitude, of each of two used and two unused grid cells. We recorded basal area (BA) using a wedge prism with a basal area factor of 10 (Bonham Citation1988; Elledge and Barlow Citation2012). We sampled vegetation using three randomly placed 15-m transects originating 1 m from cell center and orienting outward on a randomly selected azimuth. We estimated horizontal screening cover using a Nudds board (Nudds Citation1977) placed perpendicular at 2 locations along each transect and averaged all 5 height intervals. We measured drip-line canopy cover of four vegetation groups along each transect using the line-intercept method (Bonham Citation1988): thicket (semi-woody dwarf palmetto, river cane, and Rubus spp.), herbaceous (live or dead herbaceous vegetative matter, such as Solidago spp.), live woody (small trees and shrubs less than 3 m in height), and dead woody (logs > 3 m in diameter). We measured the height of vegetation from the forest floor up to 3 m at 1-m intervals along each transect and present the sum of values per transect as an index to vegetative height.
Statistical analysis
We fit a conditional logit model with regularization via the lasso using the clogitL1 package in Program R (Reid and Tibshirani Citation2014). The lasso utilizes the bias/variance trade-off to estimate the model that maximizes predictive accuracy (i.e. minimizes variance) using a model coefficient penalization parameter λ. At λ = 0, the model is identical to a standard conditional logit model (e.g. fit using the clogit function in the survival package; Therneau and Grambsch Citation2000). As λ increases, the magnitudes of model coefficients are reduced such that uninformative coefficients approach zero and are removed from the model. Selection of λ is performed using cross validation across a λ gradient. We identified the value of λ that minimized the default cross-validation statistic and thus maximized the predictive accuracy of the model (Reid and Tibshirani Citation2014). It is important to note that, because the lasso systematically introduces bias to model coefficients thereby minimizing variance and maximizing predictive accuracy, lassoed regression produces no P-values or confidence intervals but rather relies on the cross-validation metric to arrive at the model that best predicts held-out or new data (James et al. Citation2017). In this fashion, the lasso simultaneously performs both model and variable selection in a statistically rigorous fashion where unnecessary or autocorrelated parameters are reduced to a magnitude of zero. This accommodates the possibility of overfitting our conditional logit model and addresses common concerns about the interpretation of P-values (Wasserstein and Lazar Citation2016) and model selection procedures in ecology (Fieberg and Johnson Citation2015). However, we used a Poisson regression (with a log link) to document the potential autocorrelation between Nudds values and the individual variables that may contribute to its value.
We compared vegetative characteristics between used and unused areas with an analysis of variance (ANOVA) in Program R (Kaufmann and Schering Citation2014). We log+1 transformed our data to best fit the assumption of normality. We back transformed and report raw means and standard deviations and considered differences significant at α = 0.05.
Results
Collars on 22 adult males with an average age of 4.0 years (SD = 1.0, range = 2.5–5.5) generated 17,904 location estimates with an average horizontal dilution of precision (HDOP, a measure of location accuracy) of 3.2. After excluding 420 locations with HDOP > 10 (Street et al. Citation2016), we used an average of 814 fixes (SD = 128.9, range = 670–950 fixes, 92.2% fix-rate success) to calculate 85% KDE home ranges for 1 November 2017–31 January 2018. Home ranges averaged 227.1 ha (SD = 136.8, range = 50.8–543.1). Heavily used grid cells contained an average of 34 location estimates (SD = 24.2, range = 7–109).
Deer selected heavily used cells with greater height and canopy cover of vegetation types compared to unused cells (). Vegetation within heavily used cells was 20% taller and provided 56% greater Nudds screening cover and >120% greater coverage of thicket and herbaceous plants.
Table 1. Vegetative structural characteristics (mean (standard deviation)) in the most heavily used and unused areas of 22 white-tailed deer home ranges during the 2017–18 modern-weapons hunting season in west-central Mississippi, USA
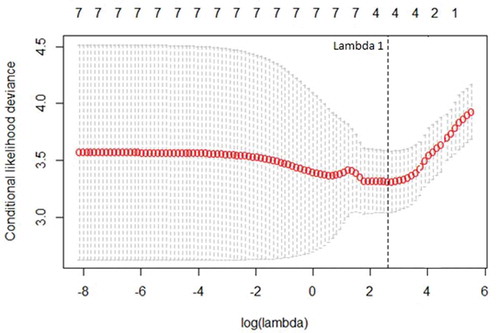
The cross-validation deviance curve identified λ = 2.76 (Lambda 1) as the penalization value minimizing the variance of the model (). The final reduced model identified four of seven vegetation variables that were different between heavily used and unused cells and positively related to use of an area: thicket (ß = 0.074), herbaceous (ß = 0.022), live woody (ß = 0.003), and dead woody (ß = 0.019). Basal area, height, and Nudds board values were dropped from the final model (i.e. ß = 0). Our Poisson regression revealed that Nudds values were predicted reasonably well by thicket (ß = 0.02), herbaceous (ß = 0.008), and live woody variables (ß = 0.006; R2 = 0.23).
Figure 2. Cross-validation deviance curve showing at which point lambda 1 was identified by minimizing the cross-validation statistic and maximizing predictive accuracy of the model by reducing uninformative variable coefficients to 0
Discussion
We found support for our hypothesis that vegetative characteristics that should be conducive to predator avoidance are more likely to be selected within heavily used areas in home ranges of white-tailed deer (Creel et al. Citation2005; Jayakody et al. Citation2008; Willems et al. Citation2009). Previous studies have frequently found that vegetation providing screening cover, in particular, was more abundant in areas that were heavily used by species across taxa (Creel et al. Citation2005; Bonnot et al. Citation2013; Lone et al. Citation2015).
Although fine-scale selection during the current study was likely a means of predator avoidance, we cannot infer that deer selected these vegetative characteristics specifically to avoid hunters during the hunting season because there were no un-hunted areas for comparison. In fact, Pollock et al. (Citation1994) reported that adult male deer in southern Texas, U.S. selected greater screening cover during all four seasons, so this is likely a generalized predator avoidance strategy that applies regardless of the presence of hunting risk. Additionally, habitat selection varies by sex during some seasons of the year (Bowyer et al. Citation2002), so we are unable to extrapolate our results fully to both genders, nor exclude potential effects related to breeding season.
Our reduced model did not include Nudds board values, despite greater values in heavily used cells, which would correlate to greater screening cover (Nudds Citation1977). This is likely because the individual selected variables were thicker vegetation that provides cover (Tufto et al. Citation1996; Benhaiem et al. Citation2008; Ferreguetti et al. Citation2015). Clearly, the selected variables should covary with Nudds board values (Guthery et al. Citation1981). Our conditional logit model selecting these vegetation metrics over the Nudds board values demonstrates that these better covary with selection. Deer may not perceive visual obstruction as being more important than the physical characteristics of obstruction (i.e. plant configuration, species, etc.). From this perspective, the propensity for deer to selectively use their habitat is not dependent on Nudds values, per se. This is not to say that Nudds board values are irrelevant; indeed, they can be a useful surrogate for cover when used by managers. Instead, we suggest that Nudds board values can be limiting from a human perspective because they equate all cover and disregard selectivity for the vegetation characteristics that create cover. By shifting from Nudds values to vegetation indices, we create the opportunity to encourage management practices promoting specific vegetative conditions based on the characteristics of habitat selected by deer rather than a correlative and subjective metric.
The greater importance of individual vegetative variables demonstrates that site selection may have been influenced by more than just screening cover. Thermal protection and forage availability are important determinants of space use and should be considered when discussing selection (Meiners and Obermaier Citation2004; Street et al. Citation2013). Moose (Alces alces) chose birth-sites based on micro-site characteristics that provided predator avoidance and beneficial nutritional characteristics (Bowyer et al. Citation1999), so deer in our study may also have considered forage availability (Miller and Miller Citation1999) in their selection decisions.
The greater vegetative height in used cells was not chosen as being influential towards selection within our model, even though vegetative height does contribute to protective cover (Ebensperger and Hurtado Citation2005; Jacob Citation2008). We speculate that the other variables may have just contributed relatively more than vegetative height to fine-scale habitat selection in our study.
Survival is increased when organisms select habitat with greater available cover (Heck and Thoman Citation1981; Babbitt and Tanner Citation1998; Hovel and Lipcius Citation2002; Lowrey et al. Citation2019). Crabs have increased survival in areas with more structural cover (Heck and Thoman Citation1981) due to its impact on predator effectiveness (Hovel and Lipcius Citation2002). While we did not directly test survivability, we expect deer would increase survival by selecting areas with greater cover.
This study provides insight into habitat selection in a forested landscape of mature male white-tailed deer during the modern-firearms hunting season. The potential to increase economic benefits from managing for game species provides an incentive to better understand how forest management techniques benefit these animals. Many areas that deer selected were created by common forest management techniques, such as thinning and clear-cuts. By utilizing these common disturbances, forest managers can benefit organisms that use these areas, while also accomplishing their own goals towards forest management.
Acknowledgments
We thank W. Watson, T. Jamieson, and S. Bassett for fieldwork and landowners for access to their property. We thank the Mississippi Department of Wildlife, Fisheries, and Parks for financial and logistical support using resources from the Federal Aid in Wildlife Restoration Act. Our research was authorized by the Mississippi Department of Wildlife, Fisheries, and Parks scientific collection permit numbers 0922161 and 1016171.
Disclosure statement
No potential conflict of interest was reported by the authors.
References
- Babbitt KJ, Tanner GW. 1998. Effects of cover and predator size on survival and development of Rana utricularia tadpoles. Oecologia. 114:258–262.
- Benhaiem S, Delon M, Lourtet B, Cargnelutti B, Aulagnier S, Hewison AJM, Morellet N, Verheyden H. 2008. Hunting increases vigilance levels in roe deer and modifies feeding site selection. Anim Behav. 76:611–618.
- Bonham CD. 1988. Measurements for terrestrial vegetation. Fort Collins (Colorado): John Wiley & Sons.
- Bonnot N, Morellet N, Verheyden H, Cargnelutti B, Lourtet B, Klein F, Hewison AJM. 2013. Habitat use under predation risk: hunting, roads and human dwellings influence the spatial behaviour of roe deer. Eur J Wildl Res. 59:185–193.
- Bose S, Forrester TD, Casady DS, Wittmer HU. 2018. Effect of activity states on habitat selection by black-tailed deer. J Wildl Manage. 82(8), 1711–1724..
- Bowyer RT, Stewart KM, Wolfe SA, Blundell GM, Lehmkuhl KL, Joy PJ, McDonough TJ, Kie JG. 2002. Assessing sexual selection in deer. J Wildl Manage. 66:536–544.
- Bowyer RT, Van Ballenberghe V, Kie JG, Maier JAK. 1999. Birth-site selection by Alaskan moose: maternal strategies for coping with a risky environment. J Mammal. 80:1070–1083.
- Calenge C. 2015. Home range estimation in R : the adehabitatHR package. R Vignette. 1–60.
- Creel S, Winnie J, Maxwell B, Hamlin K, Creel M. 2005. Elk alter habitat selection as an antipredator response to wolves. Ecology. 86:3387–3397.
- Creel S, Winnie JA. 2005. Responses of elk herd size to fine-scale spatial and temporal variation in the risk of predation by wolves. Anim Behav. 69:1181–1189.
- Davis SK. 2005. Nest-Site Selection Patterns and the Influence of Vegetation on Nest Survival of Mixed-Grass Prairie Passerines. Condor. 107:605–616.
- Demarais S, Miller KV, Krausman PR. 2000. White-tailed deer. In: Ecology and management of large mammals in North America (pp. 601–619). Prentice Hall, Upper Saddle River, New Jersey.
- Doherty KE, Naugle DE, Walker BL, Graham JM. 2008. Greater sage-grouse winter habitat selection and energy development. J Wildl Manage. 72:187–195.
- Ebensperger LA, Hurtado MJ. 2005. On the relationship between herbaceous cover and vigilance activity of degus (Octodon degus). Ethology. 111:593–608.
- Elledge J, Barlow B. 2012. Basal area: a measure made for management. ANR-1371. Auburn, AL: Alabama Cooperative Extension System.
- Ferreguetti ÁC, Tomás WM, Bergallo HG. 2015. Density, occupancy, and activity pattern of two sympatric deer (Mazama) in the Atlantic Forest, Brazil. J Mammal. 96:1245–1254.
- Fieberg J, Johnson DH. 2015. MMI: multimodel inference or models with management implications? J Wildl Manage. 79:708–718.
- Guthery FS, Doerr TB, Taylor MA. 1981. Use of a profile board in sand shinnery Oak communities. J Range Manage. 34:157–158.
- Heck KL, Thoman TA. 1981. Experiments on predator-prey interactions in vegetated aquatic habitats. J Exp Mar Bio Ecol. 53:125–134.
- Hovel KA, Lipcius RN. 2002. Effects of seagrass habitat fragmentation on juvenile blue crab survival and abundance. J Exp Mar Bio Ecol. 271:75–98.
- Jacob J. 2008. Response of small rodents to manipulations of vegetation height in agro-ecosystems. Integr Zool. 3:3–10.
- James G, Witten D, Hastie T, Tibshirani R. 2017. An introduction to statistical learning with applications in R. New York (NY): Springer.
- Jayakody S, Sibbald AM, Gordon IJ, Lambin X. 2008. Red deer Cervus elephus vigilance behaviour differs with habitat. Wildl Biol. 14:81–91.
- Kaufmann, J., & Schering, A.G. (2014). Analysis of variance ANOVA. Wiley StatsRef: Statistics Reference Online.
- Lehtiniemi M. 2005. Swim or hide: predator cues cause species specific reactions in young fish larvae. J Fish Biol. 66:1285–1299.
- Lima SL, Dill LM. 1990. Behavioral decisions made under the risk of predation: a review and prospectus. Can J Zool. 68:619–640.
- Lone K, Loe LE, Meisingset EL, Stamnes I, Mysterud A. 2015. An adaptive behavioural response to hunting: surviving male red deer shift habitat at the onset of the hunting season. Anim Behav. 102:127–138. Elsevier Ltd.
- Lopez RR, Silvy NJ, Wilkins RN, Frank PA, Petersn MJ, Peterson MN. 2001. Habitat-use patterns of florida key deer : implications of urban development. J Wildl Manage. 68:900–908.
- Lowrey B, Devoe J, Proffitt KM, Garrott RA. 2019. Hiding without cover? Defining Elk security in a beetle-killed forest. J Wildl Manage. 84::138–149. John Wiley & Sons, Ltd.
- Meiners T, Obermaier E. 2004. Hide and seek on two spatial scales - Vegetation structure effects herbivore oviposition and egg parasitism. Basic Appl Ecol. 5:87–94.
- Mich PM, Wolfe LL, Sirochman TM, Sirochman MA, Davis R, Lance WR, Miller MW. 2008. Evaluation of intramuscular butorphanol, azaperone, and medetomidine and nasal oxygen insufflation for the chemical immobilization of white-tailed deer, Odocoileus virginianus. J Zoo Wildl Med. 39:480–487.
- Miller JH, Miller KV. 1999. Forest plants of the Southeast and their wildlife uses. Auburn (Alabama, USA): Southern Weed Science Society, Craftmaster Printers.
- Mozumder P, Starkbuck CM, Berrens RP, Alexander S. 2007. Lease and fee hunting on private lands in the U.S.: a review of the economic and legal issues. Human Dimens Wildl. 12:1–14.
- Nudds T. 1977. Quantifying the vegetative structure of wildlife cover. Wildl Soc Bull. 1:113–117.
- Pollock MT, Whittaker DG, Demarais S, Zaiglin RE. 1994. Vegetation characteristics influencing site selection male white-tailed deer Texas. J Range Manage.47(3), 235–239.
- Ratikainen II, Panzacchi M, Mysterud A, Odden J, Linnell J, Andersen R. 2007. Use of winter habitat by roe deer at a northern latitude where Eurasian lynx are present. J Zool. 273:192–199.
- Reid S, Tibshirani R. 2014. Regularisation paths for conditional logistic regression: the clogitL1 package. J Stat Softw. 58:1–23.
- Riedle JD, Shipman PA, Fox SF, Leslie DM. 2006. Microhabitat use, home range, and movements of the Alligator Snapping Turtle, Macrochelys Temminckii, in Oklahoma. Southwest Nat. 51:35–40.
- Rodgers AR, Kie JG. 2010. HRT: home range tools for ArcGIS-draft user’s manual. Ontario: Ontario Ministry of Natural Resources.
- Samuel MD, Pierce DJ, Garton EO. 1985. Identifying areas of concentrated use within the home range. J Anim Ecol. 54:711–719.
- Severinghaus WC. 1949. Tooth development and wear as criteria of age in white-tailed deer. J Wildl Manage. 13:195–216.
- Street GM, Fieberg J, Rodgers AR, Carstensen M, Moen R, Moore SA, Windels SK, Forester JD. 2016. Habitat functional response mitigates reduced foraging opportunity: implications for animal fitness and space use. Landsc Ecol. 31:1939–1953. Springer Netherlands.
- Street GM, Weckerly FW, Schwinning S. 2013. Modeling forage mediated aggregation in a gregarious ruminant. Oikos. 122:929–937.
- Tabor RA, Wurtsbaugh WA. 1991. Predation risk and the importance of cover for juvenile rainbow trout in lotic systems. Trans Am Fish Soc. 120:728–738.
- Therneau TM, Grambsch PM. 2000. Modeling survival data: extending the Cox model. New York (NY): Springer.
- Tufto J, Andersen R, Linnell J. 1996. Habitat use and ecological correlates of home range size in a small cervid: the roe deer. J Anim Ecol. 65:715.
- USFWS. 2016. 2016 national survey of fishing, hunting, and wildlife-associated recreation..
- Verdolin JL. 2006. Meta-analysis of foraging and predation risk trade-offs in terrestrial systems. Behav Ecol Sociobiol. 60:457–464.
- Wagner DM, Feldhamer GA, Newman JA. 2000. Microhabitat Selection of Golden Mice (Ochrotomys nuttalli) at Arboreal Nest Sites. Am Midland Nat. 144:220–225.
- Wasserstein RL, Lazar NA. 2016. The ASA’s statement on p -values: context, process, and purpose. Am Stat. 70:129–133. Taylor & Francis.
- Werner EE, Hall DJ. 1988. Ontogenetic habitat shifts in bluegill : the foraging rate-predation risk trade-off. Ecol Soc. 69:1352–1366.
- Willems EP, Barton RA, Hill RA. 2009. Remotely sensed productivity, regional home range selection, and local range use by an omnivorous primate. Behav Ecol. 20:985–992.