
ABSTRACT
Degradation of old-growth forests is an important issue for global biodiversity conservation. Robust indicator species greatly facilitate the identification of old-growth forests requiring protection. Understanding why particular species are associated with priority forests is necessary for assessing the reliability of indicator species. Here, we surveyed the vegetation of 69 sites in Yambaru forests (Okinawa Island) varying in forest age and analyzed the relationships between the dominance of vascular species and three criterion parameters (forest age and species richness (SR) of epiphytes and endangered plants). Eleven species showing significant positive correlations with three parameters were designated as potential candidate indicator species, ten of which were woody species. Of the above eleven candidate indicator species, Distylium racemosum was considered one of the most useful indicator species because it can be easily identified in the field and its ecological characteristics are well documented. Regarding three woody traits – sprouting ability, annual growth rate and wood density – which are expected as the cause of indexing, endangered SR increased when tree species with low sprouting ability and high wood density were dominant, and epiphyte SR increased when tree species with low annual growth rate and high wood density were dominant. These woody species traits were associated with forest age and could explain why D. racemosum is an indicator of priority forest. These results suggest that large trees with such woody characteristics are effective indicators of priority forests.
Introduction
Forest degradation is a critical threat to global biodiversity (Achard et al. Citation2002; Keenan et al. Citation2015). Even in biodiversity hotspots, natural vegetation covers less than 20% of its original area (Sloan et al. Citation2014), and areas with protected forests are still in need of expansion (Rodrigues et al. Citation2004). Remaining old-growth forests that retain high-value ecological functions such as biodiversity conservation, nutrient dynamics and stable systems (Wirth Citation2009; Gibson et al. Citation2011) must be urgently found and protected. The role of indicator species has become increasingly important in biodiversity conservation (Lindenmayer Citation1999; Mac Nally and Fleishman Citation2004; Siddig et al. Citation2016) and one literature review has suggested that research on indicator species is increasing (Borrett et al. Citation2014). Although there are several high-performance indicators of ecosystem health (Rey Benayas et al. Citation2009; Lindenmayer and Likens Citation2011; Montréal Process Working Group Citation2015), the selection of indicators for assessing the suitability of areas for protection depends on ecosystem type or region given that the dynamics of ecosystems can vary depending on species composition and environmental conditions (Wolters et al. Citation2006; Barlow et al. Citation2007; Suding Citation2011). Indeed, specialized indicators are often applied to specific ecosystems or regions in the case of forest ecosystems (Lawton et al. Citation1998; Ferris and Humphrey Citation1999; Dumortier et al. Citation2002; Lohbeck et al. Citation2012; Gao et al. Citation2015; Suganuma and Durigan Citation2015), while other studies have attempted to develop more general indicators for application to forests at larger spatial scales (Noss Citation1999; Lindenmayer et al. Citation2000; Blattert et al. Citation2017).
Various plant species may serve as indicator species of biodiversity (Gao et al. Citation2015; Siddig et al. Citation2016). Among plant species, woody species are considered to be associated with biodiversity or ecosystem function in forests and affect other taxa, by providing microhabitats such as tree cavities (Remm and Lõhmus Citation2011; Larrieu et al. Citation2018; Paillet et al. Citation2018; Cockle et al. Citation2019), food resources (Molleman et al. Citation2006; Bässler et al. Citation2010; Felton et al. Citation2010) and structural heterogeneity (Lutz et al. Citation2013), in addition to regulating microclimate (Nepstad et al. Citation1994; Martin et al. Citation2001; Rambo and North Citation2009; Meakem et al. Citation2018) and nutrient cycling (Nepstad et al. Citation1994; Meakem et al. Citation2018). For these reasons, woody species diversity often indicates cross-taxon congruence (Howard et al. Citation1998; Kati et al. Citation2004; Barlow et al. Citation2007) and some functional woody species are expected to be biodiversity indicators. In addition to woody species, it is possible that a shrub or herb species may indicate the diversity and ecological function of the forest because the composition of forest floor vegetation change greatly depending on the condition of upper trees, light conditions and disturbance (Mölder et al. Citation2008; Baeten et al. Citation2009; Durak Citation2012). Therefore, it is important to screen a wide range of plant species in order to search for indicator species.
Recent studies of indicators have highlighted the importance of identifying the reasons why indicator species act as robust indexes for enhancing their reliability as an indicator of ecosystem health (Siqueira et al. Citation2012; Siddig et al. Citation2016). Indeed, understanding why species act as robust indexes of forest conditions will facilitate the ability of conservation managers to implement adaptive management schemes and make management decisions (Landres et al. Citation1988; Wortley et al. Citation2013). Species traits or individual characters, such as tree size, wood density, and leaf area index, have been suggested to be biological traits linked with forest succession. For example, the existence of large trees is associated with the ecological function and habitat diversity of forests (Lutz et al. Citation2013; Lindenmayer and Laurance Citation2016) and is often used as an indicator of forest restoration (Gatica‐Saavedra et al. Citation2017). High wood density is positively correlated with the longevity of woody species, suggesting that they can be dominant in forests at late successional stages (Poorter et al. Citation2008; Lasky et al. Citation2014; Wilfahrt et al. Citation2014). However, additional research is needed to elucidate the direct relationship between woody species traits and plant diversity.
Clear-cut forestry is one of the main causes of the degradation of forest biodiversity (Gibson et al. Citation2011; Tapia-Armijos et al. Citation2015; Barlow et al. Citation2016). In forestry areas, remnant old-growth forests are more likely to be in better condition and harbor biodiversity (Honnay et al. Citation1999; Brown and Gurevitch Citation2004; Montréal Process Working Group Citation2015). Several species, including highly endangered ones, often depend exclusively on old-growth forest for various reasons, such as the existence of mutualistic specialist partners or a sufficient number of cavities in large trees, and the specific relationships are often vulnerable to disturbance (Devictor et al. Citation2008; Clavel et al. Citation2011). However, distributional information on endangered species in intact forests is often insufficient for developing conservation strategies primarily because of the large time costs and the lack of manpower required to collect information on endangered species. Thus, common species of old-growth forests would make more effective indicators for the conservation of biodiversity compared with endangered species.
The forests of the Yambaru region on Okinawa Island are considered irreplaceable habitats for many endemic endangered species that reflect the biogeographical history of the island chain (Motokawa Citation2000; Nakamura et al. Citation2009). This area has become a candidate UNESCO World Natural Heritage Site because of the biogeographic importance of the biota (IUCN Citation2018). In general, the remaining old-growth forests have high conservation value because natural forests on islands are rare (Ingram Citation1992; Mueller-Dombois and Fosberg Citation1998; Abe et al. Citation2018a). The Yambaru forest, however, has been subjected to forestry practices for several hundred years (Nakasuga Citation1995; Nakama Citation2007). Indeed, most of the area has experienced a clear-cut at least once () and is made up of relatively young forests less than 100 years old (Saito Citation2011). Therefore, forestry has long been the major threats to biodiversity in the Yambaru region (Itô et al. Citation2000; Kubota et al. Citation2005). Although some endemic species such as the long-armed scarabaeid beetle Cheirotonus jambar and the epiphytic orchid Dendrobium okinawense have become symbols of Yambaru’s biodiversity, most of the endemic endangered species including C. jambar and D. okinawense depend on the remaining old-growth forest fragments for their survival. Despite this critical situation, knowledge of the distribution of endemic species in the region is poor yet necessary for identifying forests suitable for protection and for planning protected areas. Given that old-growth forests are scattered and highly fragmented in the Yambaru region, there is a need to develop a simple method, such as indicator species, for identifying priority forests requiring protection.
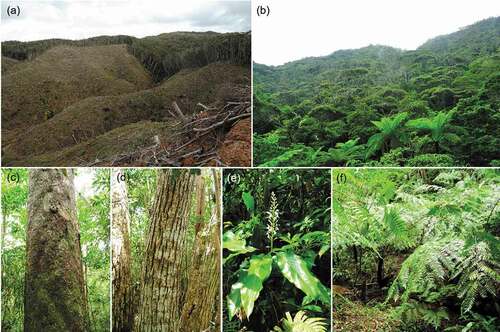
Figure 1. Photographs of Yambaru forests and tree species. (a) deforested land, (b) evergreen Castanopsis sieboldii forests, (c) typical bark of Distylium racemosum with brown and dull green patches, (d) typical bark of C. sieboldii with vertical breaks, (e) the understory indicator Alpinia intermedia, and (f) the understory indicator Cyathea podophylla.
The aim of this study was to develop a simple indicator of old-growth forests with high conservation priority and to clarify the cause–effect relationships of indicator efficacy. Although Kubota et al. (Citation2005) found a correlation between the amount of dominant tree species and plant species diversity, the potential for vascular species to serve as indicators has not been comprehensively examined. Here, we analyzed the indicator properties for a wide range of plant species including shrubs and herbs. We also analyzed the relationship between topographical conditions, representing natural factors that were assumed to affect species richness (SR), and forest age, representing the anthropogenic factor (specifically, time since deforestation). In addition, we examined the relationship between woody species traits and criterion parameters for selecting indicator species (forest age, epiphyte SR and endangered SR) to explain what makes woody species robust indicators.
Methods
Study site
The Ryukyu Chain consists of a chain of continental islands scattered across approximately 1200 km between Kyushu, Japan and Taiwan. As the sea level fluctuated during the Pleistocene, various organisms became stranded on islands and evolved to adapt to these insular environments. The Yambaru region is located in the northern mountainous portion of Okinawa Island (26.59–26.87°N, 128.07–128.32°E), and the maximum altitude is 503 m. The climate is subtropical with a mean annual temperature of 20.9°C and mean annual precipitation of 2603 mm based on data from 1990 to 2019 at Oku weather station (Japan Meteorological Agency Citation2020). The mountainous area is primarily composed of Cretaceous to Tertiary phyllite and sandstone, which are deeply eroded because of the hot and humid climate. Coral reef-derived limestone areas are scattered in some places.
Humans have been present on the island for a long time and have long used the Yambaru forests for forestry. As a result, few intact primary forests in Yambaru remain, and many endemic plants and animals dependent on natural forests are currently threatened (Itô et al. Citation2000). Generally, studying the relationship between forest age and species diversity is difficult in subtropical and tropical region because tree rings are often unclear. In the Yambaru region, however, most areas have experienced clear-cut deforestation within the last 100 years, allowing forest age to be determined based on records from forest management ledgers and through analysis with aerial photographs. This history of clear-cut deforestation permits the effects of forest age on species diversity and species composition to be explored.
Data collection
To clarify vascular diversity, we conducted vegetation surveys using a phytosociological method in 10 m × 10 m square plots (N = 69) between 2015 and 2018. Heights of four layers – tree, subtree, shrub, and herb – were identified by eye along with vegetation cover (%) for each vascular species in each layer. Vegetation cover was given in 10% increments between 10% and 100% coverage, 1% increments between 1% and 10% coverage and 0.1% for less than 1% coverage. The dominance of each vascular species in a plot was evaluated by summing vegetation cover of the four layers. Sampling sites of the vegetation survey were selected so that a range of forest ages scattered across the mountainous region of Yambaru were sampled based on the forest-age map of Saito (Citation2011) (). All sampling sites consisted of forests with closed canopies and without gaps created by typhoons. The forest age of each plot was assessed using aerial photographs from 1944 to 2013. When the age from the aerial photographs did not contradict the age noted in the forest management ledger, the forest age noted in the ledger was used. When there was a contradiction, the forest status was checked using the aerial photographs of the relevant age frame, and the year of photography taken immediately after logging was defined as the renewal year. The position of the plot was recorded by GPS (Garmin eTrex30J). The slope direction, slope angle, and altitude at that point were derived from airborne LiDAR data (Nakanihon Air Service 2011) and were calculated as the average value of 1-m2 cells within a 5-m radius of the GPS coordinates. The slope direction was divided into eight directions, and the mode of the slope direction within a radius of 5 m was regarded as the direction of the plot. ArcGIS 10.4.1 and SAGA GIS 4.0.1 were used for these analyses. The survey plots were often located in the range of 150 to 350 m in altitude and 5 to 35 degrees in slope angle. The frequency of samples on southwestern-facing slopes was small; other than that, there was no major difference in the number of samples regarding slope direction (). The category of endangered species was based on the Japanese Red List (Ministry of the Environment Citation2019). Vascular nomenclature followed the taxonomy of Yonekura and Murata (Citation2012).
Figure 2. A map on the upper left shows the location of Okinawa Island with arrow. A large map indicates sampling sites (dots) scattered in the Yambaru area. The double lines indicate the main roads and the lower dashed line is the village boundary
Figure 3. Frequency distribution of survey plots. (a) Altitude (m), (b) slope angle, and (c) slope direction
Data analysis
The effects of topographical conditions (slope angle, slope direction and altitude) and forest age on vascular SR, epiphyte SR and endangered SR were analyzed by a Poisson-linked generalized linear model (GLM). In addition, we analyzed the species composition of each stand by vegetation cover. Detrended correspondence analysis (DCA) was performed to analyze the effects of topographical conditions and forest age on species composition using the vegan package in R (R Core Team Citation2015). Five independent DCAs were conducted for the species composition for all layers and for each of the four layers. The effects of topographical conditions and forest age on DCA plot scores were then examined using a Gaussian-linked GLM.
To extract the indicator species of priority forest, the relationship between dominance of vascular species with 10 or more occurrences among 69 plots and three criterion parameters (forest age, epiphyte SR and endangered SR) was analyzed by linear regression, and the significance of the Pearson’s product-moment correlation coefficient was examined using a correlated t-test. Because vascular SR does not become the highest in the forests to be protected (e.g. intermediate disturbance hypothesis), it was excluded from the selection criterion for indicator species.
To evaluate the effects of woody species traits on species composition and diversity, we used the following three traits. As a measure of sprouting ability, we used the data described in Wu et al. (Citation2008), in which the numbers of sprouts per stamp were surveyed 5 years after cutting in the Yambaru region. Wood density data collected from Yambaru forest were obtained from Fujii et al. (Citation2009). Data on the annual growth rate were obtained from unpublished data measured by Takashima and Inafuku (Citation2017) in Yambaru forest. The survey interval for growth data by Takashima and Inafuku (Citation2017) was 76–89 months, and the annual growth value was converted to the percentage of the original size. Among the tree species described in these resources, we selected species with a frequency greater than 10 in our survey data. We then calculated the plot trait score. The plot trait score was modified from Wilfahrt et al. (Citation2014) – the mean of the abundance-weighted trait value for woody species present in that plot – and was calculated using the following formula: PSi = Σ (vj * Dj)/Ni, where PSi is the plot trait score in plot i, vj is the trait value of species j, Dj is the dominance of species j, and Ni is the number of species with the trait value in plot i. This calculation was conducted for three traits: sprouting ability, annual growth rate, and wood density.
The relationships among the three woody species traits on the DCA plot score of all layers combined were analyzed using generalized linear models (GLMs). The two GLM analyses assumed a Gaussian error distribution and were performed with two DCA plot scores (DCA1 and DCA2) as a response variable, and with plot trait scores of the three traits as explanatory variables. We also used a GLM analysis to analyze the relationships among the three traits and the three criterion parameters. The three GLM analyses assumed a Poisson error distribution and were performed with three criterion parameters as response variables, and with plot trait scores of the three traits as explanatory variables.
Results
We recorded 272 vascular species in 69 plots. Among these, 35 species were observed in the tree layer, 100 species in the subtree layer, 134 species in the shrub layer and 258 species in the herb layer. We also recorded 14 endangered species, 11 alien species and 10 epiphyte species. The most dominant species in the tree layer was Castanopsis sieboldii (relative dominance 34.7%) followed by Pinus luchuensis (24.7%), Schima wallichii subsp. noronhae (11.4%), Quercus miyagii (6.1%) and D. racemosum (5.9%).
Effects of environmental conditions and forest age on SR are shown in . Forest age was not significantly correlated with vascular SR but was significantly correlated with epiphytic SR and endangered SR (see also Fig. S1). Altitude was significantly positively correlated with all SRs, and slope was also significantly correlated with vascular SR. Slopes facing south-southwest tended to have low vascular SR, but no other significant relationships were detected regarding slope direction.
Table 1. Effects of environmental conditions and forest age on species richness. SR: species richness. Significant p-values at the 5% level are shown in bold
Although some DCA1 scores were correlated with altitude and slope angle, forest age was significantly correlated with the DCA1 of all layers combined and for the four individual layers (), which suggests that DCA1 captures variation in forest age. What DCA2 represents remains unclear because the significance of its correlation was weak. However, DCA2 was the only variable that was significantly correlated with altitude in the subtree layer and was also marginally correlated with altitude in the herb layer, which may be a factor partially related to altitude (, see also Table S1 for details of statistical values).
Table 2. Significant effects (P < 0.05) of topographical conditions and forest age on DCA plot score for all layers combined and each layer individually. +: positive and -: negative
Of the 109 species with an occurrence frequency of 10 or greater, the dominance of 54 species was significantly correlated (including negative correlations) with any of the three criterion parameters at the 5% level (Table S2). Woody life forms (tree, subtree and shrub) had a high proportion of species that had a significant positive correlation with forest age, while herb or vine tended to have a negative correlation (). Similarly, for epiphyte SR () and endangered SR (), the proportions of species with a significant positive correlation tended to be higher in woody life forms, but there were no or few species that had a negative correlation. Many of the species where dominance was significantly correlated with the endangered SR were positively correlated with epiphyte SR (Table S2).
Figure 4. Proportion of the species by life form significantly correlated with (a) forest age, (b) epiphyte species richness (SR), and (c) endangered SR. Black bars represent positive and white bars represent negative
Aidia canthioides (frequency among 69 plots = 66.7%, median dominance among 69 plots = 1.0, maximum dominance among 69 plots = 31.0), Alpinia intermedia (71.0%, 1.0, 30.0), Cyathea podophylla (57.9%, 1.0, 85.0), Distylium racemosum (60.9%, 0.2, 70.0), Ilex warburgii (26.1%, 0.0, 8.0), Lasianthus attenuatus (27.5%, 0.0, 2.0), Lasianthus fordii (42.3%, 0.0, 10.0), Machilus japonica (21.7%, 0.0, 7.1), Meliosma rigida (39.1%, 0.0, 20.1), Psychotria rubra (56.5%, 0.1, 10.0) and Schefflera heptaphylla (75.4%, 1.0, 13.1) were significantly positively correlated with all three of these criterion parameters. Ten of these eleven species were woody species; the only exception was the herb A. intermedia. No species had two or more negative correlations.
Effects of plot trait scores on DCA plot score, forest age and SR are shown in . Wood density was strongly associated with DCA plot score and was significantly correlated with DCA1 and DCA2. Annual growth rate was significantly correlated with DCA2, and sprouting ability was not significantly correlated with either DCA1 or DCA2. Analysis of the effects of forest age and the two SRs on plot trait score revealed that sprouting ability was negatively correlated with forest age and endangered SR. Annual growth rate was positively correlated with forest age and negatively correlated with epiphyte SR. Wood density was positively correlated with forest age and the two SRs.
Table 3. Effects of plot trait scores on DCA plot score, forest age and species richness. SR: species richness. Significant p-values at the 5% level are shown in bold
Discussion
The dominance of many vascular species was significantly correlated with three criterion parameters (forest age and two SRs), and the eleven species that were positively correlated with all criterion parameters were potential indicator species of forests requiring protection in the Yambaru region. In contrast to species that were positively correlated with forest age, some pioneer woody species and sunny herb species were negatively correlated with forest age; however, none of these species had a significant correlation with SR. These results suggest that it is difficult to indicate forests requiring protection using the species that are negatively correlated with forest age. Among the eleven species that showed a positive correlation, A. intermedia, C. podophylla, and D. racemosum have especially conspicuous visual features () and can be easily identified based on their appearance. These three species together may be a more effective indicator (Howard et al. Citation1998; Siqueira et al. Citation2012; Vačkář et al. Citation2012).
Of the candidate species listed above, D. racemosum is the most well-understood species in terms of its ecological characteristics. This species is shade-tolerant (Aiba and Kohyama Citation1996; Takyu Citation1998; Sato et al. Citation1994) and is a primary component of evergreen climax forests where it is a most common tree species in warm parts of East Asia (Tanouchi and Yamamoto Citation1995; Aiba and Kohyama Citation1996; Nakao et al. Citation2014). Two factors explain why D. racemosum is a superior indicator: species traits (e.g., its slow growth) and disturbance regime (i.e., clear-cut forestry across the study area). Under natural regeneration, large-diameter trees exist only in stands that have not been cut for a long time. The slow growth of D. racemosum has been reported in Yambaru (Takashima et al. Citation2010) and other regions (Takyu Citation1998), making D. racemosum one of the hardest tree species in Japan (Fujiwara et al. Citation1992; Fujii et al. Citation2009). Thus, the presence of large D. racemosum trees reflects their long-term persistence in the forest that has not been disturbed for an extended period. Another reason why D. racemosum is a useful indicator species is its characteristic bark (), which is quite different from the most dominant C. sieboldii (). This feature is easily recognizable visually and would facilitate field searches for old-growth forests requiring protection. In addition, a large D. racemosum is considered a keystone species because it has important ecological functions that provide habitat to many endangered species, such as epiphytic Dendrobium okinawense (Abe et al. Citation2018b), hollow-nesting scarab beetle Cheirotonus jambar (Kurosawa Citation1984; Itô et al. Citation2000) and long-furred rat Diplothrix legata (Itô et al. Citation2000; Iwasa Citation2010). Furthermore, the proportion of animals that use tree cavities as shelters often exceeds expectations (Remm and Lõhmus Citation2011; Cockle et al. Citation2019). D. racemosum also affects the regeneration success of competing Castanopsis and evergreen Quercus in Japanese evergreen forests (Yamamoto Citation1994). Given these ecological functions, D. racemosum would be an excellent indicator species in the Yambaru forests.
The two other species easy to recognize are C. podophylla, a woody fern with heights 2–3 m or less (), and A. intermedia, a perennial herb in Zingiberaceae with characteristic white flowers (). Both are common species on the forest floor in Yambaru and are often found in areas with moist soil conditions. The high performance of these two species as indicators may stem from the fact that moist forests tend to become habitats for epiphytes and endangered species in subtropical Okinawa Island.
The positive correlation of SR with altitude and slope angle suggests that altitude and slope angle related to the history and gradient of anthropogenic disturbance in the mountainous areas of Yambaru. In the mountainous region that runs through the center of the Yambaru region from south to north, the low altitudes near the residential area have been the most disturbed, and the land use is likely to decrease toward the higher central mountains (Nakasuga Citation1995). Because most of the Yambaru forests have a history of deforestation, forest age should be indicative of various ecological processes; consistent with this expectation, a strong effect of forest age on the forest plant community was observed. However, forest age was not correlated with vascular SR. This lack of relationship between vascular SR and forest age by linear regression may stem from the fact that many species, not only forest trees but also sunny alien herbs, regenerate at the youngest sites soon after clear-cut (Paillet et al. Citation2010, see also Fig. S1). This result also supports the intermediate disturbance hypothesis that does not maximize diversity in the climax stage of succession (Connell Citation1978; Molino and Sabatier Citation2001). On the other hand, the fact that the SR of epiphyte and endangered species was positively correlated with forest age suggests that forest age has a selective effect on the survival of these functional species. In old-growth forests, the diversity of other organisms is generally high even if the diversity of plants is not high (e.g., Jeffries et al. Citation2006) and these other species have conservation value, such as providing special ecosystem functions (Barlow et al. Citation2007; Gibson et al. Citation2011; Lutz et al. Citation2013, Citation2018).
Most of the species positively correlated with three criterion parameters were woody species. This observation suggests that some property of trees contributes to increasing diversity in the Yambaru forests. The analysis of plot trait scores with the three criterion parameters revealed the following three main findings: (1) plots with older forests were dominated by trees with lower sprouting ability and higher wood density; (2) plots with higher endangered SR were dominated by trees with low sprouting ability and higher wood density; and (3) plots with higher epiphyte SR were dominated by trees with lower annual growth rate and higher wood density. Wood density is generally known to be a good indicator of forest succession (Lohbeck et al. Citation2012; Lasky et al. Citation2014; Wilfahrt et al. Citation2014), and a strong negative correlation between wood density and DCA1 plot score also supported this hypothesis. In secondary succession after clear-cut, species with high sprouting ability initially dominate, and species with low-sprouting ability are likely to increase in the later stages of the succession. Because of the clear-cut history in Yambaru, forest age is young overall, not enough time might have elapsed for species with low-sprouting ability to become predominant. This would explain why C. sieboldii is the most dominant species in Yambaru forests (Kubota et al. Citation2005). Even in other regions, the dominance of Castanopsis is thought to stem from its high sprouting ability after disturbance (Miura and Yamamoto Citation2003; Nanami et al. Citation2004). The negative correlation of sprouting ability with forest age suggests, conversely, that species with low-sprouting ability would likely be a minor component of young forest. In remnant old forest patches in a forestry zone, tree species with slow-growth, low-sprouting ability, and high wood density would become dominant; in parallel, several endangered or epiphyte species are more likely to survive only in such forests. In addition, it is expected that large-old trees will grow in such forests. Large-old trees have various ecosystem functions that support biodiversity, such as the provision of microhabitats and stable supplied of food resources (Lindenmayer and Laurance Citation2016). Once a large-old tree begins to have these functions, their effects last for an extended period as long as the tree lives; however, when the tree is lost, the time it takes for other small trees to acquire these functions is long. Clear-cut forestry that involves the removal of such large-old trees (Laurance Citation2000; Lutz et al. Citation2009; Lindenmayer et al. Citation2012, Citation2014) has reduced SR and many ecological functions in Yambaru (Itô et al. Citation2000).
In this study, we identified effective indicator species for designating forest reserves for biodiversity conservation using accurate forest age data. Distylium racemosum in particular was considered an effective indicator for priority forests and large trees with high wood density, low-sprouting ability, and slow growth rate would be an effective biodiversity indicator. These findings are useful for conservation and will facilitate the development of systematic indicators (Verissimo et al. Citation2011) for priority Yambaru forests, a candidate World Natural Heritage Site, and other similar forestry areas.
Supplemental Material
Download MS Excel (32 KB)Acknowledgments
We thank Dr. Nobuhiko Kotaka for help with fieldwork. We thank the Ministry of the Environment and Forest Agency for approving the field survey. We thank the Agriculture, Forestry and Fisheries Department of the Okinawa Prefecture for providing a portion of the DEM data. We thank Edanz Group (https://en-author-services.edanzgroup.com/ac) for editing the English text of a draft of this manuscript.
Disclosure statement
No potential conflict of interest was reported by the authors.
Supplementary material
Supplemental data for this article can be accessed here.
Additional information
Funding
Related Research Data
References
- Abe S, Kotaka N, Takashima A, Abe T, Satio K, Masaki T. 2018b. Host selection and distribution of Dendrobium okinawense, an endangered epiphytic orchid in Yambaru, Japan. Ecol Res. 33(5):1069–1073. doi:10.1007/s11284-018-1618-9.
- Abe T, Tanaka N, Shimizu Y. 2018a. Plant species diversity, community structure and invasion status in insular primary forests on the Sekimon uplifted limestone (Ogasawara Islands). J Plant Res. 131(6):1001–1014. doi:10.1007/s10265-018-1062-5.
- Achard F, Eva HD, Stibig HJ, Mayaux P, Gallego J, Richards T, Malingreau JP. 2002. Determination of deforestation rates of the world’s humid tropical forests. Science. 297(5583):999–1002. doi:10.1126/science.1070656.
- Aiba S, Kohyama T. 1996. Tree species stratification in relation to allometry and demography in a warm-temperate rain forest. J Ecol. 84(2):204–218. doi:10.2307/2261356.
- Baeten L, Bauwens B, De Schrijver A, De Keersmaeker L, Van Calster H, Vandekerkhove K, Roelandt B, Beeckman H, Verheyen K. 2009. Herb layer changes (1954-2000) related to the conversion of coppice-with-standards forest and soil acidification. Appl Veg Sci. 12(2):187–197. doi:10.1111/j.1654-109X.2009.01013.x.
- Barlow J, Gardner TA, Araujo IS, Ávila-Pires TC, Bonaldo AB, Costa JE, Esposito MC, Ferreira LV, Hawes J, Hernandez MIM, et al. 2007. Quantifying the biodiversity value of tropical primary, secondary, and plantation forests. Proc Natl Acad Sci USA. 104(47):18555–18560. doi:10.1073/pnas.0703333104
- Barlow J, Lennox GD, Ferreira J, Berenguer E, Lees AC, Mac Nally R, Thomson JR, Ferraz SFB, Louzada J, Oliveira VHF, et al. 2016. Anthropogenic disturbance in tropical forests can double biodiversity loss from deforestation. Nature. 535(7610):144–147. doi:10.1038/nature18326
- Bässler C, Müller J, Dziock F, Brandl R. 2010. Effects of resource availability and climate on the diversity of wood‐decaying fungi. J Ecol. 98(4):822–832. doi:10.1111/j.1365-2745.2010.01669.x.
- Blattert C, Lemm R, Thees O, Lexer MJ, Hanewinkel M. 2017. Management of ecosystem services in mountain forests: review of indicators and value functions for model based multi-criteria decision analysis. Ecol Ind. 79:391–409. doi:10.1016/j.ecolind.2017.04.025.
- Borrett SR, Moody J, Edelmann A. 2014. The rise of Network Ecology: maps of the topic diversity and scientific collaboration. Ecol Model. 293:111–127. doi:10.1016/j.ecolmodel.2014.02.019.
- Brown KA, Gurevitch J. 2004. Long-term impacts of logging on forest diversity in Madagascar. Proc Natl Acad Sci USA. 101(16):6045–6049. doi:10.1073/pnas.0401456101.
- Clavel J, Julliard R, Devictor V. 2011. Worldwide decline of specialist species: toward a global functional homogenization? Front Ecol Environ. 9(4):222–228. doi:10.1890/080216.
- Cockle KL, Ibarra JT, Altmamirano TA, Martin K. 2019. Interspecific networks of cavity-nesting vertebrates reveal a critical role of broadleaf trees in endangered Araucaria mixed forests of South America. Biodivers Conserv. 28(12):3371–3386. doi:10.1007/s10531-019-01826-4.
- Connell JH. 1978. Diversity in tropical rain forests and coral reefs. Science. 199(4335):1302–1310. doi:10.1126/science.199.4335.1302.
- Devictor V, Julliard R, Jiguet F. 2008. Distribution of specialist and generalist species along spatial gradients of habitat disturbance and fragmentation. Oikos. 117(4):507–514. doi:10.1111/j.0030-1299.2008.16215.x.
- Dumortier M, Butaye J, Jacquemyn H, van Camp N, Lust N, Hermy M. 2002. Predicting vascular plant species richness of fragmented forests in agricultural landscapes in central Belgium. For Ecol Manag. 158(1–3):85–102. doi:10.1016/S0378-1127(00)00674-5.
- Durak T. 2012. Changes in diversity of the mountain beech forest herb layer as a function of the forest management method. For Ecol Manag. 276:154–164. doi:10.1016/j.foreco.2012.03.027.
- Felton AM, Felton A, Foley WJ, Lindenmayer DB. 2010. The role of timber tree species in in the nutritional ecology of spider monkeys in a certified logging concession, Bolivia. For Ecol Manag. 259(8):1649. doi:10.1016/j.foreco.2010.01.042.
- Ferris R, Humphrey JW. 1999. A review of potential biodiversity indicators for application in British forests. Forestry. 72:313–328. doi:10.1093/forestry/72.4.313.
- Foley JA, Asner GP, Costa MH, Coe MT, DeFries R, Gibbs HK, Howard EA, Olson S, Patz J, Ramankutty N, et al. 2007. Amazonia revealed: forest degradation and loss of ecosystem goods and services in the Amazon Basin. Front Ecol Env. 5(1):25–32.
- Fujii S, Kubota Y, Enoki T. 2009. Resilience of stand structure and tree species diversity in subtropical forest degraded by clear logging. J For Res. 14(6):373–387. doi:10.1007/s10310-009-0151-7.
- Fujiwara S, Sameshima K, Kuroda K, Takamura N. 1992. Anatomy and properties of Japanese hardwoods I. Variation of fibre dimensions and tissue proportions and their relation to basic density. IAWA Bull. 12(4):419–424. doi:10.1163/22941932-90000544.
- Gao T, Nielsen AB, Hedblom M. 2015. Reviewing the strength of evidence of biodiversity indicators for forest ecosystems in Europe. Ecol Ind. 57:420–434. doi:10.1016/j.ecolind.2015.05.028.
- Gatica‐Saavedra P, Echeverría C, Nelson CR. 2017. Ecological indicators for assessing ecological success of forest restoration: a world review. Rest Ecol. 25(6):850–857. doi:10.1111/rec.12586.
- Gibson L, Lee TM, Koh LP, Brook BW, Gardner TA, Barlow J, Peres CA, Bradshaw CJA, Laurance WF, Lovejoy TE, et al. 2011. Primary forests are irreplaceable for sustaining tropical biodiversity. Nature. 478(7369):378–381. doi:10.1038/nature10425
- Honnay O, Hermy M, Coppin P. 1999. Effects of area, age and diversity of forest patches in Belgium on plant species richness, and implications for conservation and reforestation. Biol Conserv. 87(1):73–84. doi:10.1016/S0006-3207(98)00038-X.
- Howard PC, Viskanic P, Davenport TRB, Kigenyi FW, Baltzer M, Dickinson CJ, Lwanga JS, Matthews RA, Balmford A. 1998. Complementarity and the use of indicator groups for reserve selection in Uganda. Nature. 394(6692):472–475. doi:10.1038/28843.
- Ingram GB. 1992. The remaining islands with primary rain forest: a global resource. Environ Manag. 16(5):585–595. doi:10.1007/BF02589013.
- Itô Y, Miyagi K, Ota H. 2000. Imminent extinction crisis among the endemic species of the forests of Yanbaru, Okinawa, Japan. Oryx. 34(4):305–316. doi:10.1046/j.1365-3008.2000.00136.x.
- IUCN. 2018. IUCN World Heritage Evaluations 2018 –IUCN Evaluations of nominations of natural and mixed properties to the World Heritage List. WHC/18/42.COM/INF.8B2.
- Iwasa MA. 2010. Diplothrix legata (Thomas, 1906). In: Ohdachi SD, Ishibashi Y, Iwasa MA, Saitoh T, editors. The wild mammals of Japan. Kyoto: Shoukadoh Book Sellers; p. 177.
- Japan Meteorological Agency. 2020. Various climate data and materials. [accessed 2020 Mar 19]. https://www.jma.go.jp/jma/menu/menureport.html. Japanese.
- Jeffries JM, Marquis RJ, Forkner RE. 2006. Forest age influences oak insect herbivore community structure, richness, and density. Ecol Appl. 16(3):901–912.
- Kati V, Devillers P, Dufrene M, Legakis A, Vokou D, Lebrun P. 2004. Testing the value of six taxonomic group as biodiversity indicators at a local scale. Conserv Biol. 18(3):667–675. doi:10.1111/j.1523-1739.2004.00465.x.
- Keenan RJ, Reams GA, Achard F, Freitas JV, Grainger A, Lindquist E. 2015. Dynamics of global forest area: results from the FAO Global Forest Resources Assessment 2015. For Ecol Manag. 352:9–20. doi:10.1016/j.foreco.2015.06.014.
- Kubota Y, Katsuda K, Kikuzawa K. 2005. Secondary succession and effects of clear-logging on diversity in the subtropical forests on Okinawa Island, southern Japan. Biodivers Conserv. 14(4):879–901. doi:10.1007/s10531-004-0657-4.
- Kurosawa Y. 1984. Discovery of a new long-armed scarabaeid beetle (Coleoptera) on the island of Okinawa. Bull Natl Sci Mus Ser A Zool. 10:73–78.
- Landres P, Verner J, Thomas JW. 1988. Ecological use of vertebrate indicator species: a critique. Conserv Biol. 2(4):316–328. doi:10.1111/j.1523-1739.1988.tb00195.x.
- Larrieu L, Paillet Y, Winter S, Bütler R, Kraus D, Krumm F, Lachat T, Michel AK, Regnery B, Vandekerkhove K. 2018. Tree related microhabitats in temperate and Mediterranean European forests: A hierarchical typology for inventory standardization. Ecol Ind. 84:194–207. doi:10.1016/j.ecolind.2017.08.051.
- Lasky JR, Uriarte M, Boukili VK, Chazdon RL. 2014. Trait-mediated assembly processes predict successional changes in community diversity of tropical forests. Proc Natl Acad Sci USA. 111(15):5616–5621. doi:10.1073/pnas.1319342111.
- Laurance WF. 2000. Rainforest fragmentation kills big trees. Nature. 404(6780):836. doi:10.1038/35009032.
- Lawton JH, Bignell DE, Bolton B, Bloemers GF, Eggleton P, Hammond PM, Hodda M, Holt RD, Larsen TB, Mawdsley NA, et al. 1998. Biodiversity inventories, indicator taxa and effects of habitat modification in tropical forest. Nature. 391(6662):72–76. doi:10.1038/34166
- Lindenmayer DB. 1999. Future directions for biodiversity conservation in managed forests: indicator species, impact studies and monitoring programs. For Ecol Manag. 115(2–3):277–287. doi:10.1016/S0378-1127(98)00406-X.
- Lindenmayer DB, Laurance WF. 2016. The ecology, distribution, conservation and management of large old trees. Biol Rev. 92(3):1434–1458. doi:10.1111/brv.12290.
- Lindenmayer DB, Laurance WF, Franklin JF. 2012. Global decline in large old trees. Science. 338(6112):1305–1306. doi:10.1126/science.1231070.
- Lindenmayer DB, Laurance WF, Franklin JF, Likens GE, Banks SC, Blanchard W, Gibbons P, Ikin K, Blair D, McBurney L, et al. 2014. New policies for old trees: averting a global crisis in a keystone ecological structure. Conserv Lett. 7(1):61–69. doi:10.1111/conl.12013
- Lindenmayer DB, Likens GE. 2011. Direct measurement versus surrogate indicator species for evaluating environmental change and biodiversity loss. Ecosystems. 14(1):47–59. doi:10.1007/s10021-010-9394-6.
- Lindenmayer DB, Margules CR, Botkin DB. 2000. Indicators of biodiversity for ecologically sustainable forest management. Conserv Biol. 14(4):941–950. doi:10.1046/j.1523-1739.2000.98533.x.
- Lohbeck M, Poorter L, Paz H, Pla L, van Breugel M, Martínez-Ramos M, Bongers F. 2012. Functional diversity changes during tropical forest succession. Persp Plant Ecol Evol Syst. 14(2):89–96. doi:10.1016/j.ppees.2011.10.002.
- Lutz JA, Furniss TJ, Johnson DJ, Davies SJ, Allen D, Alonso A, Anderson-Teixeira KJ, Andrade A, Baltzer J, Becker KML, et al. 2018. Global importance of large-diameter trees. Global Ecol Biogeogr. 27(7):849–864. doi:10.1111/geb.12747
- Lutz JA, Larson AJ, Freund JA, Swanson ME, Bible KJ. 2013. The importance of large-diameter trees of forest structural heterogeneity. PLoS ONE. 8(12):e82784. doi:10.1371/journal.pone.0082784.
- Lutz JA, van Wagtendonk JW, Franklin JF. 2009. Twentieth-century decline of large-diameter trees in Yosemite National Park, California, USA. For Ecol Manag. 257(11):2296–2307. doi:10.1016/j.foreco.2009.03.009.
- Mac Nally R, Fleishman E. 2004. A successful predictive model of species richness based on indicator species. Conserv Biol. 18(3):646–654. doi:10.1111/j.1523-1739.2004.00328_18_3.x.
- Martin TA, Brown KJ, Kucera J, Meinzer FC, Sprugel DG, Hinckley TM. 2001. Control of transpiration in a 220-year-old Abies amabilis forest. For Ecol Manag. 152(1–3):211–224. doi:10.1016/S0378-1127(00)00604-6.
- Meakem V, Tepley AJ, Gonzalez-Akre EB, Herrmann V, Muller-Landau HC, Wright SJ, Hubbell SP, Condit R, Anderson-Teixeira KJ. 2018. Role of tree size in moist tropical forest carbon cycling and water deficit responses. New Phytol. 219(3):947–958. doi:10.1111/nph.14633.
- Ministry of the Environment. 2019. [Natural environment and biodiversity]. [accessed 2019 Apr 15]. https://www.env.go.jp/nature/kisho/hozen/redlist/index.html. Japanese.
- Miura M, Yamamoto S. 2003. Structure and dynamics of a Castanopsis cuspidata var. sieboldii population in an old-growth, evergreen, broad-leaved forest: the importance of sprout regeneration. Ecol Res. 18:115–129. doi:10.1046/j.1440-1703.2003.00540.x.
- Mölder A, Bernhardt-Römermann M, Schmidt W. 2008. Herb-layer diversity in deciduous forests: raised by tree richness or beaten by beech? For Ecol Manag. 256(3):272–281. doi:10.1016/j.foreco.2008.04.012.
- Molino JF, Sabatier D. 2001. Tree diversity in tropical rain forests: a validation of the intermediate disturbance hypothesis. Science. 294(5547):1702–1704. doi:10.1126/science.1060284.
- Molleman F, Kop A, Brakefield PM, Zwaan BJ. 2006. Vertical and temporal patterns of biodiversity of fruit-feeding butterflies in a tropical forest in Uganda. Biodivers Conserv. 15(1):107–121. doi:10.1007/s10531-004-3955-y.
- Montreal Process Working Group. 2015. Criteria and Indicators for the Conservation and Sustainable Management of Temperate and Boreal Forests, fifth edition (September 2015). http://www.montrealprocess.org/.
- Motokawa M. 2000. Biogeography of living mammals in the Ryukyu Islands. Tropics. 10(1):63–71. doi:10.3759/tropics.10.63.
- Mueller-Dombois D, Fosberg FR. 1998. Vegetation of the tropical Pacific islands. New York: Springer; p. 733.
- Nakama Y. 2007. A historical study on the forest management and utilization in northern part of mainland of Okinawa. Sci Bull Fac Agri Univ Ryukyus. 54:41–46.
- Nakamura K, Suwa R, Denda T, Yokota M. 2009. Geohistorical and current environmental influences on floristic differentiation in the Ryukyu Archipelago, Japan. J Biogeogr. 36(5):919–928. doi:10.1111/j.1365-2699.2008.02057.x.
- Nakao K, Higa M, Tsuyama I, Lin CT, Sun ST, Lin JR, Chiou CR, Chen TY, Matsui T, Tanaka N. 2014. Changes in the potential habitats of 10 dominant evergreen broad-leaved tree species in the Taiwan-Japan archipelago. Plant Ecol. 215(6):639–650. doi:10.1007/s11258-014-0329-8.
- Nakasuga T. 1995. [Historical changes of forestry in Okinawa Islands]. Nara: Hirugi-sha. Japanese.
- Nanami S, Kawaguchi H, Tateno R, Li C, Katagiri S. 2004. Sprouting traits and population structure of co-occurring Castanopsis species in an evergreen broad-leaved forest in southern China. Ecol Res. 19:341–348. doi:10.1111/j.1440-1703.2004.00643.x.
- Nepstad DC, Crane M, Carvalho CR, Davidson EA, Jipp PH, Lefebvre PA, Negreiros GH, Da Silva ED, Stone JE, Trumbore SE, et al. 1994. The role of deep roots in the hydrological and carbon cycles of Amazonian forests and pastures. Nature. 372(6507):666–669. doi:10.1038/372666a0
- Noss RF. 1999. Assessing and monitoring forest biodiversity: A suggested framework and indicators. For Ecol Manag. 115(2–3):135–146. doi:10.1016/S0378-1127(98)00394-6.
- Paillet Y, Archaux F, Du Puy S, Bouget C, Boulanger V, Debaive N, Gilg O, Gosselin F, Guilbert E, Firn J. 2018. The indicator side of three microhabitats: A multi-taxon approach based on bats, birds and saproxylic beetles. J Appl Ecol. 55(5):2147–2159. doi:10.1111/1365-2664.13181.
- Paillet Y, Bergés L, Hjältén J, Ódor P, Avon C, Bernhardt-Römermann M, Bijlsma RJ, de Bruyn L, Fuhr M, Grandin U, et al. 2010. Biodiversity differences between managed and unmanaged forests: meta-analysis of species richness in Europe. Conserv Biol. 24:101–112. doi:10.1111/j.1523-1739.2009.01399.x.
- Poorter L, Wright SJ, Paz H, Ackerly DD, Condit R, Ibarra-Manríquez G, Harms KE, Licona JC, Martínez-Ramos M, Mazer SJ, et al. 2008. Are functional traits good predictors of demographic rates? Evidence from five neotropical forests. Ecology. 89(7):1908–1920. doi:10.1890/07-0207.1
- R Core Team. 2015. R: A language and environment for statistical computing. Vienna:R Foundation for Statistical Computing.
- Rambo T, North M. 2009. Canopy microclimate response to pattern and density of thinning in a Sierra Nevada forest. For Ecol Manag. 257(2):435–442. doi:10.1016/j.foreco.2008.09.029.
- Remm J, Lõhmus A. 2011. Tree cavities in forests – the broad distribution pattern of a keystone structure for biodiversity. For Ecol Manag. 262(4):579–585. doi:10.1016/j.foreco.2011.04.028.
- Rey Benayas JM, Newton AC, Diaz A, Bullock JM. 2009. Enhancement of biodiversity and ecosystem services by ecological restoration: a meta-analysis. Science. 325(5944):1121–1124. doi:10.1126/science.1172460.
- Rodrigues ASL, Andelman SJ, Bakarr MI, Boitani L, Brooks TM, Cowling RM, Fishpool LCD, da Fonseca GAB, Gaston KJ, Hoffmann M, et al. 2004. Effectiveness of the global protected area network in representing species diversity. Nature. 428(6983):640–643. doi:10.1038/nature02422
- Saito K. 2011. [Forest age distribution in Kunigami-village, Okinawa, based on forest register data]. Pap Env Inform Sci. 25:245–250. Japanese.
- Sato T, Tanouchi H, Takeshita K. 1994. Initial regenerative processes of Distylium racemosum and Persea thunbergii in an evergreen broad-leaved forest. J Plant Res. 107(3):331–337. doi:10.1007/BF02344261.
- Siddig AAH, Ellison AM, Ochs A, Villar-Leeman C, Lau MK. 2016. How do ecologists select and use indicator species to monitor ecological change? Insights from 14 years of publication in Ecological Indicators. Ecol Ind. 60:223–230. doi:10.1016/j.ecolind.2015.06.036.
- Siqueira T, Bini LM, Roque FO, Cottenie K. 2012. A metacommunity framework for enhancing the effectiveness of biological monitoring strategies. PLoS ONE. 7(8):e43626. doi:10.1371/journal.pone.0043626.
- Sloan S, Jenkins CN, Joppa LN, Gaveau DLA, Laurance WF. 2014. Remaining natural vegetation in the global biodiversity hotspots. Biol Conserv. 177:12–24. doi:10.1016/j.biocon.2014.05.027.
- Suding KN. 2011. Toward an era of restoration in ecology: successes, failures, and opportunities ahead. Ann Rev Ecol Evol Syst. 42(1):465–487. doi:10.1146/annurev-ecolsys-102710-145115.
- Suganuma MS, Durigan G. 2015. Indicators of restoration success in riparian tropical forests using multiple reference ecosystems. Restoration Ecology. 23(3):238–251. doi:10.1111/rec.12168.
- Takashima A, Inafuku S. 2017. [Current stand dynamics of 65- to 70-year-old secondary forest in the Yambaru area of Okinawa Island]. Kyushu J For Res. 70:1–4. Japanese.
- Takashima A, Takahashi G, Oshima J, Saito K. 2010. [Growth pattern of Distylium racemosum in the Yanbaru area of Okinawa Island]. Kyushu J For Res. 63:50–52. Japanese.
- Takyu M. 1998. Shoot growth and tree architecture of saplings of the major canopy dominants in a warm-temperate rainforest. Ecol Res. 13(1):55–64. doi:10.1046/j.1440-1703.1998.00246.x.
- Tanouchi H, Yamamoto S. 1995. Structure and regeneration of canopy species in an old-growth evergreen broad-leaved forest in Aya district, southwestern Japan. Vegetatio. 117(1):51–60. doi:10.1007/BF00033258.
- Tapia-Armijos MF, Homeier J, Espinosa CI, Leuschner C, de la Cruz M. 2015. Deforestation and forest fragmentation in South Ecuador since the 1970s–losing a hotspot of biodiversity. PLoS ONE. 10(9):e0133701. doi:10.1371/journal.pone.0133701.
- Vačkář D, Ten Brink B, Loh J, Baillie JEM, Reyers B. 2012. Review of multispecies indices for monitoring human impacts on biodiversity. Ecol Ind. 17:58–67. doi:10.1016/j.ecolind.2011.04.024.
- Verissimo D, MacMillan DC, Smith RJ. 2011. Toward a systematic approach for identifying conservation flagships. Conserv Lett. 4(1):1–8. doi:10.1111/j.1755-263X.2010.00151.x.
- Wilfahrt PA, Collins B, White PS. 2014. Shifts in functional traits among tree communities across succession in eastern deciduous forests. For Ecol Manag. 324:179–185. doi:10.1016/j.foreco.2014.01.018.
- Wirth C. 2009. Old-growth forests: function, fate and value – a synthesis. In: Wirth C, Gleixner G, Heimann M, editors. Old-growth forests: function, fate and value. New York: Springer; p. 465–491.
- Wolters V, Bengtsson J, Zaitsev AS. 2006. Relationship among the specie richness of different taxa. Ecology. 87:1886–1895.
- Wortley L, Hero JM, Howes M. 2013. Evaluating ecological restoration success: a review of the literature. Rest Ecol. 21(5):537–543. doi:10.1111/rec.12028.
- Wu L, Shinzato T, Chen C, Aramoto M. 2008. Sprouting characteristics of a subtropical evergreen broad-leaved forest following clearcutting in Okinawa, Japan. New For. 36(3):239–246. doi:10.1007/s11056-008-9096-5.
- Yamamoto S. 1994. Gap regeneration in primary evergreen broad-leaved forests with or without a major canopy tree, Distylium racemosum, southwestern Japan: A comparative analysis. Ecol Res. 9:295–302. doi:10.1007/BF02348415.
- Yonekura K, Murata J. 2012. [An enumeration of the vascular plants of Japan: a list of the Latin and Japanese names of the vascular plants indigenous and naturalized in Japan arranged in the order of phylogeny-based system]. Tokyo: Hokuryukan Co., Ltd. Japanese.