
 ?Mathematical formulae have been encoded as MathML and are displayed in this HTML version using MathJax in order to improve their display. Uncheck the box to turn MathJax off. This feature requires Javascript. Click on a formula to zoom.
ABSTRACT
Miombo woodlands constitute the most extensive type of forest cover within South and East Africa, Tanzania in particular, and they are seriously threatened by intensive degradation and deforestation. The dynamics of miombo stands were examined in this study using a simple simulation system applied to experimental stands at the Kitulangalo Forest Reserve (KFR) in Tanzania. Prediction of tree-level diameter increment, mortality, and ingrowth across species groups with empirical models based on data from experimental sites constituted the essential elements of the simulation system. Diameter distribution, stand basal area, volume yield, and above-ground biomass accumulation were assessed in three harvesting alternatives across three species groups. The results indicate a high degree of positive response to careful selective harvesting in lightly degraded, recovering miombo forests. Simulation systems compiled from experimentally based models seem promising as tools for research on stand dynamics and sustainable management alternatives in miombo woodlands.
Introduction
Miombo woodland is the most extensive tropical seasonal woodland and dry forest formation in Africa, which is dominated by the legume family (Fabaceae, subfamily Caesalpinioideae)Frost (Citation1996). Miombo woodlands cover about 270 million ha, extending from Central, Eastern, to Southern African regions (Campbell et al. Citation2007). Miombo woodlands are a crucial source of a wide range of ecosystems, and environmental services for over 75 million people in the rural settings of Africa, and about 25 million people in urban and suburban areas in the region (Syampungani Citation2009). The climatic condition of Miombo woodlands is arid and semi-arid, with highly leached soils with poor nutrients where tree growth is relatively slower compared to forests in wetter areas (Backéus et al. Citation2006; Malmer Citation2007). Another general distinguishing characteristic of miombo vegetation is the co-dominance of ecosystems of continuous herbaceous cover and sedges (Osborne et al. Citation2018) marking evident seasonal variations that are related to water stress (Malmer Citation2007). Unlike the wetter miombo woodlands in the Angolan, Southern miombo, and Zambezian ecoregions receiving over 1000 mm of annual precipitation, the Tanzanian miombo woodlands fall in drier areas receiving less than 1000 mm of rain annually. The Tanzanian miombo occupies about 92% of the forested land, forming the main vegetation type in the country (Mauya et al. Citation2015; Ene et al. Citation2017). Generally, the floristic composition and structural variability are so enormous across the landscape (Godlee et al. Citation2020); with higher species diversity and dimensions in the southern, and northern highlands and the western wet plateaus (Malmer Citation2007). The central plateaus are dominated by a mosaic of miombo species and other numerous woodland species such as Combretum, Acacia, and Commiphora species (Rajala et al. Citation2022).
The capacity of the Tanzanian miombo woodlands to provide various ecosystem services is diminishing rapidly due to the escalating anthropogenic activities (Gordon and Enfors Citation2008) driven by agriculture, illegal logging, wood extraction for poles, bioenergy (charcoal and firewood), unsustainable livestock grazing, and uncontrolled annual fires (Ribeiro et al. Citation2015a; Doggart et al. Citation2020). Although forest disturbances that involve opening up the canopy through selective harvesting have been shown to activate regeneration, Chidumayo (Citation1987), Piiroinen et al. (Citation2008) urged that regeneration in miombo woodlands may not be fast and abundant enough to cover the losses when anthropogenic disturbances grow beyond the threshold levels, thus making sustainability nearly impossible. The limited and fragmented information on regeneration, tree growth and the overall stand dynamics in miombo woodlands as a result of habitat modifications by human disturbances and climate change constrains the process of sustainable management of these woodlands, and thus the ecosystem services for the well-being of the local communities. The need for whole-stand simulation systems that can predict the stand development under different management and disturbance regimes is therefore essential for resource assessment planning, and management of miombo woodlands for improved growth, biodiversity values and ecosystem functioning. It is therefore, so essential to understanding the key ecological processes and how miombo woodlands, which is the largest Savannah type in sub-Saharan Africa (Campbell Citation1996; Frost Citation1996) respond to both local and global changes.
Unlike temperate and boreal forests, where tree growth and stand development have been extensively studied (Kellomäki et al. Citation1992; Bugmann Citation1996; Ruckstuhl et al. Citation2008), there has been a scarcity of simulation and matrix models for tropical forests and woodlands (Fearnside Citation2004; Meir et al. Citation2015; Stanturf and Mansourian Citation2020). One of the possible reasons is its immense and complex floristic composition and structural variability (Wright Citation2002; Draper et al. Citation2020). However, in recent years, there has been a growing concern about the modelling and simulation of tropical forests and woodlands (Bonal et al. Citation2016). Currently, the allometric models for the estimation of stock variables for individual, dominant tree species in miombo woodlands are readily available (Mugasha et al. Citation2013, Citation2016; Hofstad and Araya Citation2015; Naesset et al. Citation2016; Manyanda et al. Citation2020), yet, the yield estimation and overall population dynamic models are much more uncertain (Hofstad and Araya Citation2015), constraining the forest planners and managers who would like to estimate allowable cuts or non-decreasing harvest levels in miombo woodlands. It is also problematic for the assessment of stand productivity, deforestation, and degradation applicable for REDD+ Projects, which has become essential for the analysis of climate change mitigation (Kapinga et al. Citation2018; Ribeiro et al. Citation2021)
Since the application of growth rings is somehow limited and also irregular in miombo tree species (Trouet et al. Citation2001; Grundy Citation2006; Syampungani et al. Citation2010), the only practical method for studying tree growth and population dynamics essential for growth modelling is through re-measurement of trees at Permanent Sampling Plots (PSPs). The exploratory analyses on tree growth patterns by Valkonen et al. (Citation2008) and Elifuraha et al. (Citation2008) using one-year growth data from Kitulangalo Forest Reserve (KFR) PSPs indicated that an empirical modelling approach for miombo conditions needs a medium to long-term growth period and the appropriate methods capable of accounting for the complex inherent and human-induced variability within the stands and dealing with the variation in characteristics, roles, and mutual interaction of individual trees and regeneration (Mbwambo et al. Citation2008).
The modern methods of combining distance-independent variables, mortality, area-based recruitment models and other allometric models have enabled the formulation of simulation models (Vanclay 1995) to simulate stand development (Bollandsås et al. Citation2008; Mugasha et al. Citation2017) and, the same time, predicting diameter growth (Mugasha et al. Citation2017). The need for long time monitoring of forest growth with an appropriate representation of climatic conditions, is, however, important for the development of reliable and meaningful simulation models for miombo woodlands.
The current study explores the dynamics of miombo stands using the nine-year interval (2007 to 2016) datasets from Kitulangalo study plots in Morogoro, Tanzania, as a study area. The overall objective was to develop a simple and biologically sound whole stand simulation system that would predict the stand dynamics for Kitulangalo miombo trees over a medium-term period of 99 years. The simulation system was modified from Bollandsås et al. (Citation2008) and Yahya et al. (Citation2012); by integrating a diameter increment model (Njoghomi et al. Citation2021), and the density-dependent multiplicator into the system for addressing the following research questions.
Is it feasible to predict and explore the stand dynamics in miombo woodlands with a simulation system composed of basic models based on a relatively medium-term monitoring period on experimental plots at KFR?
Are the miombo stands developing towards recovery from past exploitation in the medium term without human disturbances?
How would harvesting affect stand dynamics and development as compared to no disturbance? Does such harvesting seem silviculturally feasible? What kind of differences would emerge in wood yields and above-ground biomass carbon stores between the treatment alternatives?
What are the implications of harvesting alternatives for research and forest management?
Material and methods
Experimental setting
The study was based on data from Permanent Sample Plots (PSPs) at Kitulangalo Forest Reserve (KFR) in Morogoro, Tanzania. KFR represents the typical lowland dry miombo woodland in Eastern Tanzania. KFR is currently considered as regenerating forest from the past abuse of various disturbances (Malimbwi et al. Citation2000; Karenget JA-s Citation2009) which happened before Participatory Forest Management reforms (Lund and Nielsen Citation2005; Blomley Citation2006). The high level of accessibility to the highway made this area a prime charcoal production area for the supply of the nearby Morogoro municipality and Dar es Salaam city (Malimbwi et al. Citation2000). The KFR suffered from timber extraction through the activities of local pit-sawyers, and from cutting of tree stems for building poles (Zahabu Citation2006) because of insufficient human resources of the Forest Department to maintain control over the area and to prevent the over use of forest resources. This was a typical de facto open access resource (Mbilinyi et al. Citation2007; Skutsch and Solis Citation2011). The empirical basis of this study (experimental setting and setup, stand structure and dynamics including species composition, tree size distribution, tree growth, mortality, and recruitment) is described comprehensively and only a few key features are revisited here () (Njoghomi et al. Citation2021, Citation2021).
Figure 1. The study area map: The Kitulangalo Forest Reserve in the Morogoro Region, Tanzania.
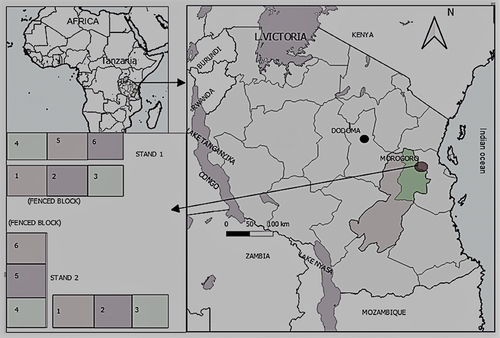
Two sets of experimental plots had been established in two subjectively selected stands (approximately 500 m apart) to get a proper representation of the miombo woodlands in KFR. Each stand had two blocks with a total of six adjoining PSPs measuring 30 × 30 m. The first measurement was carried out in 2007 and the final measurement in 2016, making nine (9) years intervals. Measurements involved diameter at breast height (Dbh at 1.3 m from the ground), species name, height (for sample trees), and coordinates (x, y) for each tree. Randomization of treatments using nested plots, blocks and stands to study tree growth, mortality and ingrowth (Njoghomi et al. Citation2021) aimed to reduce bias in estimating mortality in the plots. Because of the scarcity of empirical data and on long-term studies in the Tanzanian miombo woodlands, the use of the small plots (30 × 30 m) was objectively intended to test the applicability of the design in miombo conditions for research purposes.
Data preparation
All trees with a minimum diameter at breast height (Dbh) of 5 cm were measured for the diameter. A tree forking above the Dbh point (1.3 m from the ground level) was considered a single tree; otherwise, all stems from a multiple-stemmed tree were treated individually. The observed tree increment (id9) was calculated as the difference between two measurements with an interval of 9 years. Trees that were present and alive in both measurements were included only. The diameter of the trees for all measured trees was categorized into 11 diameter classes, with class size (w) of 5 cm as follows from <5–9.9 cm, 10–14.9 cm, 15–19.9 cm, 20–24.9 cm, 25–29.9 cm, 30–34.9 cm, 35–49.9 cm, 50–54.9 cm, 55–59.9 cm, 60–64.9 cm & 65–69.9 cm. The designation of species grouping followed that of Njoghomi, et al. (Citation2021) where we assigned all tree species to three groups: 1) trees that grow relatively rapidly to be dominants in top canopy layers such as Julbernardia globiflora, Brachystegia boehmii, and Sclerocaria birrea; 2) trees that stay mainly in the lower and middle canopy levels dominated by Combretum species; and 3) trees that grow slowly but persistently and may eventually rise to dominant and codominant canopy positions such as Senegalia nigrescens (syn. Acacia nigrescens) and Vachelia robusta (syn. Acacia robusta). Species group 1 had 170 observations, while groups 2 and 3 had 157 and 81 observations, respectively. The observed number of trees per species group was used for the calculations of different primary variables which were later converted into per ha basis. Individual tree volume was calculated using Mauya et al. (Citation2014) (1a), while above-ground biomass (AGB), and associated carbon were calculated using a height-free allometric model by Mugasha et al. (Citation2013) (1b and 1c)
‘Where = ,
and
are the individual tree volume, above-ground biomass and carbon, respectively, for a tree in species group i, diameter class j at period t. and
stem diameter for species group i, diameter class j at period t.
Overview of the simulation system
A simulation system is a common paradigm for analysing complex processes by creating a simplified representation of the system under study (Altiok and Melamed Citation2010). Simulations require the use of matrix models. In practical forestry, these systems are built to provide managers with predictions of forest growth and yield response to treatments (Yahya et al. Citation2012). We developed a simulation system to predict stand dynamics as a response to management treatments (harvesting intensities) across three species groups and size classes that are assumed to exhibit similar growth. The developed simulation system is based on a stand-level Dbh distribution matrix model that reflects every single effect of management option (harvesting intensity) that were theoretically applied in the system. A three-level diameter growth model was developed for estimating growth rates in the stand-level matrix model whereby trees with high growth rates upgrow into a higher Dbh class, the slow-growing trees live and stay in the same diameter class, or a tree dies (mortality), a tree is harvested or retained at the beginning of the period, or a tree emerges into the smallest Dbh class during the respective period as a recruit according to Markov chain rule (Acevedo et al. Citation1995). The density-dependent matrix model (2), therefore, predicts the number of trees per hectare by diameter classes for each species group as influenced by the treatment alternatives. The matrix is highly sensitive to the number of recruits (vector R) added to the smallest diameter class (Dbh 5–10 cm) and the number of trees dying in each diameter class in all species groups.
(Bollandsås et al. Citation2008)
where = is the state vector, in which each entry is the number of live trees per ha for species group i and diameter class j at time t, G is a transition matrix with a submatrix for each species group,
is the harvesting vector in which each entry is the number of trees harvested, and p is the projection interval whereas R is the in-growth (recruitment) vector showing the number of recruits for tree species i entering the lowest diameter class during time t+p.
Other parameters such as stand basal area, volume, above-ground biomass and carbon were simultaneously estimated using the projected number of stems for each harvesting alternative across each species group.
In addition, the systems applied three harvesting alternatives, 1) “No harvesting” whereby trees develop and die with no disturbance, 2) “Uniform intensity” whereby all stems with DBH ≥40.0 cm for all species groups were harvested and finally, 3) “Varying intensity” whereby all stems with DBH ≥24 cm (species group 2) and Dbh ≥40 cm (group 1 and 3) were harvested, respectively. Note that, the simulation system applied a harvesting cycle of 36 years (with four, 9-year time intervals) implemented at the 36th and 72nd years under the assumption that potentially harvestable timber volume is calculated only from trees already above the legal minimum harvestable diameter at breast height (Dbh). For example, a prescribed legal minimum harvestable diameter for Julbernardia globiflora is 40 cm, and 45 cm for other dominant tree species such as Brachystegia and Pterocarpus species. However, for other species in the middle and lower canopy levels such as Dalbergia melanoxylon, a prescribed minimum harvestable diameter is 24 cm (Lovett Citation2003). Although the individual trees in species group 2 are limited in diameter growth and rarely exceed a Dbh of 30 cm, yet they have been harvested even at smaller diameters because of their wide range of uses.
Similarly, illegal timber and pole harvesting are usually targeted at minimum tree sizes and species which are of economic importance, which does not practically differ from what is legally harvested.
Stand-level Dbh distribution matrix model
A matrix model framework modified from Bollandsås et al. (Citation2008) and (Yahya et al. Citation2012) was applied for the simulation (3): The basic stand table was composed of the number of live trees in each dbh class (5 cm class width) by species groups.
is the number of alive trees of species i, Dbh class j at time t, n is the number of Dbh classes, and p is the projection interval (9 years).
is a number of harvested trees of species i, Dbh class j at time t.
is a proportion of trees staying the same Dbh class of species i, Dbh class j at time t.
is a proportion of trees upgrowing to higher Dbh class of species i, Dbh class j at time t.
is a number of recruitment trees of species i at time t.
Elements of the Dbh matrix model
The proportions for tree movement into upper diameter classes varied with individual species growth rate, stand basal area and density, mortality, the recruitment and harvesting alternatives. The percentage of trees in species group i that live and stay in the same diameter class j from period t to t+p was denoted by The predicted number of stems upgrowing to higher diameter classes (
and the mortality rates (
were used to calculate the proportion of trees staying in the same diameter class, expressed as
where
is a mortality rate (proportion of the number of stems) in species group i and Dbh class j at the final measurement.
The likelihood that a tree grows from diameter class j to j + 1 between time t and t +9 years at a given harvesting alternative and species group i was estimated as;
Where
= the number of stems for species group i upgrowing to higher diameter classes
The diameter growth model predicted individual increments for species group i and dbh class j in each harvesting alternative after every 9 years. The levels of the diameter increment curves were, however, regulated by the stand basal area in each species group as shown by the coefficient in the model (3). Generally, the anticipated higher basal area values from “no harvesting” and “uniform harvesting” were expected to reduce diameter increments irrespective of species’ groups and diameter class when compared to the “varying alternative”.
Mortality and recruitment sub-models
Different candidate models to predict the probability of tree mortality to happen for species groups 1, 2 and 3 were developed and tested. Unlike mortality and growth models, we tried the formulation and testing of the two-step, area-based recruitment models in which we first predicted the probability of recruitment to happen (in plots with recruits) and then predict the conditional number of recruits using our plot data.
However, because of the insufficient number of observations for both mortality and recruitment, models were discarded because they did not perform. Therefore, since it was not feasible to develop mortality and recruitment models, we applied a simple linear multiplicator developed from the probabilities observed in the data (in each Dbh class across species groups) to make mortality data density-dependent. The mortality rate, therefore, involved the proportion of all dead stems (at the final measurement) to the initial total number of livingstems as shown in .
Table 1. The observed number of stem mortality and their probability rates.
The density-dependent mortality rate was therefore estimated using the equation form:
= the number of dead stems for species group i and diameter class j during the final census,
= initial total number of living stems for species group i and diameter class j at the end of the study
proportion of the predicted stand basal area at time t to the stand basal area at time t = 0
A similar, linear multiplicator was used to convert the observed number of recruits into a density-dependent recruitment. The number of recruits was therefore estimated as the observed newly emerged stems into the smallest diameter class (Dbh = 5–10 cm) for each species group i at the start of the experiment conditioned by predicted stand basal area at time t (7). The recruitment vector (), therefore, consisted of one sub-vector for each species group with the number of recruits (in-growth) of a specific species i that entered the smallest diameter class from time t to t+p:
the number of observed recruit trees of species i at the final census.
The tree-level diameter growth model
This study used a tree-level, nonlinear mixed effect diameter growth model to predict a 9-year diameter increment between 2007 and 2016. The model was adjusted from that of Njoghomi et al. (Citation2021) who used a similar dataset with a measurement interval of 8 years (2008 to 2016). It was worth using the 9-year interval because the 2007 dataset had baseline information for other parameters such as mortality and recruitment which were crucial for simulation purposes.
The change in diameter growth was considered as a response variable while initial stem diameter, species groups and the density-independent stand basal area were considered explanatory variables (fixed effects of the model). The experimental hierarchy (plots/stands) provided random effects of the model. Upgrowth movement of diameters was therefore predicted with diameter increment models (8) constructed with our measurement data with a 9-year interval. An aggregated version of the model (Njoghomi et al. Citation2021) (8) was developed and applied, where the distance-dependent local basal area was replaced with a distance-independent stand basal area (G). The main point was to eliminate a possible substantial source of bias in the recursive calculation framework where a small systematic error may lead to a large prediction error after several simulation steps.
The diameter growth model was:
Where.
= 9-year diameter increment of tree k in species group i and diameter class j,
= initial stem diameter of a tree in species group i and diameter class j,
SP = species groups
= Stand basal area
Coefficient for the factor of species groups with three levels (three species
groups) entered through a sub-model .
= Other coefficients for intercept, initial stems diameter, and plot basal area (the fixed variables)
= random effect of a tree in plot i and diameter class j
= random residual for a tree in plot i and diameter class j
Results
The tree-level diameter growth model
Except for the model intercept, all other model parameters were found to be significant (p < 0.05). The model explained the sources of variation in diameter increment by 38% (R2 = 0.38) (). Residual and density plots (Supplementary 2), however, showed a normal distribution, which indicated the accuracy and reliability of the model in predicting the diameter increments across species groups and diameter classes as influenced by harvesting alternatives. The lower SD values of the model showed that most of the diameter increments values were very close to the mean. The negative model coefficientsindicated that the diameter increment was negatively correlated to the initial diameter of the stems for all species groups (Groups 1, 2 & 3).
Table 2. Parameters for diameter increment model (p < 0.05).
In addition, the increase in plot basal area (, however, decreased with the diameter increments. The coefficient
adjusted the variation in growth levels between species groups. The higher coefficient value (
for species group indicated higher growth potentials for species group 1 than other species groups with lower values of coefficient
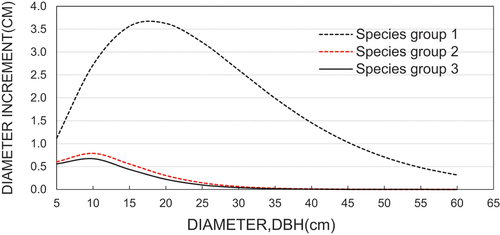
. The model output demonstrated in indicates a single line of prediction for each species group for the initial plot basal area. A detailed model output with multiple prediction lines (t + 0 to t + 99) (Supplementary 1) showed how stand developed through basal area growth, which was a prime factor to regulate diameter increment and hence stand development. The top line in each curve represented a diameter growth under lower stand basal, while the lowest curves, species group and harvesting alternative, however, represented diameter increment and higher stand basal area values.
Figure 2. Diameter increment curves by three species groups.
Diameter distribution and species proportion
A great majority (92%) of the initial density was concentrated in the lower diameter classes (Dbh 5–25 cm) at the beginning and the end of the 99 years in all treatment alternatives. Species group 1 dominated the stands across all harvesting alternatives by >45% of the number of stems (N/ha) throughout. The number of stems for the middle and lower canopy (species group 2) decreased in the “no harvesting” alternative compared to all other harvesting alternatives (). The top canopy species (group 1) contributed over 47% of all ingrowths during the simulation, while species groups 2 and 3 contributed about 33% and 18%, respectively. The proportion of trees upgrowing initially increased and then decreased with greater Dbh. The highest proportion of up-growing trees was in species group 1. The highest proportion of stems growing into higher classes was attained in the “varying intensity” harvesting alternatives under species group 1 between Dbh class 20–25 cm, but at around 40–45 cm in the other alternatives as indicated in supplementary materials.
Figure 3. The number of stem densities across species groups and harvesting options.
The “no harvesting” alternative resulted in an overall lowest number of stems in Dbh class 5–25 cm but a relatively higher number of bigger diameter stems in species group 1 compared to other groups. There was a relatively small drop in the number of stems for smaller stems (Dbh 5–25 cm) for all species groups but an increased number of harvestable stems (Dbh ≥25–50 cm) for species group 1 for both “Varying” and “Uniform intensity” harvesting alternatives. Species groups 2 and 3, on the other hand, showed a relatively small increase in the number of stems with Dbh 20–30 cm for both “Varying” and “Uniform intensity” harvesting alternatives during the simulation process. Generally, species group 1 had a higher basal area proportion (%) compared to other species groups at the end of the study ().
Figure 4. The change in the number of stems across species groups.
Stand-level growth trajectory
In the “no harvesting” alternative, the stand basal area increased from 8.9 m2ha−1 to 18.7 m2ha−1, where it tended to level off. In the “uniform intensity” and “varying harvesting intensity” the basal area increased less, to 13.8 m2 ha−1 and 13.9 m2ha−1, respectively (). The two harvesting alternatives had a sharper rise in basal area recovery following the first harvesting cycle compared to the second cycle.
Figure 5. Basal area growth across species groups.
The observed initial stand volume was 87.5 m3ha−1. At the end of the simulation period; the “no harvesting” alternative had the highest stand volume of 175 m3ha−1 with a net growth of 83 m3ha−1 and annual growth of 0.8 m3ha−1yr−1. The “uniform intensity” and “varying intensity”, however, attained a relatively similar stand volume of 130 m3 ha−1 and 134 m3 ha−1 with a net growth of 9.7 and 5.5 m3ha−1yr−1 which included the harvested volume. The total harvested volume for “uniform intensity” was 33 m3ha−1 and that for “varying intensity was 41 m3ha−1. In all harvesting alternatives, the stand volume was dominated by species group 1 with a proportion of 71–73%.
The initial above-ground biomass carbon (AGB) for the stand was 24.1tC ha−1. The tree harvest and mortality resulted in the loss of AGB carbon. Nevertheless, the “No harvesting” alternative had the highest net AGB carbon, valuing 42.6tC as compared to the “intensity (39.6tC) and “Uniform intensity” (33.2tC), respectively, at the end of the simulation period (). On the other hand, the stand basal area growth was assumed to have a direct linear relationship with in-growth (from saplings into trees with Dbh ≥5 cm) and mortality ().
Figure 6. Relationship between stand basal area growth and mortality.
In the “no harvesting” alternative, the stand basal area increased from 8.9 m2ha−1 to 18.7 m2ha−1, tending to level off. In the “uniform intensity” and “varying intensity”, however, the basal area increased less, to 13.8 m2 ha−1 and 13.9 m2ha−1, respectively. There was a sharper rise in basal area recovery following the first harvesting cycle compared to the second cycle in the two harvesting alternatives.
Discussion
Reliability of the growth model
The formulated diameter growth model was the basis for the development of the simulation system for Kitulangalo miombo stands. Formulating an individual species growth model could be necessary to facilitate diameter growth modelling and thus simulation system; however, the vast nature of miombo species necessitated the species grouping system using canopy structure and growth characteristics of miombo species (Njoghomi et al. Citation2021), which, however, seemed to improve the model fit. Several other models, such as for Julbernnadia globiflora, and Combretum molle were formulated during the process but were dropped due to unexpected biological behaviour resulting from interactions among the independent variables. Because the aim was to get a relatively simple model with robust diameter growth to facilitate stand growth simulation, the selected, simple model with Dbh and basal area (G) which introduced competition seemed statistically fit. The applied harvesting alternatives across the species groups also regulated the stand density, and basal area, which consequently controlled stand growth. Harvesting a few bigger size tree species (for groups 1 and 2) had a higher impact on the stand basal area, and thus stand growth. Generally, the model performed well statistically. Despite low regression coefficient of the model, its alignment to the biological behaviours of miombo growth accredited the selected model. We considered this feature as one of the strengths of the developed model which depicted the actual patterns of miombo growth and development (Mugasha et al. Citation2017). On the other hand, the limited number of observed mortality and recruits limited the formulation of mortality and recruitment sub-models, which could have disavailed our simulation matrix system. We consider these as crucial areas to improve simulation studies on stand growth and management in miombo woodlands in the future. In addition, we considered the observed steady-state conditions and quick stabilization in stand growth and development some years after second harvesting, as the effect of improved growth when the competition is reduced. This phenomenon is also parallel to the effect of the application of the density-dependent in-growth, and mortality. Similar to the findings of Valkonen et al. (Citation2008), Mbwambo et al. (Citation2008), and (Njoghomi et al. Citation2021), suggesting that the stand mortality rate must be lower than the recruitment rate for the sustainability of the miombo woodlands. For research purposes, our experiment did not involve fire (as it was excluded in the setting of the experiment); however, frequent annual fires would reduce the fuel load on the forest floor, consequently affecting regeneration, and thus recruitment.
The increment model was, however, applied only to the data it was constructed with which had a small range (5–60 cm). We, therefore, do not know how it will behave in other miombo with a wide range of diameters and other climatic conditions.
Stand dynamics without management
Without harvesting, the growth model parameter ( continued to predict higher diameter increments, particularly to individuals in the top canopy species group (group 1). This increased diameter growth results in increased basal area growth for this group, ultimately inducing strong growth competition against the middle and lower canopy species. Further, the resulting basal area growth from species group 1, therefore, accelerates tree mortality for other species groups, while suppressing an overall stand ingrowth (Szwagrzyk and Szewczyk Citation2001). The dominance of species group 1 will therefore increase, thus compromising the future species composition, stand structure and diversity (Mangora Citation2005; Kalaba et al. Citation2012). Sustaining stands at basal area threshold levels shown by (Njoghomi et al. Citation2021) are appropriate for sustainable growth and the perpetual supply of ecosystem services and biodiversity functions in miombo woodlands. The “No harvesting” alternative implicitly explains the complete enclosed management system in miombo woodlands which is more common in many state-owned miombo forests in Tanzania, where harvesting is restricted (Luoga et al. Citation2005; Kajembe et al. Citation2015). This simulation result is important for discussion on sustainable management of miombo woodlands, thus threatening the future stand structure and composition.
Stand dynamics with management
Generally, harvesting trees create canopy gaps that essentially reduce growth competition among stand trees; thus, higher diameter increments (predicted by the model parameter , more ingrowth, and therefore, more stems up-growing into higher diameter classes for species group 1 (Acevedo et al. Citation1995; Valkonen et al. Citation2008). This phenomenon was demonstrated by harvesting treatments with wood removals from the large diameter classes. This was followed by higher diameter increments from the remaining stand trees, and thus, quick recovery in basal area, volume and other parameters’ growth for species group 1(the top canopy trees) after every cutting cycle. In addition, the created canopy gaps through harvesting promoted higher number of small stems recruited into the smallest diameter class (5–10 cm), thus adding to the overall stand basal area growth. Similar findings were reported by Muvengwi et al. (Citation2020) in Zimbabwe and Syampungani (Citation2009) in Zambia whereby extraction of fuel wood induced higher recruitments, and thus, overall stand growth. This situation, however, confirmed a general notion of a reversed J-shaped diameter distribution demonstrated across all species groups, throughout the simulation period in the treatment alternatives (Isango et al. Citation2007; Zheng and Zhou Citation2010). We consider the two harvesting options as examples of treatments to think of for sustainable forest development in Miombo woodlands. The extent of wood removal in the two harvesting alternatives and the resulting stand basal area recovery at KFR demonstrated the capacity of miombo woodlands to immediately recover from the slight to medium disturbances (Ribeiro et al. Citation2015b; Gonçalves et al. Citation2017) under sustainable management. The sustainability of the stand structure, especially the two-dimensional diameter distribution-species composition matrix will have to be involved in the consideration.
Suggestions on stand management from aspects of stand-level growth
Greater estimates of stand basal area, volume, above-ground biomass (AGB) and carbon under the “no harvesting” alternative point toward the presence of bigger diameter trees which were subject to harvesting under other alternatives. While the “no harvesting” management option promotes the accumulation of the AGB and carbon storage in large trees (Bertsch-Hoermann et al. Citation2021; Mikolas et al. Citation2021), the simulation results through harvesting treatments diminished AGB storage through harvesting and mortality, but subsequently increased carbon sequestration because of the increased growth rate and the resulted number of ingrowths (Malimbwi et al. Citation1994; Mbwambo et al. Citation2008; Lyimo and Shaaban Citation2015; Njoghomi et al. Citation2021). The Government of Tanzania, conservationists and the communities are currently in dilemma whether to store AGB carbon in our forests and woodlands (which benefits biodiversity conservation, ecosystem functioning and less economic gains) or, to embark on selective timber harvesting (demonstrated in this study) resulting into enhanced growth, carbon sequestration and timber trades as a response towards the global climate change mitigation initiatives and the needs to conserve of biological diversity. Management options that can balance the AGB storage and carbon sequestration dynamics (Mikolas et al. Citation2021) are a new area of research that will enhance sustainable forest management, increase community benefits and climate change mitigations through the implementation of future REDD+ programs and other forest landscape restoration initiatives in the country such as AFR100 and the Paris Challenge 2016.
Future research works
At the initial steps of simulation, the model would give rather unbiased increment estimates by default, as more recurrent steps were added on, deviations from the initial conditions could have emerged in background factors, especially related to standing density in the unmanaged alternatives and the species composition within the aggregate species groups. It was, however, impossible to gather sufficient observations for modelling all the species (61 in this data) in such complex woodlands in the context of limited results and time. It would not be justifiable to conclude very much from the results on the ecological and social sustainability of the management of miombo woodlands. Stand density, diameter distribution, and species composition are just the first step in that direction. For instance, the tree species have different ecological niches (Menon et al. Citation2010; Baldeck et al. Citation2013), regeneration, survival, and competition strategies (Vieira and Scariot Citation2006), and a multitude of timber and nontimber uses (Chirwa et al. Citation2008).
To guarantee the sustainability of miombo stands constitutes a hugely complex undertaking requiring major steps in research and the accumulation of knowledge (Valkonen et al. Citation2008). Further, longer observation periods on extended networks of permanent experimental plots and the involvement of other potential parameters such as fire, animal disturbance, and the influence of changing climates in miombo woodlands are crucial for a better understanding of stand dynamics and the resulting carbon sequestration dynamics in the structure and composition of miombo woodlands for sustainable planning and management and perpetual supply of ecosystem services the community.
Conclusions
The study showed that it is possible to build relevant simulation systems for typical miombo forests composed of rather basic empirical models based on datasets gained from relatively short observation periods on sample plots. The development of such a research approach and infrastructure for miombo is still at the very beginning, along with the research infrastructure as a whole. However, the results point towards a high degree of positive response to careful selection harvesting in lightly degraded, recovering miombo woodlands. The role of Kitulangalo Forest Reserve as a prime example of such a semi-intact forest and a key research platform is confirmed.
Supplemental Material
Download MS Word (680.7 KB)Acknowledgements
I acknowledge partial financial support from Luke’s INFORES-Tanzania project, funded by the Ministry of Foreign Affairs of Finland.
Disclosure statement
No potential conflict of interest was reported by the author(s).
Supplementary material
Supplemental data for this article can be accessed online at https://doi.org/10.1080/13416979.2023.2239136
References
- Acevedo MF, Urban D, Ablan M. 1995. Transition and gap models of forest dynamics. Ecol Appl. 5(4):1040–1055. doi: 10.2307/2269353.
- Altiok T, Melamed B. 2010. Simulation modeling and analysis with Arena. San Diego, CA: Elsevier.
- Backéus I, Pettersson B, Strömquist L, Ruffo C. 2006. Tree communities and structural dynamics in miombo (Brachystegia–Julbernardia) woodland, Tanzania. For Ecol Manag. 230(1–3):171–178. doi: 10.1016/j.foreco.2006.04.033.
- Baldeck CA, Kembel SW, Harms KE, Yavitt JB, John R, Turner BL, Chuyong GB, Kenfack D, Thomas DW, Madawala S, et al. 2013. A taxonomic comparison of local habitat niches of tropical trees. Oecologia. 173(4):1491–1498. doi:10.1007/s00442-013-2709-5.
- Bertsch-Hoermann B, Egger C, Gaube V, Gingrich S. 2021. Agroforestry trade-offs between biomass provision and aboveground carbon sequestration in the alpine Eisenwurzen region, Austria. Reg Environ Change. 21(3):77. doi: 10.1007/s10113-021-01794-y.
- Blomley T. 2006. Mainstreaming participatory forestry within the local government reform process in Tanzania. Endsleigh, London: International Institute for Environment and Development.
- Bollandsås O, Buongiorno J, Gobakken T. 2008. Predicting the growth of stands of trees of mixed species and size: a matrix model for Norway. Scand J For Res. 23(2):167–178. doi: 10.1080/02827580801995315.
- Bonal D, Burban B, Stahl C, Wagner F, Hérault B. 2016. The response of tropical rainforests to drought—lessons from recent research and future prospects. Ann For Sci. 73(1):27–44. doi: 10.1007/s13595-015-0522-5.
- Bugmann H. 1996. Functional types of trees in temperate and boreal forests: classification and testing. J Veg Sci. 7(3):359–370. doi: 10.2307/3236279.
- Campbell BM. 1996. The Miombo in transition: woodlands and welfare in Africa. Cifor. doi: 10.17528/cifor/000465.
- Campbell B, Angelsen A, Cunningham A, Katerere Y, Sitoe A, Wunder S. 2007. Miombo woodlands–opportunities and barriers to sustainable forest management. Bogor, Indonesia: Center for International Forestry Research.
- Chidumayo E. 1987. Species structure in Zambian miombo woodland. Trop Ecol. 3(2):109–118. doi: 10.1017/S0266467400001838.
- Chirwa PW, Syampungani S, Geldenhuys CJ. 2008. The ecology and management of the Miombo woodlands for sustainable livelihoods in southern Africa: the case for non-timber forest products. South For: A J Forest Sci. 70(3):237–245. doi: 10.2989/SF.2008.70.3.7.668.
- Doggart N, Morgan-Brown T, Lyimo E, Mbilinyi B, Meshack CK, Sallu SM, Spracklen DV. 2020. Agriculture is the main driver of deforestation in Tanzania. Environ Res Lett. 15(3):034028. doi: 10.1088/1748-9326/ab6b35.
- Draper FC, Baker TR, Baraloto C, Chave J, Costa F, Martin RE, Pennington RT, Vicentini A, Asner GP. 2020. Quantifying tropical plant diversity requires an integrated technological approach. Trends Ecol Evol. 35(12):1100–1109. doi: 10.1016/j.tree.2020.08.003.
- Elifuraha E, Nöjd P, Mbwambo L. 2008. Short term growth of miombo tree species at Kitulangalo. Work Pap Finn For Res Inst. 98:37–45.
- Ene LT, Næsset E, Gobakken T, Bollandsås OM, Mauya EW, Zahabu E. 2017. Large-scale estimation of change in aboveground biomass in miombo woodlands using airborne laser scanning and national forest inventory data. Remote Sens Environ. 188:106–117. doi:10.1016/j.rse.2016.10.046.
- Fearnside PM. 2004. Are climate change impacts already affecting tropical forest biomass? Glob Environ Change. 14(4):299–302. doi: 10.1016/j.gloenvcha.2004.02.001.
- Frost P. 1996. The ecology of miombo woodlands. The miombo in transition: Woodlands and welfare in Africa. CIFOR. 266:11–55.
- Godlee JL, Gonçalves FM, Tchamba JJ, Chisingui AV, Muledi JI, Shutcha MN, Ryan CM, Brade TK, Dexter KG. 2020. Diversity and structure of an arid woodland in southwest Angola, with comparison to the wider miombo ecoregion. Diversity. 12(4):140. doi: 10.3390/d12040140.
- Gonçalves FM, Revermann R, Gomes AL, Aidar MP, Finckh M, Juergens N. 2017. Tree species diversity and composition of Miombo woodlands in South-Central Angola: a chronosequence of forest recovery after shifting cultivation. Int J For Res. 2017:1–13. 13pp. doi: 10.1155/2017/6202093.
- Gordon LJ, Enfors EI. 2008. Land degradation, ecosystem services, and resilience of smallholder farmers in Makanya catchment, Tanzania. Conserving Land. Protecting Water. 6:33.
- Grundy I. 2006. Age determination of Miombo species Brachystegia spiciformis (Leguminosae-Caesalpinoideae) in Zimbabwe using growth rings. South Afr For J. 2006(206):5–12. doi: 10.2989/10295920609505238.
- Hofstad O, Araya MM. 2015. Optimal wood harvest in miombo woodland considering REDD+ payments—a case study at Kitulangalo forest reserve, Tanzania. For Policy Econ. 51:9–16. doi:10.1016/j.forpol.2014.11.002.
- Isango J, Varmola M, Valkonen S, Tapaninen S 2007. Stand structure and tree species composition of Tanzania Miombo woodlands: a case study from Miombo woodlands of community based forest management in Iringa district. 1st MITMiombo Project Workshop, Morogoro, Tanzania.
- Kajembe GC, Silayo DSA, Vatn A. 2015. The adaptation of REDD+ initiatives in forest management regimes in two pilot projects of Kondoa and Kilosa districts. Tanzania: Norwegian University of Life Sciences (NMBU).
- Kalaba FK, Quinn CH, Dougill AJ. 2012. Contribution of forest provisioning ecosystem services to rural livelihoods in Copperbelt’s Miombo woodlands, Zambia. Popul Environ. 41:1–40.
- Kapinga K, Syampungani S, Kasubika R, Yambayamba AM, Shamaoma H. 2018. Species-specific allometric models for estimation of the above-ground carbon stock in miombo woodlands of Copperbelt Province of Zambia. For Ecol Manag. 417:184–196. doi:10.1016/j.foreco.2018.02.044.
- Karenget JA-s. 2009. Analysis of forest degradation in Miombo Woodlands using remote sensing and GIS: case study of Kitulangalo Forest in Morogoro. Tanzania: University of Twente.
- Kellomäki S, Väisänen H, Hänninen H, Kolström T, Lauhanen R, Mattila U, Pajari B. 1992. A simulation model for the succession of the boreal forest ecosystem. Helda, Helsinki: University of Helsinki.
- Lovett JC. 2003. The forest act, 2002 (Tanzania). J Afr Law. 47(1):133–135. doi: 10.1017/S0221855303002050.
- Lund JF, Nielsen ØJ. 2005. The promises of Participatory forest management in forest conservation and poverty alleviation: the case of Tanzania. L’Afrique Orientale Annuaire. 201–241.
- Luoga E, Witkowski E, Balkwill K. 2005. Land cover and use changes in relation to the institutional framework and tenure of land and resources in eastern Tanzania miombo woodlands. Environ Dev Sustain. 7(1):71–93. doi: 10.1007/s10668-003-4013-8.
- Lyimo P, Shaaban S. 2015. Assessment of Forest condition at SUA-Kitulangalo forest reserve in Tanzania Miombo Woodland. German: GRIN.
- Malimbwi R, Solberg B, Luoga E. 1994. Estimation of biomass and volume in miombo woodland at Kitulangalo forest reserve, Tanzania. J Trop ForSci. 7:230–242.
- Malimbwi R, Zahabu E, Kajembe G, Luoga E. 2000. Contribution of charcoal extraction to deforestation: experience from CHAPOSA Research Project. The Sokoine University of Agriculture. https://www.suaire.sua.ac.tz/handle/123456789/1229
- Malmer A 2007.General ecological features of miombo woodlands and considerations for utilization and management. MITMIOMBO–management of indigenous tree species for ecosystem restoration and wood production in semi-arid miombo woodlands in Eastern Africa. Proceedings of the First MITMIOMBO Project Workshop held in Morogoro, Tanzania.
- Mangora MM. 2005. Ecological impact of tobacco farming in miombo woodlands of Urambo District, Tanzania. Afr J Ecol. 43(4):385–391. doi: 10.1111/j.1365-2028.2005.00603.x.
- Manyanda BJ, Nzunda EF, Mugasha WA, Malimbwi RE. 2020. Estimates of volume and carbon stock removals in Miombo woodlands of mainland Tanzania. J For Res. 2020:1–10. doi:10.1155/2020/4043965.
- Mauya EW, Ene LT, Bollandsås OM, Gobakken T, Næsset E, Malimbwi RE, Zahabu E. 2015. Modelling aboveground forest biomass using airborne laser scanner data in the miombo woodlands of Tanzania. Carbon Balance Manag. 10(1):1–16. doi: 10.1186/s13021-015-0037-2.
- Mauya EW, Mugasha WA, Zahabu E, Bollandsås OM, Eid T. 2014. Models for estimation of tree volume in the miombo woodlands of Tanzania. South For: A J Forest Sci. 76(4):209–219. doi: 10.2989/20702620.2014.957594.
- Mbilinyi BP, Misana S, Malimbwi R, Monela G, Jambiya G. 2007. Land cover dynamics as a result of charcoal production: Use of remote sensing and GIS. Tanzania J For Nat Conserv. 76(1):67–79.
- Mbwambo L, Valkonen S, Kuutti V. 2008. Structure and dynamics of miombo woodland stands at Kitulangalo Forest Reserve, Tanzania. Work Pap Finn For Res Inst. 98:10–19.
- Meir P, Wood TE, Galbraith DR, Brando PM, Da Costa AC, Rowland L, Ferreira LV. 2015. Threshold responses to soil moisture deficit by trees and soil in tropical rain forests: insights from field experiments. BioScience. 65(9):882–892. doi: 10.1093/biosci/biv107.
- Menon S, Choudhury BI, Khan ML, Townsend Peterson A. 2010. Ecological niche modeling and local knowledge predict new populations of Gymnocladus assamicus a critically endangered tree species. Endanger Species Res. 11:175–181. doi:10.3354/esr00275.
- Mikolas M, Svitok M, Bace R, Meigs GW, Keeton WS, Keith H, Buechling A, Trotsiuk V, Kozak D, Bollmann K, et al. 2021. Natural disturbance impacts on trade-offs and co-benefits of forest biodiversity and carbon. Proc Biol Sci. 288(1961):20211631. doi:10.1098/rspb.2021.1631.
- Mugasha WA, Bollandsås OM, Gobakken T, Zahabu E, Katani JZ, Eid T. 2017. Decision-support tool for management of miombo woodlands: a matrix model approach. South For: A J Forest Sci. 79(1):65–77. doi: 10.2989/20702620.2016.1233776.
- Mugasha WA, Eid T, Bollandsås OM, Malimbwi RE, Chamshama SAO, Zahabu E, Katani JZ. 2013. Allometric models for prediction of above- and belowground biomass of trees in the miombo woodlands of Tanzania. For Ecol Manag. 310:87–101. doi:10.1016/j.foreco.2013.08.003.
- Mugasha WA, Eid T, Bollandsås OM, Mbwambo L. 2017. Modelling diameter growth, mortality and recruitment of trees in miombo woodlands of Tanzania. South For: A J Forest Sci. 79(1):51–64. doi: 10.2989/20702620.2016.1233755.
- Mugasha WA, Mwakalukwa EE, Luoga E, Malimbwi RE, Zahabu E, Silayo DS, Sola G, Crete P, Henry M, Kashindye A. 2016. Allometric models for estimating tree volume and aboveground biomass in lowland forests of Tanzania. J For Res. 2016:1–13. doi:10.1155/2016/8076271.
- Muvengwi J, Chisango T, Mpakairi K, Mbiba M, Witkowski E. 2020. Structure, composition and regeneration of miombo woodlands within harvested and unharvested areas. For Ecol Manage. 458:117792. doi:10.1016/j.foreco.2019.117792.
- Naesset E, Ørka HO, Solberg S, Bollandsås OM, Hansen EH, Mauya E, Zahabu E, Malimbwi R, Chamuya N, Olsson H. 2016. Mapping and estimating forest area and aboveground biomass in miombo woodlands in Tanzania using data from airborne laser scanning, TanDEM-X, RapidEye, and global forest maps: A comparison of estimated precision. Remote Sens Environ. 175:282–300. doi:10.1016/j.rse.2016.01.006.
- Njoghomi EE, Valkonen S, Karlsson K. 2021. Analysing species site-specific tree growth, mortality and in-growth for miombo woodlands in Tanzania. South For: A J Forest Sci. 83(1):43–55. doi: 10.2989/20702620.2020.1814113.
- Njoghomi EE, Valkonen S, Karlsson K, Saarinen M, Mugasha WA, Niemistö P, Balama C, Malimbwi RE. 2021. Regeneration dynamics and structural changes in Miombo woodland stands at Kitulangalo forest reserve in Tanzania. J Sustain For. 40(6):539–557. doi: 10.1080/10549811.2020.1789478.
- Osborne CP, Charles‐Dominique T, Stevens N, Bond WJ, Midgley G, Lehmann CE. 2018. Human impacts in African savannas are mediated by plant functional traits. New Phytol. 220(1):10–24. doi: 10.1111/nph.15236.
- Piiroinen T, Roininen H, Valkonen S. 2008. Regeneration of miombo woodlands: effects of herbivory, management and competition. Work Pap Finn For Res Inst. 98:46–51.
- Rajala T, Heikkinen J, Gogo S, Ahimbisibwe J, Bakanga G, Chamuya N, Garcia Perez J, Kilawe E, Kiluvia S, Morales D. 2022. NAFORMA: National Forest Resources Monitoring and Assessment of Tanzania Mainland: sampling Design Options for 2nd Biophysical Inventory (NAFORMA II). Rome: Food & Agriculture Org.
- Ribeiro NS, Armstrong AH, Fischer R, Kim Y-S, Shugart HH, Ribeiro-Barros AI, Chauque A, Tear T, Washington-Allen R, Bandeira RR. 2021. Prediction of forest parameters and carbon accounting under different fire regimes in Miombo woodlands, Niassa Special Reserve, Northern Mozambique. Policy Econ. 133:102625. doi:10.1016/j.forpol.2021.102625.
- Ribeiro NS, Syampungani S, Matakala NM, Nangoma D, Ribeiro-Barros AI. 2015a. Miombo woodlands research towards the sustainable use of ecosystem services in Southern Africa. Biodiversity In Ecosyst Link Structure Fun. 17:475–491.
- Ribeiro NS, Syampungani S, Matakala NM, Nangoma D, Ribeiro-Barros AI. 2015b. Miombo woodlands research towards the sustainable use of ecosystem services in Southern Africa. Biodiversity In Ecosyst Link Structure Fun. 475–491. doi: 10.5772/59288.
- Ruckstuhl K, Johnson E, Miyanishi K. 2008. Introduction. The boreal forest and global change. Phil Trans R Soc B. 363(1501):2243–2247. doi: 10.1098/rstb.2007.2196.
- Skutsch M, Solis S. 2011. How much carbon does community forest management save. Commun Forest Monitor Carbon Market. 15.
- Stanturf JA, Mansourian S. 2020. Forest landscape restoration: state of play. R Soc Open Sci. 7(12):201218. doi: 10.1098/rsos.201218.
- Syampungani S. 2009. Vegetation change analysis and ecological recovery of the Copperbelt Miombo woodland of Zambia. Stellenbosch: University of Stellenbosch.
- Syampungani S, Geldenhuys CJ, Chirwa PW. 2010. Age and growth rate determination using growth rings of selected miombo woodland species in charcoal and, slash and burn regrowth stands in Zambia. J Ecol Nat Environ. 2(8):167–174.
- Szwagrzyk J, Szewczyk J. 2001. Tree mortality and effects of release from competition in an old‐growth Fagus‐Abies‐Picea stand. J Veg Sci. 12(5):621–626. doi: 10.2307/3236901.
- Trouet V, Haneca K, Coppin P, Beeckman H. 2001. Tree ring analysis of Brachystegia spiciformis and Isoberlinia tomentosa: evaluation of the enso-signal in the miombo woodland of eastern Africa. Iawa J. 22(4):385–399. doi: 10.1163/22941932-90000384.
- Valkonen S, Elifuraha E, Kiluma L. 2008. Application of modeling to study tree diameter growth in miombo woodland stands at Kitulangalo forest reserve, Tanzania. Research and development for sustainable management of semiarid miombo woodlands in East Africa. Work Pap Finn For Res Inst. 98:20–27.
- Vieira DL, Scariot A. 2006. Principles of natural regeneration of tropical dry forests for restoration. Restor Ecol. 14(1):11–20. doi: 10.1111/j.1526-100X.2006.00100.x.
- Wright JS. 2002. Plant diversity in tropical forests: a review of mechanisms of species coexistence. Oecologia. 130(1):1–14. doi: 10.1007/s004420100809.
- Yahya Y, Ismail R, Vanna S, Saret K. 2012. Forest growth simulation: tropical rain forest stand table projection. Int J Math Comput Sci. 6(5):606–611.
- Zahabu E. 2006. Case study Kitulangalo forest area, Tanzania. Can carbon income combat forest degradation? Community forest management for climate mitigation and poverty alleviation. Technology and Sustainable Development. 19:19–24.
- Zheng L-F, Zhou X-N. 2010. Diameter distribution of trees in natural stands managed on polycyclic cutting system. For Stud China. 12(1):21–25. doi: 10.1007/s11632-010-0009-2.