Abstract
The 32R rice genotype is resistant to sheath blight disease (ShB), with a high-yield potential. We examined effects of temperature on the plant responses of 32R in comparison with those of the ShB-susceptible rice genotype (29S) and Nipponbare (Nb, a Japonica standard cultivar). The seedlings at the 4th leaf stage of rice genotypes were exposed to 14/14, 19/14, 25/20, 31/26, 37/32 and 37/37 °C (day/night) for 5, 10 and 15 days. The dry weight, leaf area, photosynthesis, contents of ribulose 1,5-bisphosphate carboxylase/oxygenase (Rubisco) and chlorophyll contents were examined. The dry weight showed lower in 32R than in 29S and Nb at a low temperature, and total dry weight correlated strongly with root dry weight and leaf area. The relative growth rate (RGR) correlated strongly with the net assimilation rate (NAR). Rubisco, chlorophyll contents and the photosynthetic rates were limited at a low temperature and showed lower in 32R than in 29S and Nb. The strong correlations between Rubisco and the rates of maximum photosynthesis and initial slope were found in 32R, but not found in 29S and Nb. In addition, RGR and NAR of 32R correlated positively with Rubisco. These suggest that 32R contains traits of cold-sensitive genotypes that are related to limiting Rubisco at a low temperature, thus diminishing photosynthesis and limiting plant growth. Differences of growth among 32R, 29S and Nb were discussed in the relation of genotypes.
Rice sheath blight disease (ShB) caused by Rhizoctonia solani Kuhn is one of the most serious fungal diseases reducing rice yield. A rice yield loss as large as 50% may occur when plants are infected with R. solani (Lee & Rush, Citation1983). Many studies on the resistant mechanism of this disease have been conducted. Our previous studies indicated that the activity and gene expression of various key enzymes in the glycolytic, pentose phosphate and phenylpropanoid pathways increased after R. solani infection in the ShB-resistant rice genotype (32R) compared to the ShB-susceptible rice genotype (29S) (Mutuku & Nose, Citation2010, Citation2012). ShB-resistant genes are scattered in various chromosomes: 1, 4, 5 and 7 (Gaihre & Nose, Citation2011). Although many attempts to understand the mechanisms of ShB-resistance in rice have been studied, the evidences remain controversy.
Climate change is a major factor that alters plant performance (Nagai & Makino, Citation2009). The relative growth rate (RGR) is a consequence of variations in a wide variety of parameters related to physiology, morphology and chemical composition (Quero et al., Citation2008). Studies reported that net assimilation rate (NAR) plays a more important role in determining the variation in RGR (Loveys et al., Citation2002; Nagai & Makino, Citation2009), meanwhile Villar et al. (Citation2005) reported that the leaf area ratio (LAR) plays a more important role in determining the variation in RGR under contrasting temperatures. On the other hand, climate change also causes the limitations of photosynthesis via the activities of Rubisco and/or ribulose bisphosphate (RuBP) regeneration (Sage & Kubien, Citation2007). At low temperatures, the prominent limitation of photosynthesis is the regeneration of RuBP. At high temperatures, the limitation of photosynthesis is assuming: (i) heat instability of Rubisco activase and (ii) depression of the chloroplast electron transport rate, ETR (Yamori et al., Citation2013). Thus, effects of climate change, especially contrasting temperatures, on the rates of growth and photosynthesis of plant remain dispute.
The 32R and 29S were developed from the same parents, Tetep (Indica ShB resistance) and CN4-4-2 (Japonica ShB sensitivity) and continuously screened for ShB resistance for over 20 years (Wasano et al., Citation1985). The CN4-4-2 was developed from Chugoku 45 and Nipponbare (Nb). Many aspects of 32R, such as metabolic pathways analysis (Mutuku & Nose, Citation2012), proteomics analysis (Miyagi et al., Citation2006) and QTL analysis (Gaihre & Nose, Citation2011), have been conducted. Although the yield of 32R (7.9 MT/ha) is lower than that of Nb (9.6 MT/ha) and 29S (8.8 MT/ha), the yield of the F1 generation (by crossing 32R and Nb, 12.5 MT/ha) is greater than the parents (Gaihre & Nose, Citation2013). In addition, Kobayashi et al. (Citation2006) reported that the epidemic of the ShB would expand in rice grown under elevated CO2 concentrations in the Northern Japan, thus the increased risks of ShB to rice plants are necessary to consider in the forecasting the effects of climate change on rice yield. The 32R is ShB-resistant and high yield potential, but the observations identified that the seedlings growth of 32R during cold season showed lower than those of 29S. Therefore, a new rice variety with ShB resistance, high yield and cold resistance is expected to overcome the above conditions, in which the 32R is a useful candidate for developing a new variety for temperate areas under climate change.
This study aimed to examine the rates of growth and photosynthesis of 32R under contrasting temperatures, which provides evidences for breeding a new cultivar with high yield and ShB resistance using QTL pyramiding. Seedlings at the 4th leaf stage were exposed to 14/14, 19/14, 25/20, 31/26, 37/32 and 37/37 °C (day/night) for 5, 10 and 15 days. We addressed the questions: (i) what is the difference between the ShB-resistant and susceptible rice genotypes in terms of their responses to the rates of growth and photosynthetic? (ii) Are there any relationships between the temperature responses of individual leaf and whole-plants?
Materials and methods
Experimental design
The seeds of 32R, 29S and Nb as described by Mutuku and Nose (Citation2010) were sterilized with a 0.1% solution of the insecticide Sumichion (Yashima Chemicals Industry Co., Ltd., Japan) and a 0.5% solution of the bactericide Tekurido C (Kumiai Chemicals Industry Co., Ltd., Japan) for one day and then soaked in the tap water for two days at 25/20 °C. Twelve seeds were sown in a plastic pot (20 cm × 26 cm × 10 cm) filled with a 1:1 ratio of peat moss to vermiculite. The pots were placed in growth chambers (KG-50 HLA, Koito Industries Co., Ltd., Japan) with a 14-h photoperiod and watered sufficiently to maintain wet but not saturated soil until the completion of germination. The seedlings were then supplied with water daily, which was maintained at a height of 10 mm from the soil surface. The chamber temperature was maintained at 25/20 °C with a relative humidity of 70% and photosynthetically active photon flux density (PPFD) of 400 to 420 μmol m−2 s−1 at plant level. After the initial 14 days of growth, the plants were fertilized weekly with a half-strength concentration of the basal nutrient solution (Makino et al., Citation1988) with slight modifications. All of the seedlings at the 4th leaf stage were placed at a day/night temperature of 14/14, 19/14, 25/20, 31/26, 37/32 and 37/37 °C for 5, 10 and 15 days post-exposure (dpe), and the other conditions during temperature treatment were similar to pre-temperature treatment. All experiments were done with three replications.
Growth analysis
The 4th harvests were conducted during the experiment. The first harvest was pre-treated. The following harvests were conducted sequentially at the interval of 5 days, at which time the seedlings had been exposed for 5, 10 and 15 days at contrasting growth temperatures. Four harvests were used to determine for the three growth periods.
For each harvest, six seedlings per genotype per treatment were selected at random. During the harvest, the soil was completely removed from the roots. The leaves, stems and roots were then separated. The leaves were scanned with a scanner (Canon MP640, Canon Inc., Tokyo, Japan), and determining leaf area by LIA32 software (http://hp.vector.co.jp/authors/VA008416/index-e.html). Leaves, stems and roots were oven-dried at 80 °C for at least 48 h, and recorded their dry weight.
RGR, NAR and LAR were determined separately for each genotype according to Nagai and Makino (Citation2009). We calculated the mean of the three growth periods for each genotype to compare effects of contrasting growth temperatures.
Photosynthesis measurements
The rates of photosynthesis were determined in the fully expanded, youngest leaf of seedlings at 5, 10 and 15 dpe by using a portable gas exchange system (Li-6,400, Li-Cor, USA), and measured based on the responses of irradiation, leaf temperature and CO2 concentration. For the responses of irradiation, the light intensity of PPFD on the leaf surface was controlled in six steps in descending order from 800 to 0 μmol m−2 s−1. During measurement, leaf temperature was controlled at 30 °C, vapor pressure deficit between the leaf and air (VpdL) was maintained at 1.7 ± 0.3 μmol m−2 s−1 and the CO2 reference was maintained in ambient air (370 μmol mol−1). To evaluate the responses of leaf temperature, the leaf temperature was changed in increasing order from 15 to 35 °C with an interval of 5 °C. During measurement, the CO2 reference, irradiation and VpdL were maintained at 370 μmol mol−1, 400 μmol m−2 s−1 and 1.7 ± 0.3 μmol m−2 s−1, respectively. To evaluate the responses of CO2 concentration, CO2 concentration was controlled in six steps in descending order from 800 to 0 μmol mol−1. During measurement, irradiation, leaf temperature and VpdL were maintained at 1000 μmol m−2 s−1 and 30 °C and at 1.7 ± 0.3 μmol m−2 s−1, respectively. All of the measurements were initiated at 9:00 and completed at noon. After photosynthetic measurements were completed, the leaf samples were immediately immersed in liquid nitrogen and then stored at −80 °C until use.
Chlorophyll and Rubisco content measurements
Frozen leaves (0.2 g) were ground with a chilled mortar and pestle with 0.2 g quartz sand and 2 mL of extraction buffer described by Kanbe et al. (Citation2009) with a slight modification. The buffer contained 50 mM Tris-HCl (pH 7.9), 10 mM MgCl2, 0.5 mM ethylenediaminetetraacetatic acid (EDTA)-NaOH, 5 mM dithiothreitol, 0.2% (w/v) polyvinylpolypyrrolindone and 0.1% (w/v) Triton X-100. The homogenate was filtered by one layer of Miracloth (Calbiochem Novabiochem, USA). An aliquot (0.2 mL) of the homogenate was mixed with 0.8 mL of acetone to determinate the chlorophyll content as described by Arnon (Citation1949). The remaining homogenate was centrifuged at 16,000 × g for 20 min at 4 °C. The supernatant was moved to another tube on ice, and the pellet was re-extracted with 0.2 mL of extraction buffer. The supernatants were mixed and determined the soluble protein content using BSA as a standard (Bradford, Citation1976). Soluble proteins (5 μg) were separated by SDS-PAGE in a 12% (w/v) gel containing 0.1% (w/v) final concentration of SDS, and the gels were then stained with Coomassie brilliant blue R250. The Rubisco contents of the samples were determined using purified spinash Rubisco (Sigma Co., Ltd., USA) as a standard. The protein-band intensity of the large subunit of Rubisco was measured using ImageJ software (http://rsbweb.nih.gov/ij/).
Statistical analysis
Statistical analyses were performed using R package (http://www.r-project.org/). Prior to the statistical analysis, all of the data were normalization using square root- or log-transformed values. Data are presented as the mean ± SD. The Tukey HSD test was used to compare parameters among the three rice genotypes and contrasting temperatures. The correlations were also analyzed using the R package. Terms were considered significant level at p < 0.05.
Results and discussion
Effects of temperature on plant growth
Overall, total dry weight increased with a rising temperature in all genotypes (Figure ). Total dry weight at 14/14 °C showed the lowest in 32R and showed higher in 29S than in Nb, while total dry weight at 37/37 °C showed the lowest in Nb and showed higher in 29S than in 32R. Total dry weight at 19/14, 25/20, 31/26 and 37/32 °C showed the highest in 29S and showed higher in 32R than in Nb; however, in some cases, total dry weight of 32R and Nb was not different. Similarly, the root dry weight also increased with increasing temperature. The root dry weight at 14/14 °C regime showed the lowest in 32R and showed higher in 29S than in Nb, meanwhile root dry weight at higher temperature regimes showed higher in 29S than in both Nb and 32R and showed no difference between Nb and 32R. Root dry weight at 14/14 °C, particularly at 15 dpe, showed a decrease of 2.5 and 1.9 times in 32R compared to in 29S and Nb, respectively. In addition, leaf area also increased with a rising temperature (Figure ). The leaf area showed the highest in 29S and showed no difference between 32R and Nb at the six growth temperature regimes.
Figure 1. Effects of temperature on dry weight, leaf area and the contents of chlorophyll and Rubisco of 32R (●), 29S (○) and Nb (△). The values are the mean ± SD (n = 6 for dry weight and leaf area, n = 3 for Rubisco contents and n = 30 for chlorophyll contents). The absence of a bar indicates that the SD was within the size of the symbol. Different letters indicate significance at p < 0.05 by Tukey’s HSD test (where a is significant among 32R, Nb and 29S; b is significant between 32R and Nb; c is significant between 29S and Nb; and d is significant between 32R and 29S).
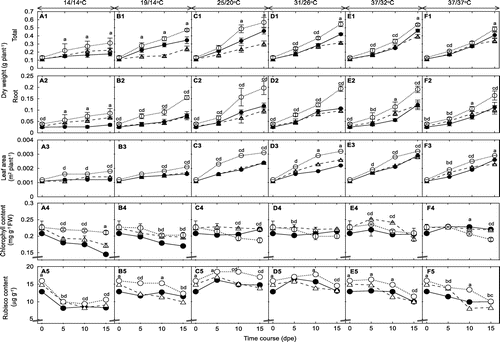
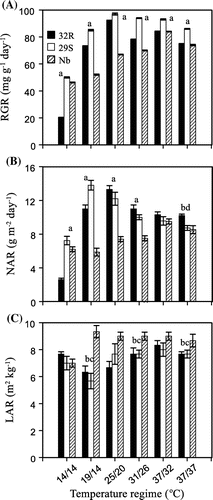
Figure shows the results of RGR, NAR and LAR of 32R, 29S and Nb under contrasting temperatures. RGR showed lower at 14/14 °C regime than at other conditions (Figure A). The 32R showed lower in RGR at 14/14 °C than 29S and Nb, while 32R showed also lower in RGR at 19/14, 25/20, 31/26, 37/32 and 37/37 °C than 29S but higher than Nb. RGR at 14/14 °C decreased by 2.5 and 2.3 times in 32R compared to in 29S and in Nb, respectively. NAR also showed lower at 14/14 °C regime than at others (Figure B). The 32R showed lower in NAR at 14/14 °C than 29S and Nb, while 32R also showed lower in NAR at 19/14 °C than 29S but higher than Nb. Both 32R and 29S showed higher in NAR at 25/20 and 31/26 °C than Nb. NAR at 37/32 and 37/37 °C were not different among genotypes. NAR at 14/14 °C decreased by 2.8 and 2.4 times in 32R compared to in 29S and in Nb, respectively (Figure B); however, there were not significant difference in LAR in different genotypes and different growth temperature regimes (Figure C).
Figure 2. Effects of temperature on the RGR, NAR, LAR of 32R, 29S and Nb. Data are the mean ± SD (n = 18). The absence of a bar indicates that the SD was within the size of the symbol. Different letters show significant differences at p < 0.05 (where a is significant among 32R, Nb and 29S; b is significant between 32R and Nb; c is significant between 29S and Nb; and d is significant between 32R and 29S).
Our study agreed with many studies that a low temperature causes a depression of the dry weight (Aghaee et al., Citation2011; Engels & Marschner, Citation1990; Nagai & Makino, Citation2009). In addition, our results also showing total dry weight of genotypes were different at a low temperature. These differences related to root dry weight and leaf area. The relationship analysis indicated that total dry weight correlated strongly with root dry weight (Figure B1) and leaf area (Figure B2). Roots and shoots are different sensitivity to abiotic stress, because they have different functions: shoots essentially have a photosynthetic function, whereas roots take up water and nutrients. Thus, shoots and roots may vie and collaborate for the functions that a plant requirement. A decrease in roots growth often precedes the decrease of shoots growth (Huang et al., Citation2012; Gargallo-Garriga et al., Citation2014). This is reason to explain why total dry weight related strongly with root dry weight rather than with dry weight of leaves and stems of genotypes (data not shown).
Figure 3. Correlation of parameters in the rate of growth and photosynthesis of 32R (●), 29S (○) and Nb (△). The rR, rS and rNb are r values for 32R, 29S and Nb, respectively. The symbols indicate the statistical significance at ***p < .001, **p < .01 and *p < .05.
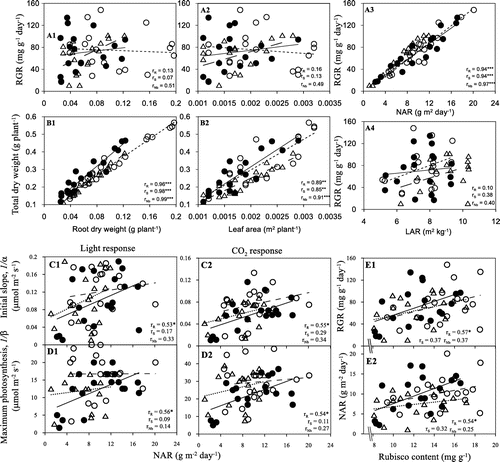
The growth rate (GR) was appreciably faster in cold-resistant genotypes than in cold-susceptible genotypes. According to our results, the 29S has both greater leaf area and more biomass compared with 32R and Nb. Poorter and Remkes (Citation1990) reported that fast-growing species allocated more carbon to leaves than slow-growing species and that higher LAR in fast-growing species allows plants to fix more carbon per unit plant weight, with a positive correlation between LAR and RGR. However, our results indicated that there were strong correlations between RGR and NAR (Figure 3A3) rather than LAR (Figure A4), root dry weight (Figure 3A1) and leaf area (Figure A2). Our results agreed with the findings of Loveys et al. (Citation2002) and Nagai and Makino (Citation2009) that the variations of NAR play an important role in differences in RGR. Furthermore, Nagai and Makino (Citation2009) indicated that although LAR was an important determinant for GR, no difference in the temperature responses of LAR was identified between rice and wheat. The explanation for the difference between species is different N-use efficiency for photosynthesis varying in growth temperatures. These suggest that differences in the temperature response of GR of genotypes are caused more by a difference in the temperature response of NAR. On the other hand, the optimal temperature for biomass production related to favorable temperature conditions of different genotypes. Our results indicated that the 32R showed the lowest total dry weight at a low temperature, while the Nb showed the lowest total dry weight at a high temperature. The Nb is a Japonica type and grows as a subtropical rice, thus the growth of Nb was limited at a high temperature. In contrast, growth of 32R was limited at a low-growth temperature. According to Aghaee et al. (Citation2011), the cold-susceptible rice genotypes showed more quickly decrease in dry weight than the cold-resistant rice genotypes at a low temperature. These suggest that the 32R may include the traits of cold-sensitive genotypes.
Effects of contrasting temperature on leaf constituents
Overall, chlorophyll contents were rapidly decreased at a low temperature (Figure ). Chlorophyll contents showed lower in 32R than in 29S and Nb at 14/14 and 19/14 °C regimes, but no difference at higher temperature regimes. Our results agreed with the findings of Aghaee et al. (Citation2011) and Ulqodry et al. (Citation2014) that the chlorophyll contents depressed in response to low temperatures. In addition, the depression of chlorophyll content in the 32R occurred rapidly in comparison with that in the 29S and Nb. These results suggest that the photosynthetic pigments in 32R were more susceptible to a low temperature than those in 29S and Nb.
The contents of Rubisco generally decreased at low and high temperatures (Figure ). Rubisco contents showed lower in 32R than in 29S, while showed no difference between 32R and Nb. Studies indicated that low and high temperatures cause the decrease of Rubisco contents in many crops such as rice, soybean and wheat (Makino & Sage, Citation2007; Sage et al., Citation2008; Vu et al., Citation2001; Yamasaki et al., Citation2002). In contrast, Nagai and Makino (Citation2009) reported that the Rubisco contents in both wheat and rice increased at low (19/16 for rice and 13/10 °C for wheat) and high (37/31 °C) temperatures. These results suggest that there were different temperature effects on the leaf, thus inducing differences in the biochemical process and the rates of photosynthesis in plants.
Effects of temperatures on photosynthetic rates
The photosynthetic rates of 32R, 29S and Nb were estimated by using the rectangular hyperbola model as described by Ulqodry et al. (Citation2014).(1)
where P (μmol m−2 s−1) is the photosynthetic rate of the individual leaf at a light intensity of I (μmol m−2 s−1) and both α and β are coefficients to determine the convexity of the hyperbola.
The initial slope (P′-Li = 1/α) and maximum photosynthesis (Pmax-Li = 1/β) of the photosynthetic light intensity response curves (P-Li) were estimated from (1). P′-Li based on absorbed light (quantum yield) describes the efficiency with which light is transformed into fixed carbon. P′-Li is determined at low light intensities when photosynthetic rate increases linearly with irradiance, with the light-driven electron transport rate (ETR)-limiting photosynthesis (Lambers et al., Citation2008). Pmax-Li is achieved when increases in light intensity at which photosynthesis is saturated (Kirk, Citation2011). P′-Li and Pmax-Li of 32R, 29S and Nb under contrasting temperatures were shown in Figure . The P′-Li and Pmax-Li of the rice genotypes were decreased at 14/14 °C regime compared to other regimes. Before temperature treatment, the 32R showed higher in P′-Li than 29S and Nb, while the 32R showed lower in Pmax-Li than 29S and Nb. After temperature treatment, especially at 14/14 and 19/14 °C, the 32R showed lower in P′-Li and Pmax-Li than 29S and Nb.
Figure 4. Effects of temperature on the rate of initial slope and maximum photosynthesis of 32R, 29S and Nb. The P′-Li (A1, A2 and A3) and Pmax-Li (B1, B2 and B3) shows the photosynthetic light responses at 5, 10 and 15 dpe, respectively. The P′-Ci (C1, C2 and C3) and Pmax-Ci (D1, D2 and D3) shows the photosynthetic CO2 responses at 5, 10 and 15 dpe, respectively. Ctrl is the pre- treatment.
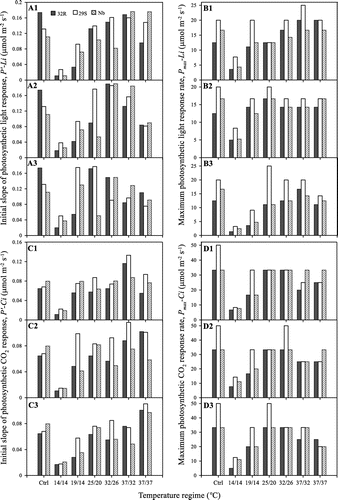
The initial slope (P′-Ci = 1/α) and maximum photosynthesis (Pmax-Ci = 1/β) of the photosynthetic CO2 concentration response curves (P-Ci) were also estimated from (1). P′-Ci at light saturation generally reflects Rubisco capacity (Sage et al., Citation2011). P′-Ci is determined at low CO2 concentration when photosynthetic rate increases linearly with the CO2 concentration, calling Rubisco limitation. Pmax-Ci achieved when increases in CO2 concentration at which photosynthesis is saturated and normally occurs when the CO2 concentration is high. Pmax-Ci is predicted assuming that the rate of regeneration of RuBP is limiting, calling RuBP-limitation (Sharkey et al., Citation2007). P′-Ci and Pmax-Ci of the 32R, 29S and Nb showed lower at 14/14 °C regime than at other regimes (Figure ). The 32R showed lower in P′-Ci than 29S at six regimes. 32R showed lower in P′-Ci than Nb at pre-temperature treatment, 14/14, 19/14, 25/20 and 31/26 °C, whereas showed higher in P′-Ci than Nb at 37/32 and 37/37 °C. In additions, 32R showed lower in Pmax-Ci than 29S at 14/14 and 19/14 °C.
Figure shows the rate of photosynthetic leaf temperature response (P-Ti) of 32R, 29S and Nb under contrasting temperatures. Overall, the P-Ti decreased at a low and high leaf temperatures. It means that when leaf temperatures were ≤20 and >30 °C, the P-Ti decreased, whereas when the leaf temperatures were from 25 to 30 °C, the P-Ti increased. P-Ti showed lower in 32R than in 29S, while showed no difference between 32R and Nb. In addition, P-Ti showed lower at 14/14 °C regime compared to other regimes. Our results agreed with the findings of Kositsup et al. (Citation2009) and Ulqodry et al. (Citation2014) that P-Ti decreased at a low and high leaf temperatures, and showed lower at a low-growth temperature regime compared with at higher growth temperature regimes.
Figure 5. Effects of the growth temperature on the rate of the photosynthetic leaf temperature response of 32R (●), 29S (○) and Nb (△). The absence of a bar indicates that the SD was within the size of the symbol. Different letters indicate significant differences at p < 0.05 (where a is significant among 32R, 29S and Nb; b is significant between 32R and Nb; c is significant between 29S and Nb; and d is significant between 32R and 29S).
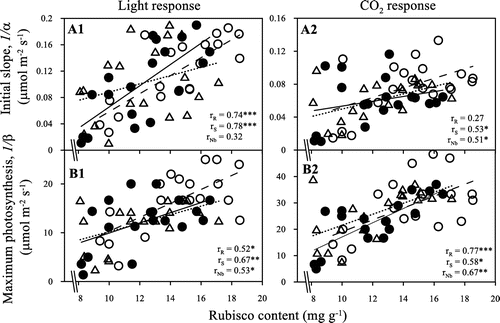
The photosynthetic apparatus was destroyable and trended to be associated with damage to ligh absorption and electron transport components, or deactivated Rubisco activase at low and high temperatures (Sage & Kubien, Citation2007). Ulqodry et al. (Citation2014) reported that cold temperatures reduced the ETR and the maximal quantum efficiency of photosystem II (Fv/Fm) of Rhizophora mucronata leaves because of lowering of chlorophyll contents, causing decrease photosynthetic rates of R. mucronata. Our results agreed with the findings of Ulqodry et al. (Citation2014) that photosynthetic rates and chlorophyll contents were decreased at low temperatures. Furthermore, enzymatic reaction rates at low temperatures, mainly associated with the ‘dark reactions’, are limited, whereas the oxygenating reaction of Rubisco at high temperatures increases more than the carboxylating one so that photorespiration becomes comparably more important (Lambers et al., Citation2008). Our results indicated that the rates of initial slope and maximum photosynthesis correlated strongly with Rubisco (Figure ). These suggest that limitations of the rates of initial slope and maximum photosynthesis related to limitations of the capacities of Rubisco. In addition, cold-resistant genotypes have ability to acclimatize high irradiance (Huner et al., Citation1998) and could alleviate the limitations in ETR and RuBP regeneration compared to cold-susceptible genotypes, thus photosynthetic rates of cold-tolerant genotypes are generally higher than those of cold-susceptible genotypes at low temperatures (Fracheboud & Leipner, Citation2003; Yamori et al., Citation2010). Our results indicated that the rates of initial slope and maximum photosynthesis limited in 32R in compared with in 29S and Nb at low temperatures, 14/14 and 19/14 °C. It means that 32R may contain the characteristics of cold-susceptible genotypes.
Figure 6. Correlations between the Rubisco content with the rate of initial slope (A1 and A2) and maximum photosynthesis (B1 and B2) of 32R (●), 29S (○) and Nb (△). The rR, rS and rNb are r values for 32R, 29S and Nb, respectively. The symbols indicate statistical significance at ***p < .001, **p < .01 and *p < .05.
A previous study identified two genes of 32R which are located in the chromosome 7 that encode cytokinin-O-glucosyltransferase (Gaihre & Nose, Citation2011). Other research was done by Costanzo et al. (Citation2011) also identified two genes that encode for cytokynin-O-glucosyltransferase in the progeny of the ShB-sensitive Cypress and ShB-moderately resistant Jasmine 85. Cytokinins are a major class of plant hormones that significantly influence plant growth and development, usually through interaction with other plant hormones, such as auxin, ethylene, gibberellin and abscisic acid. (Li et al., Citation2015). Glucosyltransferases are the most common enzymes in catalyzing the process of glycosylation, which could transfer sugar moieties from activated donor molecules to specific acceptor molecules such as phytohormone, plant secondary metabolites, amino acids, etc., and some of them were reported to participate in stress adaptation, such as involved in defending pathogen infections (von Saint Paul et al., Citation2011). The lowering of root dry weight of 32R may cause by the limitations of phytohormone during plants growth under low temperature. On the other hand, 32R and 29S were developed from the same parent (Tetep and CN4-4-2) but they had different characteristics. The genetic relationship analysis indicated that 32R had 45% similar to Tetep, while 29S had 91% similar to Nb (Gaihre, Citation2015). The Indica genotypes are adapted to tropical zones, while Japonica genotypes are adapted to subtropical zones (Garris et al., Citation2005). The decreases in growth and photosynthesis during the seedling stage of 32R at low temperatures compared to both 29S and Nb might be due to 32R containing characteristics of the cold-sensitive Indica genotype of Tetep. Although the 32R is cold-sensitive and low yield, it is ShB-resistant (Mutuku & Nose, Citation2012) and a high-yield potential (Gaihre & Nose, Citation2013).
In the present work, we examined the rates of growth and photosynthesis of the ShB-resistant rice genotype during seedling stage under contrasting growth temperatures. These results indicated that the limitations in total dry weight of 32R in compared to 29S and Nb were caused by limitations in its root dry weight, thus causing decrease RGR at low temperatures rather than at high temperatures. Furthermore, the variations in leaf constituents under contrasting temperatures caused the differences in photosynthesis. These results indicated that 32R is cold-sensitive genotype and poor growth. However, prominent genetic traits in 32R, high-yield capacity and ShB resistance, may be useful for the development of a new ShB-resistant rice cultivar with a high yield through the use of QTL pyramiding.
Disclosure statement
No potential conflict of interest was reported by the authors.
Funding
The work was supported by the Government of Vietnam to H. V. Kiet.
References
- Aghaee, A., Moradi, F., Zare-Maivan, H., Zarinkamar, F., Irandoost, H. P., & Sharifi, P. (2011). Physiological responses of two rice (Oryza sativa L.) genotypes to chilling stress at seedling stage. African Journal Biotechnology, 10, 7617–7621.
- Arnon, D. I. (1949). Copper enzymes in isolated chloroplasts. Polyphenoloxidase in Beta vulgaris. Plant Physiology, 24, 1–15.
- Bradford, M. M. (1976). A rapid and sensitive method for the quantitation of microgram quantities of protein utilizing the principle of protein-dye binding. Analytical Biochemistry, 72, 248–254. http://www.academicjournals.org/article/article1380883956_Aghaee%20et%20al.pdf 10.1016/0003-2697(76)90527-3
- Costanzo, S., Jackson, A., & Brooks, S. (2011). High-resolution mapping of Rsn1, a locus controlling sensitivity of rice to a necrosis-inducing phytotoxin from Rhizoctonia solani AG1-IA. Theoretical and Applied Genetics, 123, 33–41.10.1007/s00122-011-1564-1
- Engels, C. H., & Marschner, H. (1990). Effect of sub-optimal root zone temperatures at varied nutrient supply and shoot meristem temperature on growth and nutrient concentrations in maize seedlings (Zea mays L.). Plant and Soil, 126, 215–225.10.1007/BF00012825
- Fracheboud, Y., & Leipner, J. (2003). The application of chlorophyll fluorescence to study light, temperature, and drought stress. In J. DeEll & P. A. Toivonen (Eds.), Practical applications of chlorophyll fluorescence in plant biology (pp. 125–150). Kluwer Academic, Dordrecht: Springer.10.1007/978-1-4615-0415-3
- Gaihre, Y. R. (2015). Study on sheath blight resistance and yielding capacity by phenotype and QTL analysis in rice line 32R. Kagoshima, Japan: Kagoshima University.
- Gaihre, Y. R., & Nose, A. (2011). QTL analysis of sheath blight disease resistance in the rice line 32R derived from Tetep. Japanese Journal of Crop Science, 80, 172–173.
- Gaihre, Y. R., & Nose, A. (2013). High yielding capabilities and genetic variation in crossing of sheath blight disease resistant rice line. Field Crops Research, 149, 133–140.10.1016/j.fcr.2013.04.009
- Gargallo-Garriga, A., Sardans, J., Perez-Trujillo, M., Rivas-Ubach, A., Oravec, M., Vecerova, … K., & Penuelas, J. (2014). Opposite metabolic responses of shoots and roots to drought. Scientific Reports, 4, 1–7.10.1038/srep06829
- Garris, A. J., Tai, T. H., Coburn, J., Kresovich, S., & McCouch, S. (2005). Genetic structure and diversity in Oryza sativa L. Genetics, 169, 1631–1638.
- Huang, B., Rachmilevitch, S., & Xu, J. (2012). Root carbon and protein metabolism associated with heat tolerance. Journal of Experimental Botany, 63, 3455–3465.10.1093/jxb/ers003
- Huner, N. P. A., Oquist, G., & Sarhan, F. (1998). Energy balance and acclimation to light and cold. Trends in Plant Science, 3, 224–230.10.1016/S1360-1385(98)01248-5
- Kanbe, T., Sasaki, H., Aoki, N., Yamagishi, T., & Ohsugi, R. (2009). The QTL analysis of RuBisCO in flag leaves and non-structural carbohydrates in leaf sheaths of rice using chromosome segment substitution lines and backcross progeny F2 populations. Plant Production Science, 12, 224–232.10.1626/pps.12.224
- Kirk, J. T. O. (2011). Photosynthesis as a function of the incident light. In Light and photosynthesis in aquatic ecosystems (pp. 330–387). New York: Cambridge University Press.
- Kobayashi, T., Ishiguro, K., Nakajima, T., Kim, H. Y., Okada, M., & Kobayashi, K. (2006). Effects of elevated atmospheric CO2 concentration on the infection of rice blast and sheath blight. Phytopathology, 96, 425–431.10.1094/PHYTO-96-0425
- Kositsup, B., Montpied, P., Kasemsap, P., Thaler, P., Ameglio, T., & Dreyer, E. (2009). Photosynthetic capacity and temperature responses of photosynthesis of rubber trees (Hevea brasiliensis Müll. Arg.) acclimate to changes in ambient temperatures. Trees – Structure Function, 23, 357–365.10.1007/s00468-008-0284-x
- Lambers, H., Chapin, F. S., III, & Pons, T. 2008. Photosynthesis. In H. Lambers (Ed.), Plant physiological ecology (pp. 11–99). New York, NY: Springer.10.1007/978-0-387-78341-3
- Lee, F. N., & Rush, M. C. (1983). Rice sheath blight: A major rice disease. Plant Disease, 67, 829–832.10.1094/PD-67-829
- Li, Y.-J., Wang, B., Dong, R.-R., & Hou, B.-K. (2015). AtUGT76C2, an Arabidopsis cytokinin glycosyltransferase is involved in drought stress adaptation. Plant Science, 236, 157–167.10.1016/j.plantsci.2015.04.002
- Loveys, B. R., Scheurwater, I., Pons, T. L., Fitter, A. H., & Atkin, O. K. (2002). Growth temperature influences the underlying components of relative growth rate: An investigation using inherently fast- and slow-growing plant species. Plant, Cell and Environment, 25, 975–988.10.1046/j.1365-3040.2002.00879.x
- Makino, A., Mae, T., & Ohira, K. (1988). Differences between wheat and rice in the enzymic properties of ribulose-1,5-bisphosphate carboxylase/oxygenase and the relationship to photosynthetic gas exchange. Planta, 174, 30–38.10.1007/BF00394870
- Makino, A., & Sage, R. F. (2007). Temperature response of photosynthesis in transgenic rice transformed with ‘sense’ or ‘antisense’ rbcS. Plant and Cell Physiology, 48, 1472–1483.10.1093/pcp/pcm118
- Miyagi, S., Agarie, S., Ohno, Y., Ishida, Y.-i, Morinaga, H., & Nose, A. (2006, October 9–11). Proteomic analysis of defense responses in rice resistant line against infection of sheath blight fungus Rhizoctonia solani. The 4th International Symposium on Rice Functional Genomics, Montpellier, France.
- Mutuku, J. M., & Nose, A. (2010). Rhizoctonia solani infection in two rice lines increases mRNA expression of metabolic enzyme genes in glycolytic, oxidative pentose phosphate pathway and secondary metabolism. Tropical Agriculture and Development, 54, 119–131.
- Mutuku, J. M., & Nose, A. (2012). Changes in the contents of metabolites and enzyme activities in rice plants responding to Rhizoctonia solani kuhn infection: Activation of glycolysis and connection to phenylpropanoid pathway. Plant and Cell Physiology, 53, 1017–1032.10.1093/pcp/pcs047
- Nagai, T., & Makino, A. (2009). Differences between rice and wheat in temperature responses of photosynthesis and plant growth. Plant and Cell Physiology, 50, 744–755.10.1093/pcp/pcp029
- Poorter, H., & Remkes, C. (1990). Leaf area ratio and net assimilation rate of 24 wild species differing in relative growth rate. Oecologia, 83, 553–559.10.1007/BF00317209
- Quero, J. L., Villar, R., Maranon, T., Zamora, R., Vega, D., & Sack, L. (2008). Relating leaf photosynthetic rate to whole-plant growth: drought and shade effects on seedlings of four Quercus species. Functional Plant Biology, 35, 725–737.10.1071/FP08149
- Sage, R., Kocacinar, F., & Kubien, D. (2011). Chapter 10 C4 photosynthesis and temperature. In A. S. Raghavendra & R. F. Sage (Eds.), C4 photosynthesis and related CO2 concentrating mechanisms (pp. 161–195). Springer Netherlands: Springer.
- Sage, R. F., & Kubien, D. S. (2007). The temperature response of C3 and C4 photosynthesis. Plant, Cell & Environment, 30, 1086–1106.10.1111/pce.2007.30.issue-9
- Sage, R. F., Way, D. A., & Kubien, D. S. (2008). Rubisco, Rubisco activase, and global climate change. Journal of Experimental Botany, 59, 1581–1595.
- Sharkey, T. D., Bernacchi, C. J., Farquhar, G. D., & Singsaas, E. L. (2007). Fitting photosynthetic carbon dioxide response curves for C3 leaves. Plant, Cell & Environment, 30, 1035–1040.10.1111/pce.2007.30.issue-9
- Ulqodry, T., Matsumoto, F., Okimoto, Y., Nose, A., & Zheng, S.-H. (2014). Study on photosynthetic responses and chlorophyll fluorescence in Rhizophora mucronata seedlings under shade regimes. Acta Physiologiae Plantarum, 36, 1903–1917.10.1007/s11738-014-1566-0
- Villar, R., Maranon, T., Quero, J. L., Panadero, P., Arenas, F., & Lambers, H. (2005). Variation in relative growth rate of 20 Aegilops species (Poaceae) in the field: The importance of net assimilation rate or specific leaf area depends on the time scale. Plant and Soil, 272, 11–27.10.1007/s11104-004-3846-8
- von Saint Paul, V., Zhang, W., Kanawati, B., Geist, B., Faus-Kessler, T., Schmitt-Kopplin, P., & Schaffner, A. R. (2011). The arabidopsis glucosyltransferase UGT76B1 conjugates isoleucic acid and modulates plant defense and senescence. The Plant Cell, 23, 4124–4145.10.1105/tpc.111.088443
- Vu, J. C. V., Gesch, R. W., Pennanen, A. H., Allen Hartwell, L. H. J., Boote, K. J., & Bowes, G. (2001). Soybean photosynthesis, Rubisco, and carbohydrate enzymes function at supraoptimal temperatures in elevated CO2. Journal of Plant Physiology, 158, 295–307.10.1078/0176-1617-00290
- Wasano, K., Hirota, Y., & Kido, Y. (1985). Varietal differences in the resistance to sheath blight of rice, Rhizoctonia solani Kuhn, and the effectiveness of selection for the resistance from the cross, Tetep x CN4-4-2. Report of the Kyushu Branch of the Crop Science Society of Japan, 52, 16–22*.
- Yamasaki, T., Yamakawa, T., Yamane, Y., Koike, H., Satoh, K., & Katoh, S. (2002). Temperature acclimation of photosynthesis and related changes in photosystem II electron transport in winter wheat. Plant Physiology, 128, 1087–1097.10.1104/pp.010919
- Yamori, W., Hikosaka, K., & Way, D. (2013). Temperature response of photosynthesis in C3, C4, and CAM plants: Temperature acclimation and temperature adaptation. Photosynthesis Research, 119 (1): 101–117.
- Yamori, W., Noguchi, K., Hikosaka, K., & Terashima, I. (2010). Phenotypic plasticity in photosynthetic temperature acclimation among crop species with different cold tolerances. Plant Physiology, 152, 388–399.10.1104/pp.109.145862